Abstract
The study presents a recursive least-squares estimation method with an exponential forgetting factor for noise removal in functional near-infrared spectroscopy data and extraction of hemodynamic responses (HRs) from the measured data. The HR is modeled as a linear regression form in which the expected HR, the first and second derivatives of the expected HR, a short-separation measurement data, three physiological noises, and the baseline drift are included as components in the regression vector. The proposed method is applied to left-motor-cortex experiments on the right thumb and little finger movements in five healthy male participants. The algorithm is evaluated with respect to its performance improvement in terms of contrast-to-noise ratio in comparison with Kalman filter, low-pass filtering, and independent component method. The experimental results show that the proposed model achieves reductions of 77% and 99% in terms of the number of channels exhibiting higher contrast-to-noise ratios in oxy-hemoglobin and deoxy-hemoglobin, respectively. The approach is robust in obtaining consistent HR data. The proposed method is applied for both offline and online noise removal.
Keywords: Functional near-infrared spectroscopy (fNIRS), Hemodynamic response (HR), Recursive least squares estimation (RLSE), Exponential forgetting, Real time estimation, State space model
Introduction
Functional near-infrared spectroscopy (fNIRS) is a non-invasive optical brain imaging technique that measures oxy-hemoglobin (HbO) and deoxy-hemoglobin (HbR) concentrations in the brain (or body) [1]. A continuous wave fNIRS (CW-fNIRS) system detects a brain activity based on the intensity changes of the detected light while a constant intensity of the incident light is continuously exposed on the brain. The incident light from the emitters placed on the subject’s scalp penetrates several layers of brain tissue (i.e., the scalp, skull, cerebrospinal fluid, gray matter, and white matter), during which some photons are deflected/scattered; pass through the layers, and are detected by a detector (i.e., optode, photodiode) positioned on the scalp approximately at a distance in the range of 0.5–5.5 cm from the emitters [2, 3]. The intensity changes in the detected lights are then utilized to compute the changes of HbO and HbR by using the modified Beer–Lambert law (MBLL) [1, 4–9]. The advantages of the fNIRS technique are non-invasive, inexpensive, quiet, harmless, and portable. It is especially promising for real-time and mobile applications (e.g., daily living environment, intensive aerobic exercises) [10–13]. Recently fNIRS has been shown as appropriate for neuronal activity detection [14–16] and brain–computer interface (BCI) [7, 17–20].
Event-related fNIRS signals are normally contaminated by physiological noises (i.e., heartbeat, respiration, and Mayer waves), extra-cortical physiological noises from the superficial layers, and motion artifacts. This leads to inaccuracies in the obtained cortical activity data. Therefore, it is necessary to remove these noises prior to analyzing the targeted brain functions [21]. Several approaches to reduce these noises were applied in extant studies.
In relation to the motion artifacts that normally originate from the subject’s body movement during the experimentation, various methods including Wiener filtering [22], correlation-based signal correction [23], wavelet transform [24], combined moving average and wavelet [25], an autoregressive model [26], spline interpolation [27], independent component analysis (ICA) [28], targeted principle component analysis (tPCA) [29], and kurtosis-based wavelet filtering [30] were utilized for removal, reduction, and/or correction. Specifically, the wavelet transform [24], tPCA [29], and kurtosis-based wavelet transform [30] are associated with increasing effectiveness when compared with other methods in the reduction of motion artifacts. Least mean squares (LMS) approaches were intended to reduce physiological noises from the superficial scalp and skull layers [31, 32]. Also a recursive least-square estimator (RLSE) was demonstrated in Zhang et al. [33] with fNIRS data generated by Monte Carlo simulation (no experimental data), in which the optode configuration including short- and long- separation channels was utilized to get both superficial and brain tissue components from the five-layer slab model. The RLSE algorithm is faster computationally than the LMS method. In addition, it was demonstrated that a short-separation channel of less than 9 mm was robust to the signal variation in the superficial layer. For investigating noise reduction, various approaches (i.e., band-pass filtering, correlation-based signal improvement, median filtering, Savitzky–Golay filtering, wavelet denoising, and ICA) have been pursued [34].
Recently, physiological noises (approximately 0.1 Hz for Mayer wave, 0.25 Hz for respiration, and 1 Hz for a heartbeat) have been modeled as a sum of sinusoidal functions [10, 35–37] and estimated by using a general linear model (GLM) [10, 38] or an autoregressive moving average model with external inputs [37]. Specifically, Prince et al. [35] proposed a physiological noise model consisting of three sine and cosine functions in which the frequencies of heartbeat, respiration, and Mayer wave were assumed as known. The amplitudes of the sine and cosine functions are estimated by using the extended Kalman filter. In a manner similar to Prince et al. [35], Abdelnour and Huppert [10] used three sinusoidal functions in their physiological noise model. It is noted that Scarpa et al. [36] used the same model of Prince et al. for physiological noise removal although the number of sine/cosine components varied based on the provided data, and it is claimed that the amplitudes of these components (in addition to the Kalman filtering technique) were estimated by using the least-square estimation method [36]. To obtain the corrected signals, the estimated physiological noise signal was subtracted from the acquired signals. Subsequently, the corrected signal of each trial was filtered by a Bayesian approach to improve the accuracy of the HR estimation. Specifically, diverse adaptive filtering approaches [10, 21, 31, 32, 35, 36, 38] are used for other noise reductions.
An emitter-detector pair of distance less than 1 cm is termed as a short-separation (SS) channel. This type of SS channel is used to acquire the noise in the superficial layer because the detected light in this case passes only through the superficial layer and does not reflect any cognitive activity [36, 39–44]. Saager and Berger [39] and Saager et al. [39, 41] suggested a method to reduce superficial noises by subtracting one SS measurement from a long-separation measurement. Additionally, Zhang et al. [33] demonstrated that a RLSE based adaptive method significantly reduced the superficial noises. In their study, the superficial noise estimated through the coefficient of one SS channel within the framework of RLSE. Recently, the long-separation measurement has been modeled as a linear form consisting of the expected HR and SS measurement [40, 42, 43]. It is noted that the weights of canonical functions (i.e., a combination of 15 Gaussian functions) and the amplitudes of SS data were estimated by using the Kalman filter approach. Their proposed method revealed a significant improvement in both HbOs and HbRs when compared to those obtained by the traditional adaptive filter or the standard GLM model. Additionally, Sato et al. [44] estimated the extra-cortical signal by using the GLM model, and subsequently, the corrected HR was obtained by subtracting the estimated extra-cortical signal from the measured long-separation channel signal.
Clearly, fNIRS data are contaminated by extra-cortical noises from the extra-cortical layers that occur when the light travels through the extra-cortical layers (i.e., scalp, skull, cerebrospinal fluid) prior to/after reaching the cortical layers (i.e., gray and white matter). Superficial noises are exposed in either single-SS [42] or double-SS measurement [43]. The fNIRS data obtained by the SS detectors (emitter-detector pair distance: 0.5 cm) contains extra-cortical physiological noises while data obtained by the long-separation detectors (emitter-detector pair distance: approximately 3 cm) contains HR information for both extra-cortical and cortical tissues [39, 42]. The SS measurements have been included in the GLM model involving the expected brain HR [42, 43], and the proposed Kalman estimator method obtained the efficiency of noise reduction up to 50 and 100% [42]. Additionally, Gagnon et al. [43] demonstrated that the use of the double-SS measurement reduces noises in the HbO and HbR by 59% and 47%, respectively.
In the fNIRS field, the canonical HR functions were usually generated by a combination of gamma functions [45, 46]. However, the state-space model developed in [46] is specifically convenient when compared with the use of canonical HR functions in which the impulse HR for an impulse stimulation at a specific cortex was reconstructed as a state-space equation by using the subspace identification method. It should be noted that the shapes of impulse HRs in individual cortices are different. Thus, the expected HR for an arbitrary stimulus is generated online (or in real-time).
In the study, we propose an adaptive-filter-based method to reduce physiological and superficial noises in fNIRS data. The mathematical model for filtering is a linear form comprised of the following four main components: the expected HR, SS data, the sum of sinusoidal functions representing physiological noises, and the baseline drift. The expected HR is generated with given stimuli by using the state-space model developed in [46]. The SS data (emitter-detector distance: 0.5 cm) are utilized to obtain the extra-cortical noise from the superficial layer. The physiological noises are modeled as a sum of three sinusoidal functions by following the method developed in [10, 35, 36]. In order to estimate the baseline value, the corresponding element in the regression vector is set to unity although its coefficient b0 (i.e., b0 × 1) is estimated (see “Methodology” section for more details). The unknown parameter vector in the proposed model is estimated by using the RLSE with an exponentially forgetting factor. Finally, the efficacy of the proposed method is demonstrated by using experimental right-finger-movement fNIRS data obtained from the left motor cortex. Our experimental results indicate that the proposed method significantly reduces physiological and superficial noises when compared with the existent approaches. Thus, it is possible to apply the proposed method to remove noises in both offline and online cases.
Methodology
Theory (brain activity model)
In this study, the hemodynamic response caused by a brain activity is modeled in a linear form as follows:
| 1 |
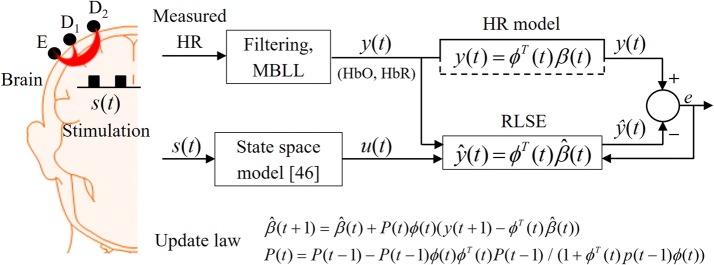
where t denotes the discrete time, y(t) represents the measured HR signal acquired by a pair of long-separation optodes (for e.g., E-D2 pair in Fig. 1) at time t; u(t) denotes the expected HR generated by a state-space model [46]; Δu(t) and Δ2u(t) denote the first and second derivatives of u(t), respectively; (in which the subscript SS refers to short-separation) denotes the extra-cerebral physiological noise in the superficial layer (e.g., the channel E-D1 in the emitter side in Fig. 1); fm denotes the frequencies of physiological noises; q denotes the total number of physiological noises (in this study, q is set to 3); yb denotes the term introduced to correct the baseline per trial; ε(t) denotes the white Gaussian noise, and a1, a2,… a4, b1, b2,…, bq, and b0 denote unknown coefficients that are to be estimated. In extant studies, three important frequencies of physiological noises are 1 Hz (cardiac), 0.25 Hz (respiratory), and 0.1 Hz (low frequency arterial blood pressure oscillation) [47, 48]. In the study, these three frequencies were estimated with the fft function available in MATLAB (MathWorks Inc.) from the data of the initial resting state data.
Fig. 1.
Schematic of workflow for processing hemodynamic responses (HRs): E-D1/E-D2 illustrate short-/long-separation channels, respectively (MBLL modified Beer–Lambert law)
Equation (1) is rewritten as follows:
| 2 |
where ϕ(t) = [u(t) Δu(t) Δ2u(t) ySS(t) sin(2πf1t) sin(2πf2t) … sin(2πfqt) 1]T denotes the regression vector, β(t) = [a1 a2 … a4 b1… bq b0]T denotes the unknown coefficient vector, and the superscript T denotes the transpose operator. Additionally, β(t) is estimated by the RLSE approach. According to previous works in the control field, the RLSE algorithm gives a good performance in parameter estimation [49–52] and could be utilized in real-time applications [53–56]. Therefore, this algorithm is chosen to estimate unknown parameter vector β(t). Thus, by using Eq. (2), the estimated brain activity is represented as follows:
| 3 |
where ^ denotes the estimated values. We denote as the estimated parameter vector, which is obtained by optimizing the cost function (where λ denotes the forgetting factor). Its recursive update law is given as follows [57]:
| 4 |
where P(t) denotes the covariance matrix. We assume that is the estimation error.
Figure 1 illustrates a schematic for brain activity estimation. The detectors’ light intensities are acquired by dual-wavelength CW-fNIRS (i.e., 760 and 830 nm). We assume that s(t) is the (arbitrary) stimuli that activates a certain brain region, which corresponds the input signal to the state-space model. The output of the box is termed as the expected/desired HR because we expect the HR to exhibit this type of a response. Additionally, its first and second derivatives are used in Eq. (1) as components in the regression vector. The difference between the measured data and the estimated data (i.e., e(t)) was utilized in updating the parameter vector , see (4). In the present study, the proposed method was applied to detect right-finger-movements in the left motor cortex.
Thus, to illustrate the necessity to estimate the frequencies of physiological noises, two cases are discussed (i.e., fm vs. , fixed and estimated). First, to eliminate a possible contribution of superficial noises in the comparison, the SS channels are ignored. Therefore, the two following models are utilized.
| 5 |
| 6 |
It is noted that the fixed frequencies of fm (0.1 Hz, 0.25 Hz, and 1 Hz) in (5) were obtained from [10, 37] and the estimated frequencies in (6) were obtained from the measured data during the resting state by using the fft function available in MATLAB.
The main objective of the current study is to reduce both physiological and superficial noises. In addition, from (3) is extracted for the estimated HR. It is noted that the physiological noise frequencies are estimated on-line and are subsequently included in (3). The parameters are estimated using the RLSE approach. Both numerical and real experimental data are processed. The RLSE method is utilized to estimate the weights of the linear combination of the expected HR and physiological noises (i.e., heart and respiratory waves).
Numerical validation of RLSE
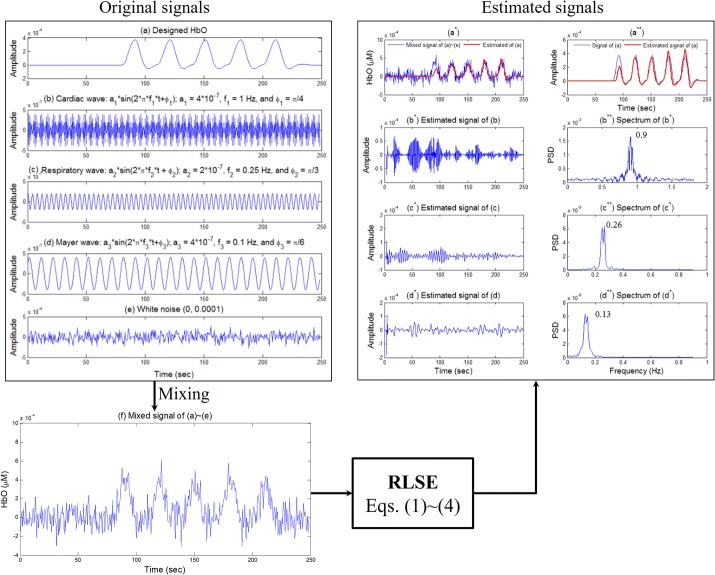
Numerical simulations are performed to validate the appropriateness of using of the RLSE algorithm for decoding brain hemodynamics. First, five related signals are intentionally mixed, see Fig. 2: a the expected HbO signal, b a cardiac signal, c a respiratory signal, d a typical Mayer wave, and e a white noise with zero mean and standard deviation of 10−4. The mixed signal of five signals is shown in Fig. 2f. In the process, the values of the amplitudes and frequencies of physiological noises were adopted from [36]. The proposed method of Eqs. (1)–(4) is applied to the mixed signal to estimate the original five signals as shown in Fig. 2a* and a**. Specifically, the estimated HbO (the red thick curve) in Fig. 2a** was obtained by computing the first three terms, i.e., . Figures 2b*–d* correspond to the estimated physiological noises of Fig. 2b–d, respectively. Figures 2b**–d** denote the spectra of Fig. 2b*–d*, respectively. As shown in Fig. 2a**, the estimated HbO (the red curve) is gradually updated to the desired HbO (the blue curve in Fig. 2a). Furthermore, the estimated frequencies of cardiac (0.9 Hz), respiratory (0.26 Hz), and Mayer (0.13 Hz) waves (see Fig. 2b**–d**) are sufficiently close to the known ones in Fig. 2b–d, respectively. The result demonstrates that the proposed method effectively extracts the correct HbO and the physiological noises.
Fig. 2.
Numerical verification of the proposed recursive least squares estimation (RLSE) method with an exponential forgetting factor to extract physiological noises: a Expected HbO, b cardiac, c respiratory, d Mayer wave, and e white noise with zero mean and standard deviation of 10−4, f mixed signal of a–e; a* a comparison of f and the estimated signal of a; b*–d* the estimated signals of b–d; b**–d** the spectra of b*–d*, respectively
Experimental paradigm design and verification
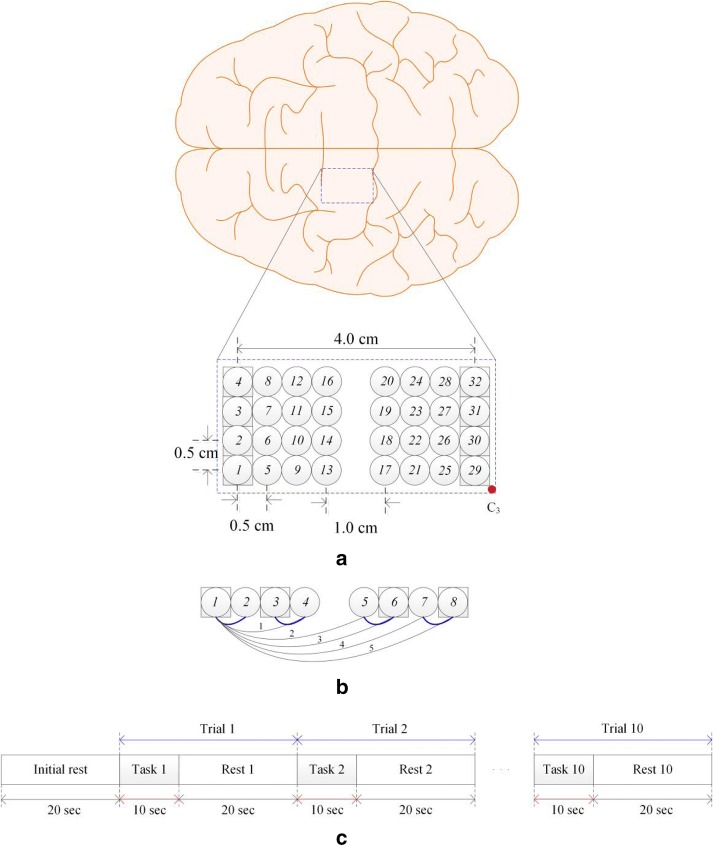
Figure 3a shows an optode arrangement for verifying the developed method in which multiple emitters and detectors are placed side by side (as a bundle) to form multiple short- and long-separation channels [58, 59] Additionally, according to Zhang et al. [33], since short-separation less than 9 mm was robust in various layers, all short-separation channels with 5 mm distance are therefore configured in the current study. And each optode is used as either an emitter or a detector. Figure 3b depicts a set of short- and long-separation channels: The squares in Fig. 3b represent emitters, and the circles are detectors. Specifically, the pairs 1–2, 3–4, 5–6, and 7–8 are SS channels (0.5 cm apart). The long separation channels (i.e., approximately 1.5–4.0 cm apart) are numbered in plain text underneath, i.e., 1–4, 1–5, 1–6, 1–7, and 1–8.
Fig. 3.
a Bundled-optode configuration of 40 channels to detect right-finger movements in the left motor cortex (squares and circles represent emitters and detectors, respectively); b an example of short-/long-channel measurements (short: 1–2, 3–4, 5–6, 7–8; long: 1–4, 1–5, 1–6, 1–8, etc.; for instance, if Ch. 1 is composed of emitter 1 and detector 4, pairs 1–2 and 3–4 are used as a SS channel for Ch.1′s noise removal); and c experimental paradigm (five trials for thumb and little-finger movements each, which were randomly performed)
In Ch. 1, which is composed of emitter 1 and detector 4, two SS measurements are considered (i.e., 1–2 or 3–4). Either measurement is included in Eq. (1). Five long-separation channels are considered when optode 1 emits light. Similarly, an additional five channels are formed from the right to the left when optode 8 shoots light. Therefore, ten channels are created in each row. In the study, only a total of 40 channels (eight channels for five distances: 1.5, 2.5, 3.0, 3.5, and 4.0 cm) were included in computation owing to the computation time constraints. Figure 3c illustrates the experimental paradigm to detect right-finger-movement brain activity.
Study participants
Five healthy male participants (mean age 36.2; range: approximately 33–37 years) with shaved hair were invited to perform experiments (thumb and little-finger movements) involving the left motor cortex. None of the subjects exhibited any neurological impairments or mental disorders. Four of the subjects were right-handed. To eliminate any interference from the external noise, the experiments were conducted in a dark and quiet room. The subjects were asked to sit comfortably on a chair and not to move their body during the experiment. Prior to starting the experiment, the subjects were carefully trained in how to move their fingers.
Figure 3c illustrates the experimental paradigm: An experiment comprised of ten trials of little-finger and thumb movements; and a trial consisted of a 10 s task and a 20 s rest. After a 20 s initial rest period prior to the first trial, each subject was asked to move their fingers (i.e., flexion and extension) for 10 s by watching the screen in which each finger randomly appeared five times. Therefore, an experiment corresponded to a total of 320 s. To increase the brain activity during the 10 s task period, the subjects were asked to move their (right) little-finger/thumb as fast as possible without paying attention to the number of flexions/extensions and to relax during the 20 s rest period. A laptop computer with a 15-inch screen was utilized to display pictures indicating each finger. The distance between the subject’s eyes and the laptop screen was adjusted as approximately 60 cm such that the subjects could clearly see the indicated fingers. The subjects were also instructed to keep their eyes open during the experiments. During the rest period, a black screen was displayed to relax the subjects’ eyes.
The optodes in Fig. 3a were positioned over the subject’s left motor cortex to record the HRs to the right finger movements. Prior to the experiments, the nature of the experimental procedures was clearly explained to the subjects. All the experiments in the study were performed following the guidelines of the Institutional Review Board of Pusan National University, and informed consent were obtained from all the subjects based on the Declaration of Helsinki.
Equipment and data conversion
Dual-wavelength continuous-wave fNIRS (DYNOT, NIRx, USA) was utilized to measure the brain’s hemodynamic responses. The intensities of the detected light were converted to hemoglobin concentration changes by using the MBLL. A total of 40 channels over the left motor cortex were configured at a sampling rate of 1.81 Hz. In the present study, the recorded fNIRS data drifted in time [45, 58, 59], and thus a baseline-correction method was applied. Specifically, a 4th order polynomial was fit to the data, and the obtained curve was subtracted from the original data to remove the drift [59, 60].
Contrast-to-noise ratio
The contrast-to-noise ratio (CNR) denotes the weighted difference between the mean of the signal during the task and that during the rest period [23, 59]. To validate our proposed method, the CNRs were used to check the signal-to-noise ratio, since a high CNR value indicates a high ratio of the signal upon the task relative to that to noise. The CNR is computed as follows:
| 7 |
where “task” indicates the task period and “rest” denotes the rest period prior to finger movement. In the present study, the “task” window was set to a duration of approximately 4–14 s, and the “rest” window was set to a duration of approximately to -6–0 s from the onset.
Results and discussion
Physiological noises during the rest state
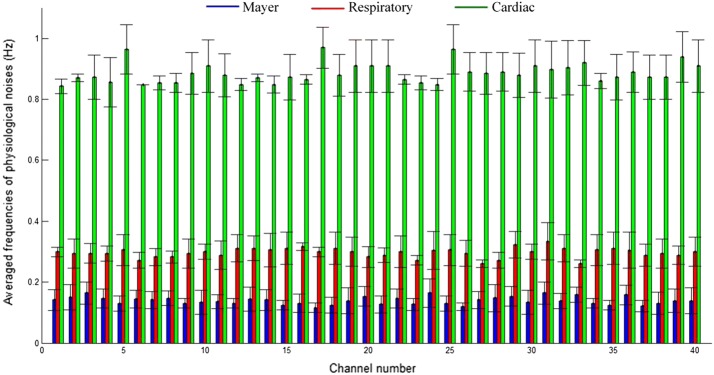
Figure 4 compares the average frequencies of Mayer, respiratory, and cardiac signals during the initial 20 s resting period (see Fig. 3c) over 5 subjects. As observed, the averaged frequencies (Mayer, respiratory, cardiac: 0.14, 0.3, and 0.89 Hz, respectively) are extremely consistent throughout the channels. The result also agrees with those in previous studies [47, 48, 61]. However, variations exist per subject (and per time, for e.g., morning and afternoon), and thus, these frequencies are estimated online for each experiment by using the initial resting state data. Finally, the estimated frequencies were reflected as shown in (3).
Fig. 4.
Averaged frequencies (over five subjects) of all 40 channels during the initial 20 s resting period prior to the first trial
Verification of the proposed method
Our main objective involved reducing the physiological and superficial noises and subsequently extracting the correct HR from fNIRS data. In extant studies, Abdelnour and Huppert [10] proposed a brain activity model including two main components, namely the expected HR and the sum of three sinusoidal functions representing the physiological noises. Their proposed method demonstrated a significant reduction in the physiological noises although the frequencies of those noises were assumed constant. In the study, we use a linear model in which the physiological noise frequencies are estimated online during the initial resting state (prior to the first trial). Thus, by using the fft function, they are computed at the initial 20 s resting period per channel. Additionally, those estimated frequencies are included into the fm in Eq. (3).
A SS measurement records the extra-cortical noise in the superficial layer while a long-separation channel includes the brain HR from both the cerebral cortex and the superficial layer [41–43, 62]. In the current study, SS measurements were utilized as reference channels to remove noises in the superficial layer.
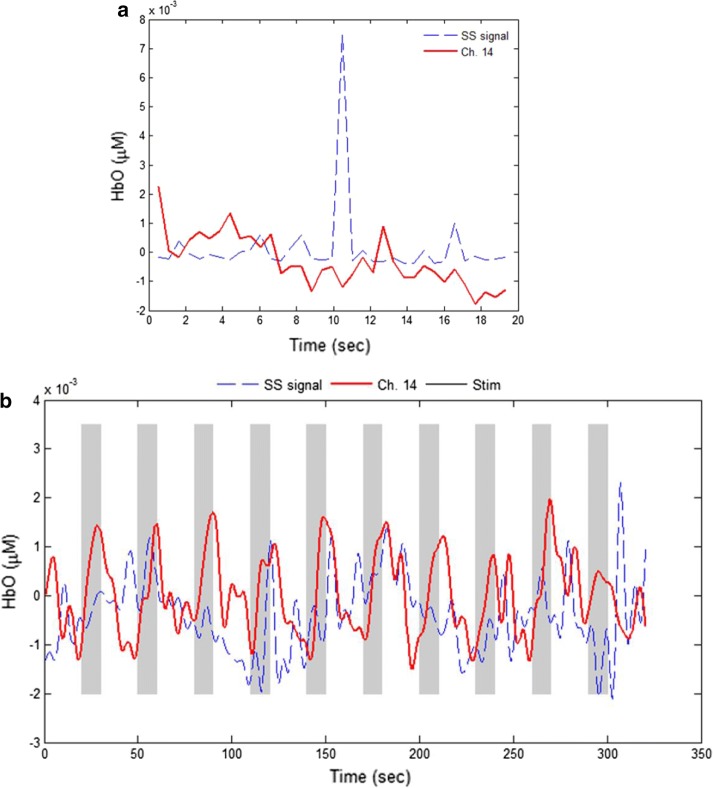
To investigate whether the extra-cortical noise and the physiological noise are related, the correlation coefficients between the raw SS signals and the active long-separation channel data during the initial 20 s resting period were computed. In most channels, the correlation coefficients were less than 0.34. Figure 5a depicts an example of SS data and a long-separation channel (Ch. 14, Sub. 2): In this case, the correlation coefficient was − 0.15. The peak(s) in the dashed line is due to the shift of an optode during the experiment. Ch.14 was specifically chosen because the correlation coefficient between the channel and its short-separation channel was the lowest with respect to all the channels. Additionally, in most cases, the correlation coefficients between the filtered SS data and the active long-separation signals were less than 0.38. Figure 5b compares the entire data (320 s) of a SS signal and Ch. 14 of Sub. 2 in which the correlation is only 0.099. Thus, it is concluded that the extra-cortical noise and the physiological noises are not correlated. The experimental data confirmed that the SS data only contained the extra-cortical noise and did not include brain-activity related physiological noises.
Fig. 5.
Comparison of a SS channel and an active long-separation channel (Sub. 2, Ch. 14 was formed by optodes 4 and 28 in Fig. 3a): a Raw data during the initial 20 s resting period (the peak in blue curve is due to head movement). Correlation (r = − 0.15) of raw short- and active long-separation channel in the 20 s resting state. b Band-pass-filtered signals (cut-off frequencies: 0.01 and 0.15 Hz) of both data for the entire experimental period. Correlation (r = 0.099) of short- and active long-separation channel
Physiological noises between known and estimated frequencies
To investigate the effectiveness of physiological noise frequency estimation, we compared the two brain activity models in (5) and (6), respectively. In (5), three frequencies (i.e., 0.1 Hz, 0.25 Hz, and 1 Hz) corresponded to fixed constants in three sinusoidal functions. However, as shown in (6), the frequencies were estimated online from the initial 20 s resting-state period, and the estimated values per experiment were then used in the RLSE method.
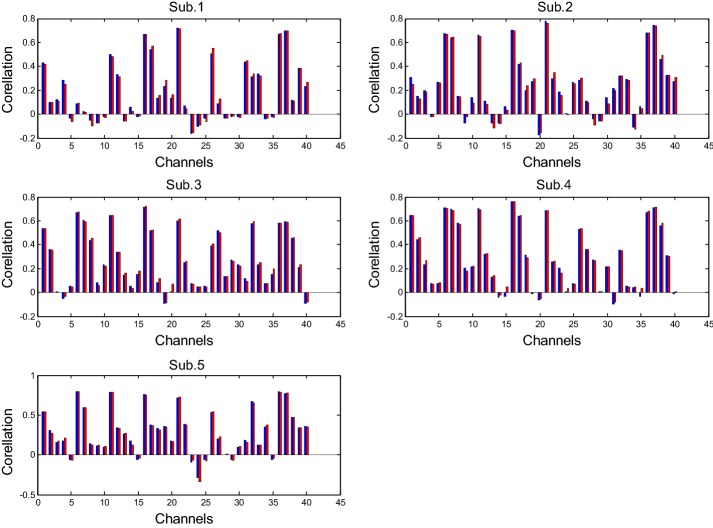
Figure 6 compares the correlation coefficients between the desired HR and the estimated HR that was obtained by using the fixed frequencies (blue bars) and the estimated physiological frequencies (red bars) over 40 channels and 5 subjects. The results show that the percentage improvement in terms of the number of improved channels of Subs. 1–5 by using the estimated frequencies over the fixed ones correspond to 55, 30, 47.5, 45, and 47.5%, respectively. Thus, this indicates that the estimation of the physiological noise frequency did not result in a significant improvement.
Fig. 6.
Comparison of correlation coefficients between the desired HRs and the estimated HRs (blue bars: fixed frequencies, red bars: estimated frequencies): For Sub. 1, the number of red bars that exceed the number of blue bars is 22 (out of 40), and this results in 55%
Figure 7 plots the estimated HbO of a representative channel (Ch. 16, Sub. 2) by using our proposed method in which Ch. 16 was created by optodes 5 and 17. Figure 7a illustrates the raw HbO data (blue curve) and the estimated data (red thick curve, in Eq. (3)). Figure 7b compares the power spectra of both raw and filtered HbOs approximately within the 0–1 Hz range. As shown in Fig. 7b, the proposed method significantly reduced the physiological noises.
Fig. 7.
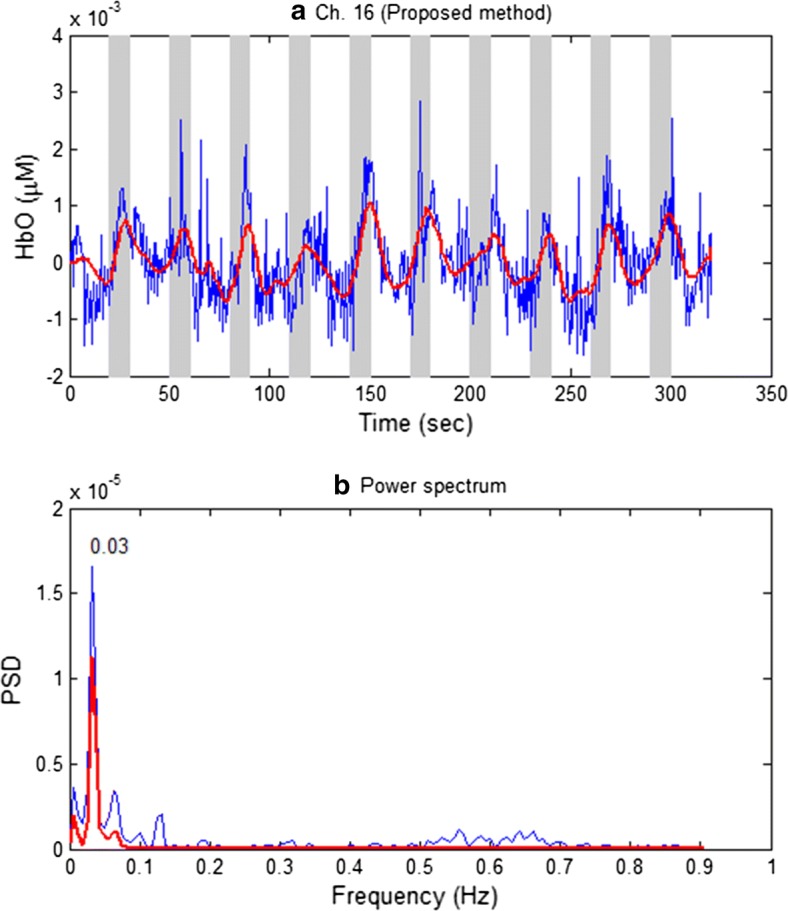
a Raw HbO data (blue curve) relative to the estimated HbO (red thick curve) by using the proposed method, b power spectra of a (Ch. 16, Sub. 2)
The proposed method was compared with a conventional method. The low-pass filtering (LPF) approach was popular, and thus a cut-off frequency of 0.15 Hz was applied to the raw data in Fig. 7a: The thick red curve in Fig. 8a denotes the LPF-ed HbO, and its power spectra is shown Fig. 8b. The result reveals that it was not possible to eliminate the physiological noises at 0.012, 0.069, and 0.12 Hz frequencies, by using the LPF method.
Fig. 8.
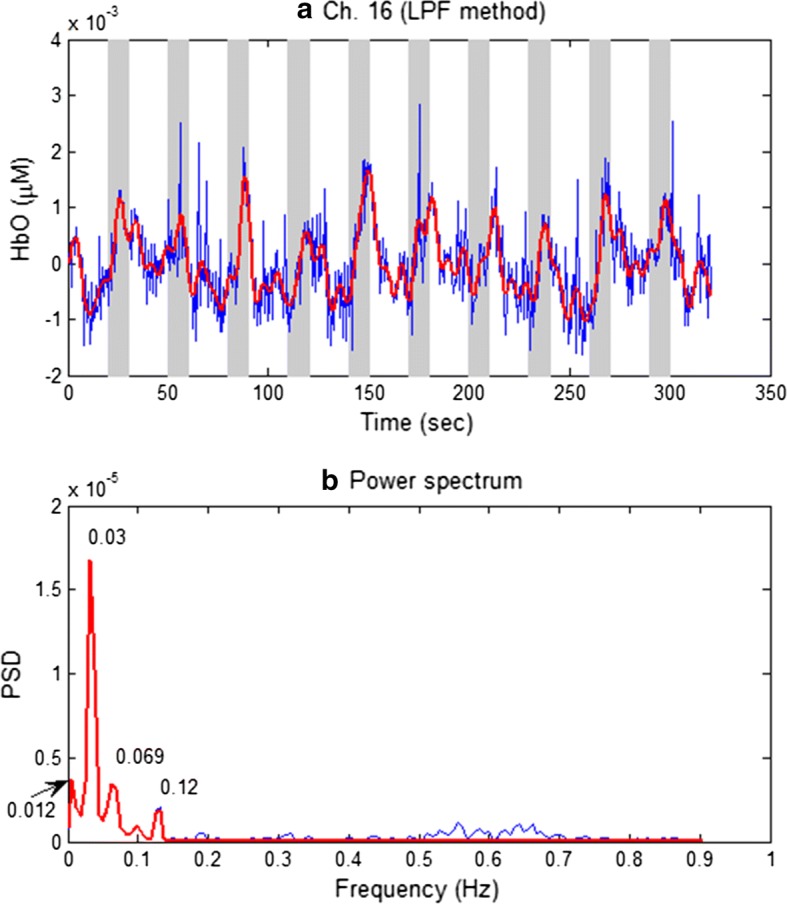
a Raw HbO data (blue curve) relative to the low-passed filtered HbO (thick red curve) with 0.15 Hz cut-off frequency, b the power spectra of a that shows the existence of physiological noises
For further validation, an ICA based approach was utilized to reconstruct the HR [45]. The task of the ICA approach involved recovering the unknown source signals from the measured fNIRS data. In the process, the number of source signals was assumed as equal to the number of measured signals [63]. The steps of ICA included preliminary whitening of the measured data and estimation of orthogonal ICA transform to obtain the weight vector of all channels. Finally, the independent component (IC) or source signals were estimated from the estimated weight vector and measured data (see [45, 63, 64] for more details). The ICA decomposition was performed several times to yield similar ICs [64]. Figure 9a shows a reconstructed HbO by the ICA approach in which the data of 40 long-separation channels (Sub. 2) are used. As shown in Fig. 9b, the noise frequencies of 0.07 and 0.11 Hz were not eliminated.
Fig. 9.
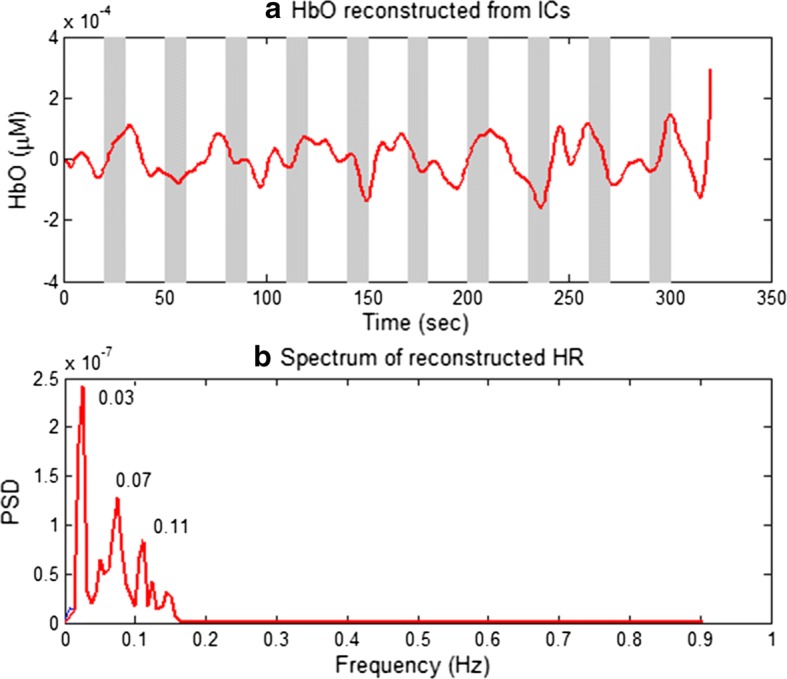
a A reconstructed HbO (red thick line) by using the ICA approach (Sub. 2), b the spectrum of a: ICA decompositions were run 10 times; and the reconstructed one is the one with the highest t-value in each trial
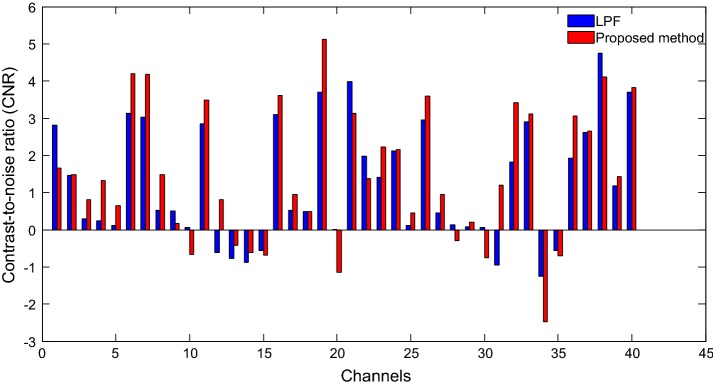
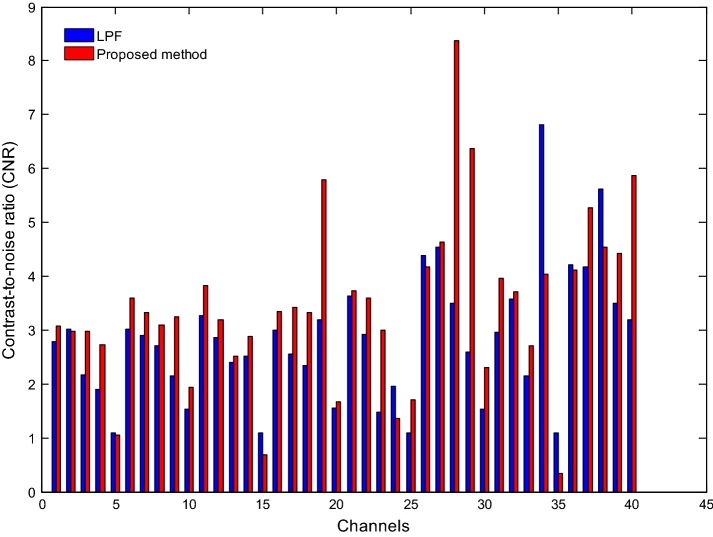
To further validate the proposed method, CNRs in Eq. (7) were compared for both the LPF method and the proposed approach. In the process, the time windows approximately in the range of 4–14 s and − 6–0 s were assigned as “task” and “rest”, respectively. Figure 10 compares the CNRs of the HbOs obtained by two methods: LPF and the proposed method (Sub. 2). As shown, the CNRs of the proposed method (red bars) exceeded those of the LPF method (blue bars). Additionally, the CNRs of the HbRs obtained by the two approaches are shown in Fig. 11. The results indicated that CNRs of the proposed method exceeded those computed by the LPF method in all channels. The result demonstrates that the proposed method extracted the expected HR more precisely by significantly reducing noise.
Fig. 10.
Comparison of CNRs of the HbOs obtained by the LPF approach (blue bars) and the proposed method (red bars) (Sub. 2): The proposed method shows that the number of channels exhibiting improved CNR is higher
Fig. 11.
Comparison of CNRs of the HbRs obtained by the LPF approach (blue bars) and the proposed method (red bars) (Sub. 2)
Comparison with/without the sum of sinusoidal functions
Figure 12 compares the estimated HbOs obtained by the proposed model with and without the addition of the sum of three sinusoidal functions (Ch. 21, Sub. 3) as follows: Ch. 21 was composed of optodes 18 and 30 and was selected because it presented distinguishable results for two methods. The results show that when the physiological noise frequencies are estimated during the 20 s initial resting period prior to the first trial, the proposed method with sinusoidal functions reduced the trial-to-trial variation [65] while the approach without using these terms did not reflect this.
Fig. 12.
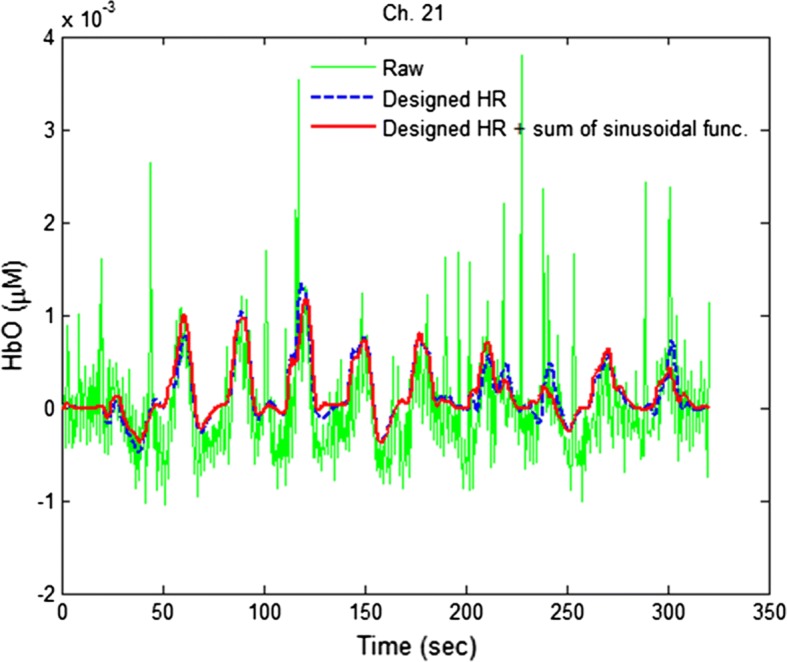
Comparison of HbOs obtained by the proposed model with (red thick curve) and without (blue dashed curve) by using the sum of sinusoidal functions (Ch. 21, Sub.3)
Comparison with Kalman filter
Kalman filter is a recursive tracking estimator. The approach estimates the states of a process by using an updated regularized linear inversion scheme [38, 52, 66, 67]. Therefore, the performance of our proposed method was compared with that of a Kalman filter. In the study, the same linear model in Gagnon et al. [40] consisting of two components (canonical HR and SS measurement) is used. It is noted that the canonical HR is a set of 15 Gaussian functions. Additionally, the initial state and process noise covariance matrices were set to identity matrices with diagonal entries of 1 × 10⁻¹ and 5 × 10⁻⁴, respectively, which are the same as those in Gagnon et al. [40]. Figure 13 shows a comparison of the HbOs obtained by a Kalman estimator (blue dashed curve) and the proposed method (red thick curve). The results indicate that our proposed method was comparable with the Kalman filter.
Fig. 13.
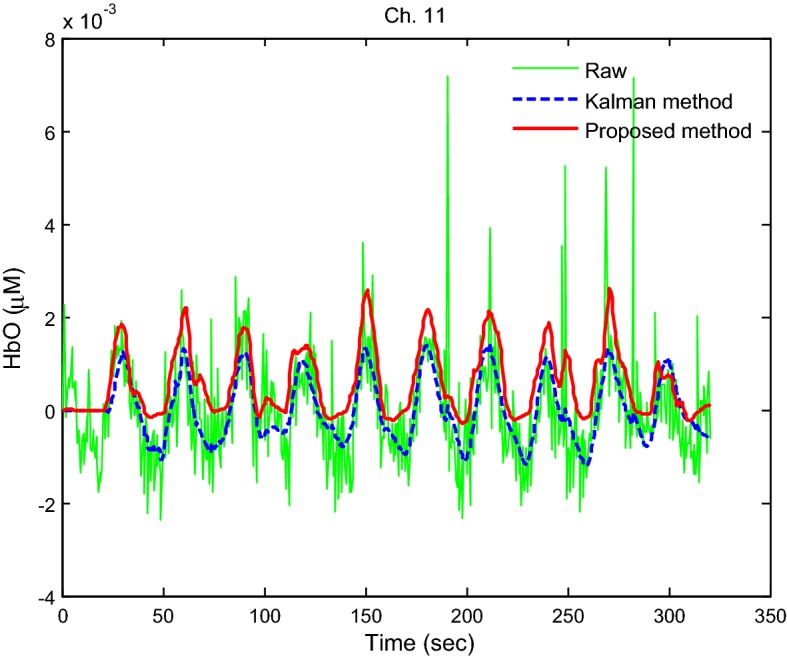
Comparison of the HbOs obtained by the proposed method (red thick curve) and a Kalman filter (blue dashed curve)
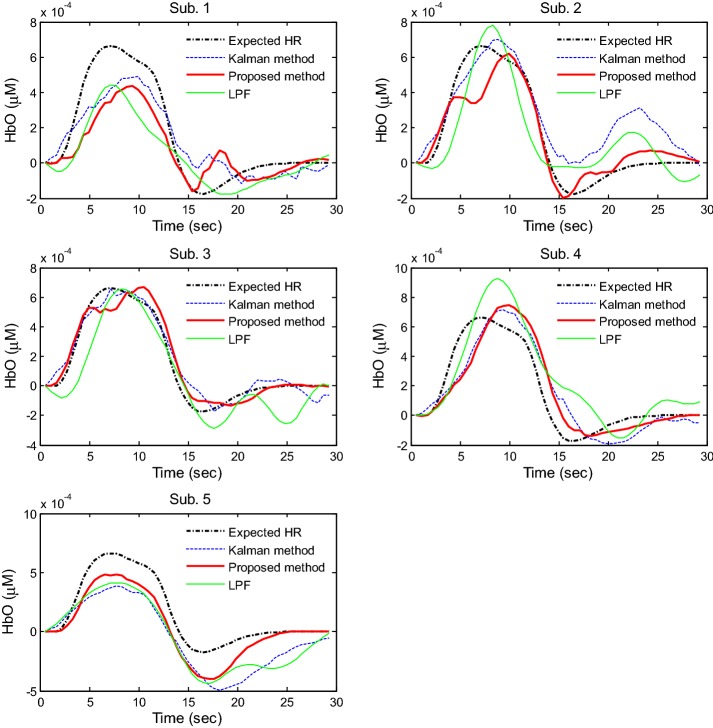
To further evaluate the proposed method, the HbOs obtained by three different methods (Kalman filter, LPF, and the proposed method) for five subjects were compared. Figure 14 plots the averaged HbOs over all active channels by using the Kalman filter (blue dashed curves), LPF (green solid curves), and the proposed method (red thick curves). The results suggest that the proposed method is comparable with both the expected HbO (black dotted-dashed curve) and the Kalman-filter-based HbO. A one-way test of variance was performed to evaluate the obtained HRs in Fig. 14. In the case of Kalman filter, the obtained HRs from Sub. 1 indicated significantly different means (p = 1.04 × 10⁻⁷). In the case of LPF, the means of the obtained HRs from Subs. 1 and 4 were significantly different (p = 3.1 × 10⁻⁶). However, the results from the proposed method for all five subjects were not significantly different (p = 0.03). This demonstrates that the proposed approach gives the extracted HR more consistently than LPF and Kalman filter methods.
Fig. 14.
Comparison of the HbOs: Kalman filter, LPF, and the proposed method
To further compare our proposed method with Kalman filter and LPF methods, t-values of the HbOs against the expected HbO were computed by using the robustfit function available in MATLAB [58, 59, 68]. As shown in Fig. 15, the t-values obtained by using the proposed method exceed those obtained with the Kalman filter and LPF approaches for four out of five subjects.
Fig. 15.
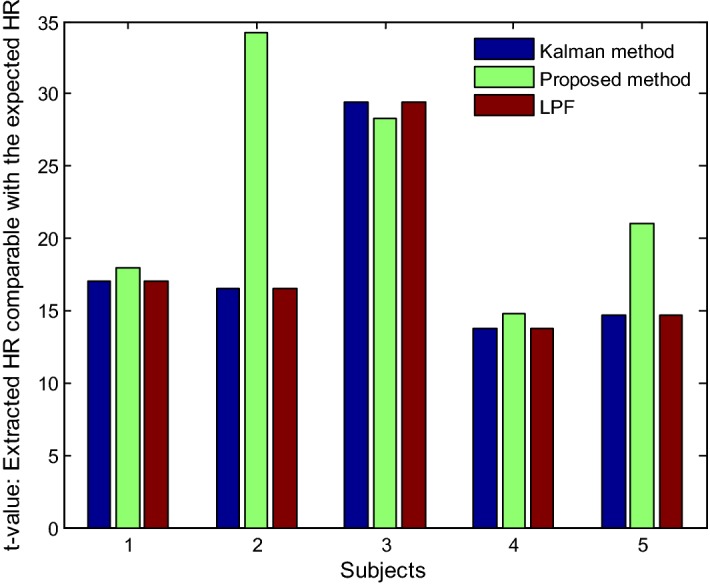
Comparison of t-values of the HbOs obtained by three methods (Kalman filter, proposed method, and LPF)
Figure 16 compares the CNRs of the raw HbOs and the HbOs obtained by the proposed method across five subjects. The noise-reduction percentages (in terms of the number of channels) of the estimated HbO and HbR in comparison with the raw HbO and HbR were computed by comparing them with the raw fNIRS CNR data. The results indicated that the proposed method demonstrated an average noise reduction of 77% for HbO (see Fig. 16) and 99% for HbR (see Fig. 17). This revealed that the proposed method effectively removed physiological and superficial noises. Additionally, the accuracy of the obtained HRs was significantly improved.
Fig. 16.
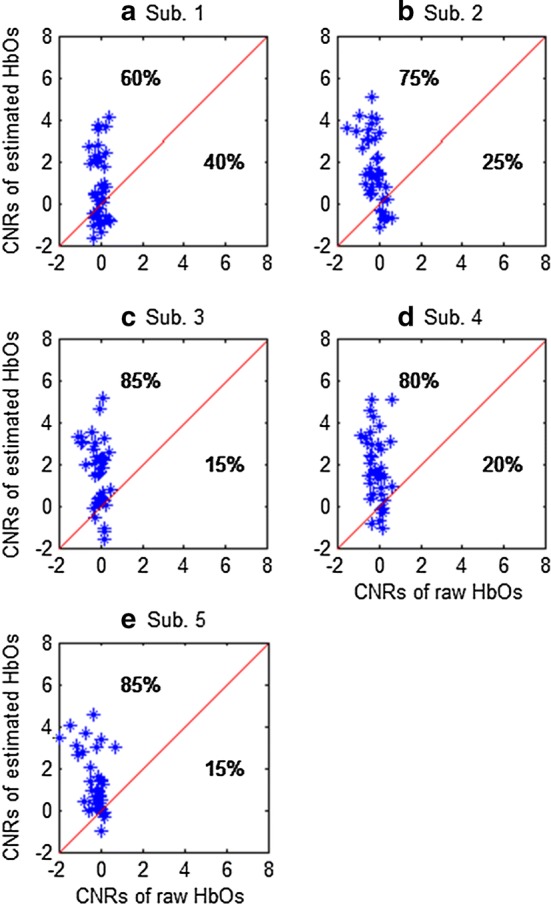
Comparison of CNRs between raw HbOs and the HbOs estimated by the proposed method (the average reduction from five subjects is 77%)
Fig. 17.
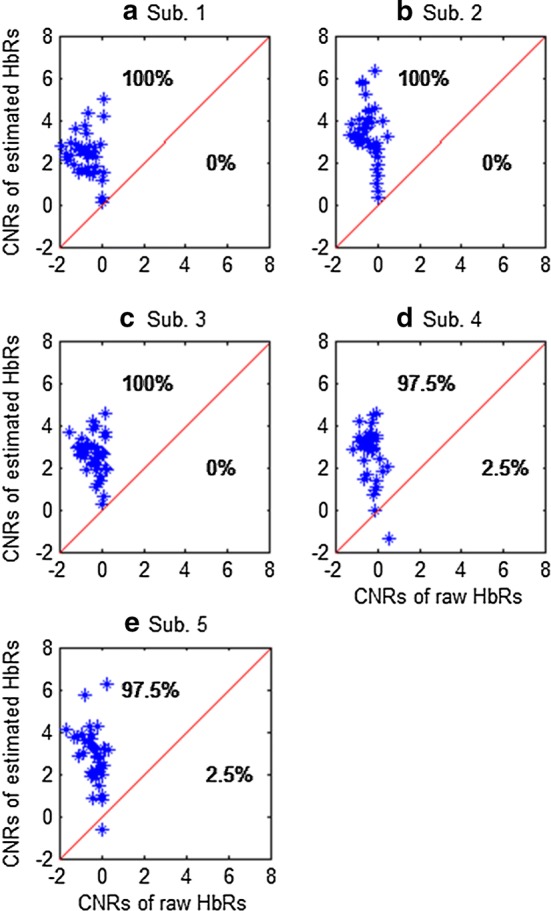
Comparison of CNRs of the raw and filtered HbRs by using the proposed method (average reduction of noise of five subjects: 99%)
To implement the proposed method for brain imaging, right-finger-movement tasks in the left motor cortex were performed by using a bundled-optode arrangement. In our experiment, the available sampling rate for the bundled arrangement (a total of 32 optodes) was limited to 1.81 Hz. Therefore, with respect to the acquired fNIRS data, the proposed method deduced the cardiac frequency as within approximately 0.8–0.9 Hz. the issues of measuring different brain regions and motion-artifact removal are limited in our current work. Several relevant reports proposed that motion artifacts are measured by means of an accelerometer [2, 22]. If motion artifacts are measured in this manner, then they are included in our model as a new additional component and estimated by the RLSE approach. Specifically, we expect that motion artifacts are effectively reduced in this manner. In addition, in the future works, measured fNIRS data of different brain regions will be checked using our proposed method.
Actually, the proposed method reduces noises online. Therefore, it is appropriate for BCI applications [69–79] based on effective classifiers (e.g., linear discriminant analysis, principle component analysis, and support vector machine) [80–87] and studies on cognitive functions in daily life [88, 89]. The precisely extracted commands from measured data controls external devices if noises are perfectly removed, (i.e., robot arms, wheelchairs, and prosthetic arms) [90, 91].
Conclusions
In the study, we presented a novel adaptive-filtering-based approach to reduce physiological and superficial noises and decomposition of the HRs in fNIRS data. Our experimental results revealed that the proposed method improved the accuracy of the estimated HR and significantly reduced physiological noises. The averaged noise reductions for HbO and HbR were 77 and 99%, respectively. The results strongly suggest that the proposed model can be utilized for noise removal and HR extraction in both offline and online applications.
Authors’ contributions
HDN conducted all experiments; carried out the data processing; and prepared the draft manuscript. SHY and MRB verified the data and participated in the revision stage. KSH has conceived the idea, investigated the theoretical aspects of the work, supervised all the processes from the beginning, and finalized the manuscript. All authors read and approved the final manuscript.
Acknowledgements
The first author’s affiliation at the time of this work was Pusan National University, and would like to thank the colleagues at Pusan National University, particularly the Vietnamese students, who participated in fNIRS experiments.
Competing interests
The authors declare that they have no competing interests.
Availability of data and materials
The datasets used and/or analyzed in the current work are available from the corresponding author upon a reasonable request.
Consent for publication
Not applicable.
Ethics approval and consent to participate
All the experiments in the study were performed following the guidelines of the Institutional Review Board of Pusan National University, and informed consent were obtained from all the subjects based on the Declaration of Helsinki.
Funding
The study was supported by the National Research Foundation (NRF) of Korea under the auspices of the Ministry of Science and ICT, Republic of Korea (Grant Nos. NRF-2017R1A2A1A17069430 and NRF-2017R1A4A1015627).
Publisher’s Note
Springer Nature remains neutral with regard to jurisdictional claims in published maps and institutional affiliations.
Contributor Information
Hoang-Dung Nguyen, Email: hoangdung@ctu.edu.vn.
So-Hyeon Yoo, Email: bsh00156@pusan.ac.kr.
M. Raheel Bhutta, Email: raheel.bhutta@sejong.ac.kr.
Keum-Shik Hong, Email: kshong@pusan.ac.kr.
References
- 1.Villringer A, Chance B. Non-invasive optical spectroscopy and imaging of human brain function. Trends Neurosci. 1997;20(10):435–442. doi: 10.1016/S0166-2236(97)01132-6. [DOI] [PubMed] [Google Scholar]
- 2.Virtanen J, Noponen T, Meriläinen P. Comparison of principal and independent component analysis in removing extracerebral interference from near-infrared spectroscopy signals. J Biomed Opt. 2009;14(5):054032. doi: 10.1117/1.3253323. [DOI] [PubMed] [Google Scholar]
- 3.Parks NA. Concurrent application of TMS and near-infrared optical imaging: methodological considerations and potential artifacts. Front Hum Neurosci. 2013;7:592. doi: 10.3389/fnhum.2013.00592. [DOI] [PMC free article] [PubMed] [Google Scholar]
- 4.Delpy DT, Cope M, van der Zee P, Arridge S, Wray S, Wyatt J. Estimation of optical pathlength through tissue from direct time of flight measurement. Phys Med Biol. 1988;33:1433–1442. doi: 10.1088/0031-9155/33/12/008. [DOI] [PubMed] [Google Scholar]
- 5.Bhutta MR, Hong K-S, Kim B-M, Hong MJ, Kim Y-H, Lee S-H. Note: three wavelengths near-infrared spectroscopy system for compensating the light absorbance by water. Rev Sci Instrum. 2014;85(2):026111. doi: 10.1063/1.4865124. [DOI] [PubMed] [Google Scholar]
- 6.Tam ND, Zouridakis G. Temporal decoupling of oxy-and deoxy-hemoglobin hemodynamic responses detected figby functional near-infrared spectroscopy (fNIRS) J Biomed Eng Med Imaging. 2014;1(2):18–28. doi: 10.14738/jbemi.12.146. [DOI] [Google Scholar]
- 7.Coyle SM, Ward TE, Markham CM. Brain–computer interface using a simplified functional near-infrared spectroscopy system. J Neural Eng. 2007;4(3):219–226. doi: 10.1088/1741-2560/4/3/007. [DOI] [PubMed] [Google Scholar]
- 8.Hu X-S, Hong K-S, Ge SS. fNIRS-based online deception decoding. J Neural Eng. 2012;9:026012. doi: 10.1088/1741-2560/9/2/026012. [DOI] [PubMed] [Google Scholar]
- 9.Liu X, Hong K-S. Detection of primary RGB colors projected on a screen using fNIRS. J Innov Opt Health Sci. 2017;10(6):1750006. [Google Scholar]
- 10.Abdelnour AF, Huppert T. Real-time imaging of human brain function by near-infrared spectroscopy using an adaptive general linear model. Neuroimage. 2009;46(1):133–143. doi: 10.1016/j.neuroimage.2009.01.033. [DOI] [PMC free article] [PubMed] [Google Scholar]
- 11.Kamran MA, Hong K-S. Linear parameter-varying model and adaptive filtering technique for detecting neuronal activities: an fNIRS study. J Neural Eng. 2013;10(5):056002. doi: 10.1088/1741-2560/10/5/056002. [DOI] [PubMed] [Google Scholar]
- 12.Pires FO, dos Anjos CAS, Covolan RJM, Pinheiro FA, St Clair Gibson A, Noakes TD, et al. Cerebral regulation in different maximal aerobic exercise modes. Front Physiol. 2016;7:253. doi: 10.3389/fphys.2016.00253. [DOI] [PMC free article] [PubMed] [Google Scholar]
- 13.Pires FO, dos Anjos CAS, Covolan RJM, Fontes EB, Noakes TD, St Clair Gibson A, et al. Caffeine and placebo improved maximal exercise performance despite unchanged motor cortex activation and greater prefrontal cortex deoxygenation. Front Physiol. 2018;9:1144. doi: 10.3389/fphys.2018.01144. [DOI] [PMC free article] [PubMed] [Google Scholar]
- 14.Hong K-S, Naseer N. Reduction of delay in detecting initial dips from functional near-infrared spectroscopy signals using vector-based phase analysis. Int J Neural Syst. 2016;26(3):1650012. doi: 10.1142/S012906571650012X. [DOI] [PubMed] [Google Scholar]
- 15.Zafar A, Hong K-S. Detection and classification of three-class initial dips from prefrontal cortex. Biomed Opt Express. 2017;8(1):367–383. doi: 10.1364/BOE.8.000367. [DOI] [PMC free article] [PubMed] [Google Scholar]
- 16.Zafar A, Hong K-S. Neuronal activation detection using vector phase analysis with dual threshold circles: a Functional Near-Infrared Spectroscopy Study. Int J Neural Syst. 2018;24:1850031. doi: 10.1142/S0129065718500314. [DOI] [PubMed] [Google Scholar]
- 17.Naseer N, Hong K-S. Classification of functional near-infrared spectroscopy signals corresponding to the right- and left-wrist motor imagery for development of a brain–computer interface. Neurosci Lett. 2013;553:84–89. doi: 10.1016/j.neulet.2013.08.021. [DOI] [PubMed] [Google Scholar]
- 18.Khan MJ, Hong K-S. Passive BCI based on drowsiness detection: an fNIRS study. Biomed Opt Express. 2015;6(10):4063–4078. doi: 10.1364/BOE.6.004063. [DOI] [PMC free article] [PubMed] [Google Scholar]
- 19.Hong K-S, Naseer N, Kim Y-H. Classification of prefrontal and motor cortex signals for three-class fNIRS–BCI. Neurosci Lett. 2015;587:87–92. doi: 10.1016/j.neulet.2014.12.029. [DOI] [PubMed] [Google Scholar]
- 20.Naseer N, Hong MJ, Hong K-S. Online binary decision decoding using functional near-infrared spectroscopy for the development of brain–computer interface. Exp Brain Res. 2014;232(2):555–564. doi: 10.1007/s00221-013-3764-1. [DOI] [PubMed] [Google Scholar]
- 21.Piaggi P, Menicucci D, Gentili C, Handjaras G, Gemignani A, Landi A. Singular spectrum analysis and adaptive filtering enhance the functional connectivity analysis of resting state fMRI data. Int J Neural Syst. 2014;24(3):1450010. doi: 10.1142/S0129065714500105. [DOI] [PubMed] [Google Scholar]
- 22.Izzetoglu M, Devaraj A, Bunce S, Onaral B. Motion artifact cancellation in NIR spectroscopy using Wiener filtering. IEEE Trans Biomed Eng. 2005;52(5):934–938. doi: 10.1109/TBME.2005.845243. [DOI] [PubMed] [Google Scholar]
- 23.Cui X, Bray S, Reiss AL. Functional near infrared spectroscopy (NIRS) signal improvement based on negative correlation between oxygenated and deoxygenated hemoglobin dynamics. Neuroimage. 2010;49(4):3039–3046. doi: 10.1016/j.neuroimage.2009.11.050. [DOI] [PMC free article] [PubMed] [Google Scholar]
- 24.Brigadoi S, Ceccherini L, Cutini S, Scarpa F, Scatturin P, Selb J, et al. Motion artifacts in functional near-infrared spectroscopy: a comparison of motion correction techniques applied to real cognitive data. Neuroimage. 2014;85:181–191. doi: 10.1016/j.neuroimage.2013.04.082. [DOI] [PMC free article] [PubMed] [Google Scholar]
- 25.Hu X-S, Arredondo MM, Gomba M, Confer N, DaSilva AF, Johnson TD, et al. Comparison of motion correction techniques applied to functional near-infrared spectroscopy data from children. J Biomed Opt. 2015;20(12):126003. doi: 10.1117/1.JBO.20.12.126003. [DOI] [PMC free article] [PubMed] [Google Scholar]
- 26.Barker JW, Aarabi A, Huppert TJ. Autoregressive model based algorithm for correcting motion and serially correlated errors in fNIRS. Biomed Opt Express. 2013;4(8):1366–1379. doi: 10.1364/BOE.4.001366. [DOI] [PMC free article] [PubMed] [Google Scholar]
- 27.Cooper RJ, Selb J, Gagnon L, Phillip D, Schytz HW, Iversen HK, et al. A systematic comparison of motion artifact correction techniques for functional near-infrared spectroscopy. Front Neurosci. 2012;6:147. doi: 10.3389/fnins.2012.00147. [DOI] [PMC free article] [PubMed] [Google Scholar]
- 28.Gupta V, Singh D, Sharma AK. Principal component and independent component calculation of ECG signal in different posture. In: 2nd International conference on methods and models in science and technology (ICM2ST-11). AIP conference proceedings. 2011;1414(1):102–108.
- 29.Yücel MA, Selb J, Cooper RJ, Boas DA. Targeted principle component analysis: a new motion artifact correction approach for near-infrared spectroscopy. J Innov Opt Health Sci. 2014;7(2):1350066. doi: 10.1142/S1793545813500661. [DOI] [PMC free article] [PubMed] [Google Scholar]
- 30.Chiarelli AM, Maclin EL, Fabiani M, Gratton G. A kurtosis-based wavelet algorithm for motion artifact correction of fNIRS data. Neuroimage. 2015;112:128–137. doi: 10.1016/j.neuroimage.2015.02.057. [DOI] [PMC free article] [PubMed] [Google Scholar]
- 31.Zhang Q, Brown EN, Strangman GE. Adaptive filtering for global interference cancellation and real-time recovery of evoked brain activity: a Monte Carlo simulation study. J Biomed Opt. 2007;12(4):044014. doi: 10.1117/1.2754714. [DOI] [PubMed] [Google Scholar]
- 32.Zhang Q, Brown EN, Strangman GE. Adaptive filtering to reduce global interference in evoked brain activity detection: a human subject case study. J Biomed Opt. 2007;12(6):064009. doi: 10.1117/1.2804706. [DOI] [PubMed] [Google Scholar]
- 33.Zhang Y, Sun JW, Rolfe P. RLS adaptive filtering for physiological interference reduction in NIRS brain activity measurement: a Monte Carlo study. Physiol Meas. 2012;33(6):925–942. doi: 10.1088/0967-3334/33/6/925. [DOI] [PubMed] [Google Scholar]
- 34.Janani A, Sasikala M. Investigation of different approaches for noise reduction in functional near-infrared spectroscopy signals for brain–computer interface applications. Neural Comput Appl. 2017;28(10):2889–2903. doi: 10.1007/s00521-017-2961-4. [DOI] [Google Scholar]
- 35.Prince S, Kolehmainen V, Kaipio JP, Franceschini MA, Boas D, Arridge SR. Time-series estimation of biological factors in optical diffusion tomography. Phys Med Biol. 2003;48(11):1491–1504. doi: 10.1088/0031-9155/48/11/301. [DOI] [PubMed] [Google Scholar]
- 36.Scarpa F, Brigadoi S, Cutini S, Scatturin P, Zorzi M, Dell’acqua R, et al. A reference-channel based methodology to improve estimation of event-related hemodynamic response from fNIRS measurements. Neuroimage. 2013;72:106–119. doi: 10.1016/j.neuroimage.2013.01.021. [DOI] [PubMed] [Google Scholar]
- 37.Kamran MA, Hong K-S. Reduction of physiological effects in fNIRS waveforms for efficient brain-state decoding. Neurosci Lett. 2014;580:130–136. doi: 10.1016/j.neulet.2014.07.058. [DOI] [PubMed] [Google Scholar]
- 38.Aqil M, Hong K-S, Jeong MY, Ge SS. Detection of event-related hemodynamic response to neuroactivation by dynamic modeling of brain activity. Neuroimage. 2012;63(1):553–568. doi: 10.1016/j.neuroimage.2012.07.006. [DOI] [PubMed] [Google Scholar]
- 39.Saager RB, Berger AJ. Direct characterization and removal of interfering absorption trends in two-layer turbid media. J Opt Soc Am A Opt Image Sci Vis. 2005;22(9):1874–1882. doi: 10.1364/JOSAA.22.001874. [DOI] [PubMed] [Google Scholar]
- 40.Gagnon L, Perdue K, Greve DN, Goldenholz D, Kaskhedikar G, Boas DA. Improved recovery of the hemodynamic response in diffuse optical imaging using short optode separations and state-space modeling. Neuroimage. 2011;56(3):1362–1371. doi: 10.1016/j.neuroimage.2011.03.001. [DOI] [PMC free article] [PubMed] [Google Scholar]
- 41.Saager RB, Telleri NL, Berger AJ. Two-detector corrected near infrared spectroscopy (C-NIRS) detects hemodynamic activation responses more robustly than single-detector NIRS. Neuroimage. 2011;55(4):1679–1685. doi: 10.1016/j.neuroimage.2011.01.043. [DOI] [PubMed] [Google Scholar]
- 42.Gagnon L, Cooper RJ, Yücel MA, Perdue KL, Greve DN, Boas DA. Short separation channel location impacts the performance of short channel regression in NIRS. Neuroimage. 2012;59(3):2518–2528. doi: 10.1016/j.neuroimage.2011.08.095. [DOI] [PMC free article] [PubMed] [Google Scholar]
- 43.Gagnon L, Yücel MA, Boas DA, Cooper RJ. Further improvement in reducing superficial contamination in NIRS using double short separation measurements. Neuroimage. 2014;85:127–135. doi: 10.1016/j.neuroimage.2013.01.073. [DOI] [PMC free article] [PubMed] [Google Scholar]
- 44.Sato T, Nambu I, Takeda K, Aihara T, Yamashita O, Isogaya Y, et al. Reduction of global interference of scalp-hemodynamics in functional near-infrared spectroscopy using short distance probes. Neuroimage. 2016;141:120–132. doi: 10.1016/j.neuroimage.2016.06.054. [DOI] [PubMed] [Google Scholar]
- 45.Santosa H, Hong MJ, Kim S-P, Hong K-S. Noise reduction in functional near-infrared spectroscopy signals by independent component analysis. Rev Sci Instrum. 2013;84(7):073106. doi: 10.1063/1.4812785. [DOI] [PubMed] [Google Scholar]
- 46.Hong K-S, Nguyen H-D. State-space models of impulse hemodynamic responses over motor, somatosensory, and visual cortices. Biomed Opt Express. 2014;5:1778–1798. doi: 10.1364/BOE.5.001778. [DOI] [PMC free article] [PubMed] [Google Scholar]
- 47.Julien C. The enigma of Mayer waves: facts and models. Cardiovasc Res. 2006;70(1):12–21. doi: 10.1016/j.cardiores.2005.11.008. [DOI] [PubMed] [Google Scholar]
- 48.Tong Y, Lindsey KP, Frederick BD. Partitioning of physiological noise signals in the brain with concurrent near-infrared spectroscopy and fMRI. J Cereb Blood Flow Metab. 2011;31(12):2352–2362. doi: 10.1038/jcbfm.2011.100. [DOI] [PMC free article] [PubMed] [Google Scholar]
- 49.Liu Q, Ding F, Alsaedi A, Hayat T. Recursive identification methods for multivariate output-error moving average systems using the auxiliary model. Int J Control Autom Syst. 2018;16(3):1070–1079. doi: 10.1007/s12555-017-0101-7. [DOI] [Google Scholar]
- 50.Lee S-D, Jung S. Practical implementation of a factorized all pass filtering technique for non-minimum phase models. Int J Control Autom Syst. 2018;16(3):1474–1481. doi: 10.1007/s12555-017-0687-9. [DOI] [Google Scholar]
- 51.Chen J, Jiang B, Li J. Missing output identification model based recursive least squares algorithm for a distributed parameter system. Int J Control Autom Syst. 2018;16(1):150–157. doi: 10.1007/s12555-016-0606-5. [DOI] [Google Scholar]
- 52.Oh K-S, Seo J-H. Inertial parameter estimation of an excavator with adaptive updating rule using performance analysis of Kalman filter. Int J Control Autom Syst. 2018;16(3):1226–1238. doi: 10.1007/s12555-017-0087-1. [DOI] [Google Scholar]
- 53.Lee S-D, Jung S. An adaptive control technique for motion synchronization by on-line estimation of a recursive least square method. Int J Control Autom Syst. 2018;16(3):1103–1111. doi: 10.1007/s12555-017-0187-y. [DOI] [Google Scholar]
- 54.Choi J, Kong K. Optimal sensor fusion and position control of a low-price self-driving vehicle in short-term operation conditions. Int J Control Autom Syst. 2017;15(6):2859–2870. doi: 10.1007/s12555-016-0294-1. [DOI] [Google Scholar]
- 55.Kumar A, Ojha A, Padhy PK. Anticipated trajectory based proportional navigation guidance scheme for intercepting high maneuvering targets. Int J Control Autom Syst. 2017;15(3):1351–1361. doi: 10.1007/s12555-015-0166-0. [DOI] [Google Scholar]
- 56.Thabet H, Ayadi M, Rotella F. Experimental comparison of new adaptive PI controllers based on the ultra-local model parameter identification. Int J Control Autom Syst. 2016;14(6):1520–1527. doi: 10.1007/s12555-014-0550-1. [DOI] [Google Scholar]
- 57.Soderstrom T, Stoica P. System identification. NJ: Prentice Hall Inc; 1989. pp. 320–373. [Google Scholar]
- 58.Nguyen H-D, Hong K-S. Bundled-optode implementation for 3D imaging in functional near-infrared spectroscopy. Biomed Opt Express. 2016;7(9):3491–3507. doi: 10.1364/BOE.7.003491. [DOI] [PMC free article] [PubMed] [Google Scholar]
- 59.Nguyen H-D, Hong K-S, Shin Y-I. Bundled-optode method in functional near-infrared spectroscopy. PLoS ONE. 2016;11(10):e0165146. doi: 10.1371/journal.pone.0165146. [DOI] [PMC free article] [PubMed] [Google Scholar]
- 60.Laughner JI, Ng FS, Sulkin MS, Arthur RM, Efimov IR. Processing and analysis of cardiac optical mapping data obtained with potentiometric dyes. Am J Physiol Heart Circ Physiol. 2012;303(7):H753–H765. doi: 10.1152/ajpheart.00404.2012. [DOI] [PMC free article] [PubMed] [Google Scholar]
- 61.Pierro ML, Hallacoglu B, Sassaroli A, Kainerstorfer JM, Fantini S. Validation of a novel hemodynamic model for coherent hemodynamics spectroscopy (CHS) and functional brain studies with fNIRS and fMRI. Neuroimage. 2014;85:222–233. doi: 10.1016/j.neuroimage.2013.03.037. [DOI] [PMC free article] [PubMed] [Google Scholar]
- 62.Aqil M, Hong K-S, Jeong MY, Ge SS. Cortical brain imaging by adaptive filtering of NIRS signals. Neurosci Lett. 2012;514(1):35–41. doi: 10.1016/j.neulet.2012.02.048. [DOI] [PubMed] [Google Scholar]
- 63.Thawonmas R, Cichocki A, Amari S. A cascade neural network for blind signal extraction without spurious equilibria. IEICE Trans Fund Electron Comm Comput Sci. 1998;E81A:1833–1846. [Google Scholar]
- 64.Zhang H, Zhang Y-J, Lu C-M, Ma S-Y, Zang Y-F, Zhu C-Z. Functional connectivity as revealed by independent component analysis of resting-state fNIRS measurements. Neuroimage. 2010;51(3):1150–1161. doi: 10.1016/j.neuroimage.2010.02.080. [DOI] [PubMed] [Google Scholar]
- 65.Hu X-S, Hong K-S, Ge SS. Reduction of trial-to-trial variability in functional near-infrared spectroscopy signals by accounting for resting-state functional connectivity. J Biomed Opt. 2013;18(1):017003. doi: 10.1117/1.JBO.18.1.017003. [DOI] [PubMed] [Google Scholar]
- 66.Kalman RE. A new approach to linear filtering and prediction problems. J Basic Eng. 1960;82:35–45. doi: 10.1115/1.3662552. [DOI] [Google Scholar]
- 67.Hu X-S, Hong K-S, Ge SS, Jeong M-Y. Kalman estimator- and general linear model-based on-line brain activation mapping by near-infrared spectroscopy. Biomed Eng Online. 2010;9:82. doi: 10.1186/1475-925X-9-82. [DOI] [PMC free article] [PubMed] [Google Scholar]
- 68.Santosa H, Hong MJ, Hong K-S. Lateralization of music processing with noises in the auditory cortex: an fNIRS study. Front Behav Neurosci. 2014;8:418. doi: 10.3389/fnbeh.2014.00418. [DOI] [PMC free article] [PubMed] [Google Scholar]
- 69.Tidoni E, Gergondet P, Kheddar A, Aglioti SM. Audio-visual feedback improves the BCI performance in the navigational control of a humanoid robot. Front Neurorobot. 2014;8:20. doi: 10.3389/fnbot.2014.00020. [DOI] [PMC free article] [PubMed] [Google Scholar]
- 70.Hong K-S, Santosa H. Decoding four different sound-categories in the auditory cortex using functional near-infrared spectroscopy. Hear Res. 2016;333:157–166. doi: 10.1016/j.heares.2016.01.009. [DOI] [PubMed] [Google Scholar]
- 71.Metzger FG, Ehlis A-C, Haeussinger FB, Schneeweiss P, Hudak J, Fallgatter AJ, et al. Functional brain imaging of walking while talking: an fNIRS study. Neuroscience. 2017;343:85–93. doi: 10.1016/j.neuroscience.2016.11.032. [DOI] [PubMed] [Google Scholar]
- 72.Khan MJ, Hong MJ, Hong K-S. Decoding of four movement directions using hybrid NIRS-EEG brain–computer interface. Front Hum Neurosci. 2014;8:244. doi: 10.3389/fnhum.2014.00244. [DOI] [PMC free article] [PubMed] [Google Scholar]
- 73.Naseer N, Hong K-S. fNIRS-based brain–computer interfaces: a review. Front Hum Neurosci. 2015;9:3. doi: 10.3389/fnhum.2015.00003. [DOI] [PMC free article] [PubMed] [Google Scholar]
- 74.Naseer N, Hong K-S. Decoding answers to four-choice questions using functional near infrared spectroscopy. J Near Infrared Spectrosc. 2015;23(1):23–31. doi: 10.1255/jnirs.1145. [DOI] [Google Scholar]
- 75.Bhutta MR, Hong MJ, Kim Y-H, Hong K-S. Single-trial lie detection using a combined fNIRS-polygraph system. Front Psychol. 2015;6:709. doi: 10.3389/fpsyg.2015.00709. [DOI] [PMC free article] [PubMed] [Google Scholar]
- 76.Naseer N, Noori FM, Qureshi NK, Hong K-S. Determining optimal feature-combination for LDA classification of functional near-infrared spectroscopy signals in brain–computer interface application. Front Human Neurosci. 2016;10:237. doi: 10.3389/fnhum.2016.00237. [DOI] [PMC free article] [PubMed] [Google Scholar]
- 77.Khan MJ, Hong K-S. Hybrid EEG-fNIRS-based eight-command decoding for BCI: application to quadcopter control. Front Neurorobot. 2017;11:6. doi: 10.3389/fnbot.2017.00006. [DOI] [PMC free article] [PubMed] [Google Scholar]
- 78.Hong K-S, Bhutta MR, Liu X, Shin Y-I. Classification of somatosensory cortex activities using fNIRS. Behav Brain Res. 2017;333:225–234. doi: 10.1016/j.bbr.2017.06.034. [DOI] [PubMed] [Google Scholar]
- 79.Hong K-S, Khan MJ. Hybrid brain–computer interface techniques for improved classification accuracy and increased number of commands: a review. Front Neurorobot. 2017;11:35. doi: 10.3389/fnbot.2017.00035. [DOI] [PMC free article] [PubMed] [Google Scholar]
- 80.Gupta V, Singh G, Mittal M, Pahuja SK. Fourier transform of untransformable signals using pattern recognition technique. In Proceedings of the second international conference on advances in computing, control, and telecommunication technologies (ACT’10). IEEE Computer Society. Jakarta, Indonesia. Dec. 2–3, 2010; p. 6–9.
- 81.Gupta V, Singh R, Singh G, Singh R, Singh H. An introduction to principal component analysis and its importance in biomedical signal processing. In: 2011 international conference on life science and technology IPCBEE. IACSIT Press, Singapore. 2011; p. 3.
- 82.Gupta V, Mittal M, Ojha PC, Kumar P. Principal component analysis & factor analysis as an enhanced tool of pattern recognition. Int J Elec Electr Eng Telecoms. 2015;1(2):73–78. [Google Scholar]
- 83.Gupta V, Mittal M. Respiratory Signal Analysis using PCA, FFT and ARTFA. In: 2016 international conference on electrical power and energy systems (ICEPES) Maulana Azad National Institute of Technology, Bhopal, India. Dec 14–16, 2016; p. 221–225.
- 84.Gupta V, Mittal M. KNN and PCA classifier with autoregressive modelling during different ECG signal interpretation. Procedia Comput Sci. 2018;125:18–24. doi: 10.1016/j.procs.2017.12.005. [DOI] [Google Scholar]
- 85.Turnip A, Hong K-S, Jeong M-Y. Real-time feature extraction of P300 component using adaptive nonlinear principal component analysis. Biomed Eng Online. 2011;10:83. doi: 10.1186/1475-925X-10-83. [DOI] [PMC free article] [PubMed] [Google Scholar]
- 86.Turnip A, Hong K-S. Classifying mental activities from EEG-P300 signals using adaptive neural network. Int J Innov Comput Inf Control. 2012;8(9):6429–6443. [Google Scholar]
- 87.Azizi A, Nourisola H, Sadeghi-Emamgholi A, Naderisafa F. Adaptive PSO-LS-wavelet H ∞ control for two-wheeled self-balancing scooter. Int J Control Autom Syst. 2017;15(5):2126–2137. doi: 10.1007/s12555-016-0001-2. [DOI] [Google Scholar]
- 88.Khan AM, Yun D-W, Ali MA, Zuhaib KM, Yuan C, Iqbal J, et al. Passivity based adaptive control for upper extremity assist exoskeleton. Int J Control Autom Syst. 2016;14(1):291–300. doi: 10.1007/s12555-014-0250-x. [DOI] [Google Scholar]
- 89.Liu Q, Wang B, Liu Y, Zeping LV, Li W, Li Z, Fan Y. Frequency-specific effective connectivity in subjects with cerebral infarction as revealed by NIRS method. Neuroscience. 2018;373:169–181. doi: 10.1016/j.neuroscience.2018.01.007. [DOI] [PubMed] [Google Scholar]
- 90.Dura-Bernal S, Zhou XL, Neymotin SA, Przekwas A, Francis JT, Lytton WW. Cortical spiking network interfaced with virtual musculoskeletal arm and robotic arm. Front Neurorobot. 2015;9:13. doi: 10.3389/fnbot.2015.00013. [DOI] [PMC free article] [PubMed] [Google Scholar]
- 91.Kocaturk M, Gulcur HO, Canbeyli R. Toward building hybrid biological/in silico neural networks for motor neuroprosthetic control. Front Neurorobot. 2015;9:8. doi: 10.3389/fnbot.2015.00008. [DOI] [PMC free article] [PubMed] [Google Scholar]
Associated Data
This section collects any data citations, data availability statements, or supplementary materials included in this article.
Data Availability Statement
The datasets used and/or analyzed in the current work are available from the corresponding author upon a reasonable request.


