

Abstract
Cholinergic basal forebrain neurons of the nucleus basalis of Meynert (nbM) regulate attentional and memory function and are exquisitely prone to tau pathology and neurofibrillary tangle (NFT) formation during the progression of Alzheimer’s disease (AD). nbM neurons require the neurotrophin nerve growth factor (NGF), its cognate receptor TrkA, and the pan-neurotrophin receptor p75NTR for their maintenance and survival. Additionally, nbM neuronal activity and cholinergic tone are regulated by the expression of nicotinic (nAChR) and muscarinic (mAChR) acetylcholine receptors as well as receptors modulating glutamatergic and catecholaminergic afferent signaling. To date, the molecular and cellular relationships between the evolution of tau pathology and nbM neuronal survival remain unknown. To address this knowledge gap, we profiled cholinotrophic pathway genes within nbM neurons immunostained for pS422, a pretangle phosphorylation event preceding tau C-terminal truncation at D421, or dual-labeled for pS422 and TauC3, a later stage tau neo-epitope revealed by this same C-terminal truncation event, via single-population custom microarray analysis. nbM neurons were obtained from postmortem tissues from subjects who died with an antemortem clinical diagnosis of no cognitive impairment (NCI), mild cognitive impairment (MCI), or mild/moderate AD. Quantitative analysis revealed significant downregulation of mRNAs encoding TrkA as well as TrkB, TrkC, and the Trk-mediated downstream pro-survival kinase Akt in pS422+ compared to unlabeled, pS422-negative nbM neurons. In addition, pS422+ neurons displayed a downregulation of transcripts encoding NMDA receptor subunit 2B, metabotropic glutamate receptor 2, D2 dopamine receptor, and β1 adrenoceptor. By contrast, transcripts encoding p75NTR were downregulated in dual-labeled pS422+/TauC3+ neurons. Appearance of the TauC3 epitope was also associated with an upregulation of the α7 nAChR subunit and differential downregulation of the β2 nAChR subunit. Notably, we found that gene expression patterns for each cell phenotype did not differ with clinical diagnosis. However, linear regression revealed that global cognition and Braak stage were predictors of select transcript changes within both unlabeled and pS422+/TauC3™ neurons. Taken together, these cell phenotype-specific gene expression profiling data suggest that dysregulation of neurotrophic and neurotransmitter signaling is an early pathogenic mechanism associated with NFT formation in vulnerable nbM neurons and cognitive decline in AD, which may be amenable to therapeutic intervention early in the disease process.
Keywords: Cholinergic basal forebrain, Mild cognitive impairment, Nucleus basalis of Meynert, Trk receptor, Neurotrophin, Acetylcholine receptor, Glutamate receptor, Dopamine receptor, Adrenoceptor, Neurotransmission
1. Introduction
Cholinergic projection neurons originating within the region of the substantia innominata termed the nucleus basalis of Meynert (nbM) provide the major source of acetylcholine to the cortical mantle (Mesulam et al., 1983). Cholinergic nbM neurons regulate memory and attention (Baxter and Chiba, 1999) and undergo progressive degeneration in Alzheimer’s disease (AD) that correlates with disease progression and degree of cognitive impairment (Bierer et al., 1995). Recent work from our group suggests that the cascade of pathophysiological events leading to cholinergic nbM neuronal degeneration in AD is associated with the appearance of discrete epitopes within the microtubule-associated protein tau (Tiernan et al., 2016b), which are progressively revealed as this protein undergoes a pathological sequence of post-translational modifications precipitating the formation of neurofibrillary tangles (NFTs) in AD (Braak et al., 1994; García-Sierra et al., 2003; Ghoshal et al., 2002; Ghoshal et al., 2001; Guillozet-Bongaarts et al., 2005).
Cholinergic tone of nbM neurons is regulated by the expression of receptors for acetylcholine (AChRs) and other neurotransmitters, as well as receptors for nerve growth factor (NGF) and related neurotrophins. Cholinergic neurotransmission is mediated pre- and post-synaptically by nicotinic acetylcholine receptors (nAChRs) through ligand-gated cation influx (Gotti et al., 1997), and muscarinic acetylcholine receptors (mAChRs) through G-protein-coupled receptor-mediated pathways (Levey, 1996). nbM neurons receive cholinergic afferents (Smiley and Mesulam, 1999) and express both nAChRs (Breese et al., 1997) and mAChRs (Mufson et al., 1998). In addition, immunohistochemical evidence exists for the regulation of cholinergic signaling through several afferent systems, including glutamatergic, dopaminergic, and noradrenergic projections as well as local GA-BAergic interneurons (Smiley and Mesulam, 1999).
The viability of cholinergic nbM neurons is dependent upon the binding, internalization, and retrograde transport of NGF, which is mediated by the cognate NGF receptor tyrosine kinase TrkA and the pan-neurotrophin receptor p75NTR (Counts and Mufson, 2005; Kaplan and Miller, 2000; Mufson et al., 2003; Sofroniew et al., 2001). Other neurotrophin receptor tyrosine kinase family members including TrkB, which preferentially binds brain-derived neurotrophic factor (BDNF), and TrkC, which binds neurotrophin-3 (NT-3), are also localized to nbM neurons, albeit at lower levels of expression than TrkA, suggesting that neurotrophic signaling through these receptors also contribute to nbM functionality (Ginsberg et al., 2006; Mufson et al., 2002a; Salehi et al., 1996).
Perturbation in the expression of both AChRs and neurotrophin receptors are observed in nbM neurons during the clinical progression of AD. Specifically, we reported that gene expression of Chrna7 (encoding the α7 nAChR subunit) is upregulated in nbM neurons isolated postmortem from mild/moderate AD subjects compared to subjects who died with mild cognitive impairment (MCI) or no cognitive impairment (NCI) (Counts et al., 2007). Additionally, transcripts encoding the cognate NGF, BDNF, and NT-3 receptors TrkA, TrkB, and TrkC, respectively, are downregulated in cholinergic neurons in MCI and AD subjects as compared to NCI subjects and correlate with cognitive decline and neuropathology (Ginsberg et al., 2006), consistent with reports of loss of TrkA immunoreactivity in the nbM during prodromal and frank disease (Mufson et al., 2000). In contrast, we observed that Ngfr transcripts (encoding p75NTR) remain steady throughout clinical disease progression (Ginsberg et al., 2006); however, a phenotypic silencing of p75NTR immunoreactivity is observed in nbM neurons of MCI and AD subjects (Mufson et al., 2002b). While the expression patterns of these AChR and neurotrophin receptor mRNAs appears to follow clinical disease progression, recent work from our group suggests that specific stages of tau pathology and not clinical disease status drive differential gene regulation in nbM neurons (Tiernan et al., 2016b).
In the present study, we evaluated the extent to which levels of transcripts encoding neurotrophin receptors, AChRs, and additional neurotransmitter receptors change with the pathological evolution of NFTs in vulnerable nbM neurons. Expression profile mosaics were quantified in individual nbM neurons immunostained for the pS422 tau epitope, a “pretangle” phosphorylation event at the S422 residue that occurs early in the pathological evolution of NFTs, or TauC3, a later stage tau neoepitope revealed by caspase-mediated cleavage at D421 (Gamblin et al., 2003; Guillozet-Bongaarts et al., 2005, 2006; Vana et al., 2011). Phenotypically distinct neurons were microdissected from tissue sections obtained postmortem from subjects who died with an antemortem clinical diagnosis of NCI, MCI, or AD, followed by gene expression analysis using custom-designed microarrays. Our data demonstrate that dysregulation of select genes regulating the expression of nAChR subunits and neurotrophin receptors, as well as select downstream signaling molecules, are differentially associated with appearance of the pS422 and TauC3 epitopes, lending further support to the hypothesis that early pathological events underlying nbM cholinotrophic abnormalities and neuronal vulnerability are related to the progression of tau pathology. Furthermore, select transcripts regulating glutamatergic, GABAergic, dopaminergic, serotoninergic, and noradrenergic signaling were also altered along with tau pathological stage, suggesting a shift in afferent firing patterns within the nbM that would in turn affect cholinergic tone in nbM projection zones.
2. Materials and methods
2.1. Subjects
Demographic, clinical, and neuropathological characteristics of the subjects are summarized in Table 1. Custom-designed microarray analysis of single nbM neurons was performed using tissue obtained postmortem from 28 participates in the Rush Religious Orders Study (RROS) (Bennett et al., 2002; Counts et al., 2014; Ginsberg et al., 1997; Mufson et al., 1999) who were clinically diagnosed within a year of death with NCI (n = 10), MCI (n = 10), or mild/moderate AD (n = 8). Details of clinical evaluations and diagnostic criteria in the RROS cohort have been extensively published (Bennett et al., 2002; Counts et al., 2006; Ginsberg et al., 2006; Mufson et al., 1999; Perez et al., 2015a). Briefly, a team of investigators performed an annual clinical examination, including neuropsychological performance testing using the Mini-Mental State Exam (MMSE) and 17 additional neuropsychological tests referable to episodic memory, semantic memory, working memory, perceptual speed, and visuospatial ability. A Global Cognitive Score (GCS), consisting of a composite z-score calculated from this test battery, was determined for each participant (Bennett et al., 2002; Counts et al., 2006; Ginsberg et al., 2006; Mufson et al., 1999; Perez et al., 2015a). A board-certified neurologist with expertise in the evaluation of the elderly made the clinical diagnosis based on impairments in each of the five cognitive domains and a clinical examination. The diagnosis of dementia or AD met recommendations by the joint working group of the National Institute of Neurologic and Communicative Disorders and Stroke/AD and Related Disorders Association (NINCDS/ADRDA) (Chen et al., 1984). The MCI population was defined as subjects who exhibited cognitive impairment on neuropsychological testing but did not meet the clinical criteria for AD or dementia, which is consistent with the diagnostic criteria used by others in the field (Petersen et al., 2001).
Table 1.
Clinical, demographic, and neuropathological characteristics by diagnosis category.
| Clinical diagnosis |
p-Value | Pair-wise comparison | ||||
|---|---|---|---|---|---|---|
| NCI (N = 10) | aMCI (N = 10) | AD (N = 8) | ||||
| Age (years) at death | Mean ± SD (Range) | 84.6 ± 4.3 (78–92) | 85.4 ± 3.9 (79–91) | 84.7 ± 5.0 (76–88) | 0.6a | - |
| Number (%) of males | 5 (50%) | 5 (50%) | 3 (38%) | 0.5b | - | |
| Years of education | Mean ± SD (Range) | 18.7 ± 1.6 (16–21) | 17.5 ± 4.3 (15–25) | 19.1 ± 3.5 (16–24) | 0.2a | - |
| Number (%) with ApoE ε4 allele | 1 (10%) | 3 (33%) | 4 (50%) | 0.007b | NCI < AD | |
| MMSE | Mean ± SD (Range) | 27.8 ± 1.6 (26–30) | 27.4 ± 2.7 (22–30) | 22.1 ± 5.3 (15–26) | < 0.001a | (NCI, MCI) > AD |
| Global Cognitive Score | Mean ± SD (Range) | 0.04 ± 0.3 (− 0.4–0.4) | −0.06 ± 0.3 (−1.2 to −0.2) | −1.3 ± 0.4 (−2.0 to −0.9) | < 0.0001a | NCI > MCI > AD |
| Post-mortem interval (h) | Mean ± SD (Range) | 5.9 ± 2.5 (3.3–9.0) | 6.0 ± 2.6 (2.0–10.0) | 5.5 ± 4.0 (2.5–12.0) | 0.5a | - |
| Distribution of Braak scores | 0 | 0 | 0 | 0 | 0.004a | NCI < (MCI, AD) |
| I/II | 4 | 2 | 1 | |||
| III/IV | 6 | 5 | 2 | |||
| V/VI | 0 | 3 | 5 | |||
| NIA Reagan diagnosis (likelihood of AD) | No AD | 0 | 0 | 0 | 0.002a | NCI < (MCI, AD) |
| Low | 6 | 3 | 1 | |||
| Intermediate | 3 | 5 | 2 | |||
| High | 1 | 2 | 5 | |||
| CERAD diagnosis | No AD | 3 | 3 | 0 | 0.01a | (NCI, MCI) < AD |
| Possible | 4 | 3 | 1 | |||
| Probable | 3 | 3 | 3 | |||
| Definite | 0 | 1 | 4 | |||
Kruskal-Wallis test, with Bonferroni correction for multiple comparisons.
Fisher’s exact test, with Bonferroni correction for multiple comparisons.
Tissue samples were obtained and processed as previously published (Counts et al., 2006; Mufson et al., 1999; Tiernan et al., 2016b). At autopsy, the cerebrum was slabbed into 1 cm sections and one hemisphere was immersion-fixed in 4% paraformaldehyde in 0.1 M phosphate buffer, pH 7.2 for 24–72 h at 4 °C followed by cryoprotection; the opposite hemisphere was snap frozen. Paraffin-embedded fixed tissue sections from select regions (e.g., hippocampus and neocortex) were examined for amyloid and neuritic plaque pathology, NFTs, Lewy bodies, and TDP-43 inclusions (Bennett et al., 2002; Mufson et al., 2016). A board-certified neuropathologist blinded to the clinical diagnosis performed the neuropathological evaluation and classified individual cases based on the NIA–Reagan, Consortium to Establish a Registry for Alzheimer’s Disease (CERAD), and Braak staging criteria (Braak and Braak, 1991; Hyman et al., 2012; Mirra et al., 1991; Mufson et al., 2016).
2.2. Double-label immunohistochemistry for microarray analysis
Fixed tissue blocks containing the substantia innominata were sectioned at 40 μm on a freezing-sliding microtome in 1:18 series and cryoprotected. Immunohistochemistry to identify pS422- and TauC3-immunopositive neurons in the anteromedial nbM subfields has been detailed previously (Tiernan et al., 2016b). Briefly, the presence of intact RNA was confirmed in each case by acridine orange histofluorescence (Ginsberg et al., 1997). The peroxidase-quenching, blocking, avidin-biotin complex labeling, and all rinsing steps were performed as previously described (Tiernan et al., 2016b). The primary antibodies used were TauC3 (1:5000), a mouse monoclonal IgG1 raised against D421-cleaved tau (Gamblin et al., 2003), and pS422 (1:15,000; Invitrogen, 44-764G), a polyclonal rabbit IgG antibody directed against the phospho-tau epitope pS422. In addition, adjacent nbM sections in each case were immunostained with p75NTR to demonstrate the presence of cholinergic magnocellular neurons, as previously described (Mufson et al., 1989; Tiernan et al., 2016b). Primary antibodies were incubated with tissue overnight at 4 °C, followed by a 2 h incubation with biotinylated goat anti-mouse IgG [heavy plus light (H + L) chains] secondary antibody (1:500; BA-9200) for TauC3, or biotinylated goat anti-rabbit IgG (H + L) (1:500; BA-1000) for pS422 (both from Vector Labs). Labeling was developed with Vector SG peroxidase substrate (SK-4700) to yield a dark blue reaction product in TauC3-immunopositive (TauC3+) neurons, and 0.05% 3,3′-diaminobenzidine (DAB; Sigma, D5637) containing 0.03% hydrogen peroxide to yield a reddish-brown reaction product in pS422-immunolabeled (pS422+) profiles. Tissue sections were slide mounted, and processed for Nissl counterstaining using Cresyl violet (Kanaan et al., 2010) to identify immunonegative nbM neurons and to aid in cytoarchitectonic analysis, and stored at 4 °C without cover-slipping prior to microdissection.
2.3. Double-labeled immunofluorescence for confocal microscopy
Confocal microscopy was performed to confirm the presence of three discreetly labeled neuronal populations as previously described (Tiernan et al., 2016b). Tissue was blocked, incubated with primary antibodies overnight (pS422, 1:2500; TauC3, 1:10,000), labeled with secondary antibodies (pS422 with Alexa Fluor 488 goat anti-rabbit; TauC3 with Alexa Fluor 594 goat anti-mouse; Invitrogen, A-11008 and A-11005), and washed with DAPI (1:10,000; Invitrogen, D1306) to counterstain cell nuclei. Following the staining procedure, sections were mounted on microscope slides, autofluorescence was blocked using Sudan black as described (Kanaan et al., 2007; Tiernan et al., 2016b), and coverslipped using hardset Vectashield mounting media.
2.4. Single cell microaspiration, TC RNA amplification, and array hybridization
nbM neurons displaying one of four phenotypes were microdissected: 1) Nissl-positive but immunonegative (unlabeled), 2) single labeled pS422+, 3) dual-labeled pS422/TauC3-immunopositive (pS422+/TauC3+), and 4) single labeled TauC3+ nbM neurons were accessed using either a micromanipulator and micro-controlled vacuum source (Eppendorf, Westbury, NY) attached to a Nikon TE2000 inverted microscope (Fryer, Huntley, IL) (Bennett et al., 2002; Counts et al., 2014; Ginsberg et al., 2010b; Mufson et al., 2002a) or an Arcturus XT laser capture microdissection (LCM) instrument (ThermoFisher, South San Francisco, CA). Approximately 50–60 neurons per phenotype were individually analyzed by the custom-designed microarrays (Ginsberg, 2005; Ginsberg et al., 2006, 2010a).
RNA amplification from nbM neurons was performed using terminal continuation (TC) RNA amplification methodology (Alldred et al., 2009; Che and Ginsberg, 2004; Ginsberg, 2005), as previously described (Counts et al., 2014; Tiernan et al., 2016b). Briefly, microaspirated nbM neurons were homogenized in 500 μl Trizol reagent (ThermoFisher, Waltham, MA). RNAs were reverse transcribed in the presence of the poly d(T) primer (100 ng/μl) and TC primer (100 ng/μl) in 1× first strand buffer (ThermoFisher), 2 μg of linear acrylamide (ThermoFisher, Foster City, CA), 10 mM dNTPs, 100 μM DTT, 20 U of SuperRNase Inhibitor (Life Technologies), and 200 U of reverse transcriptase (Superscript III, ThermoFisher). Single-stranded cDNAs were digested with RNase H and re-annealed with the primers in a thermal cycler: RNase H digestion step at 37 °C, 30 min; denaturation step 95 °C, 3 min; primer re-annealing step 60 °C, 5 min. This step generated cDNAs with double-stranded regions at the primer interface. Samples were then purified by column filtration (Montage PCR filters; EMD Millipore, Billerica, MA). Hybridization probes were synthesized by in vitro transcription using 33P-UTP incorporation in 40 mM Tris (pH 7.5), 6 mM MgCl2, 10 mM NaCl, 2 mM spermidine, 10 mM DTT, 2.5 mM ATP, GTP and CTP, 100 μM of cold UTP, 20 U of SuperRNase Inhibitor, 2 KU of T7 RNA polymerase (Epicentre Illumina, Madison, WI), and 120 μCi of 33P-UTP (Perkin-Elmer, Boston, MA) (Alldred et al., 2009; Counts et al., 2014; Ginsberg et al., 2010a; Petersen et al., 2001). The reaction was performed at 37 °C for 4 h. Radiolabeled TC RNA probes were hybridized to custom-designed microarrays without further purification. Arrays were hybridized overnight at 42 °C in a rotisserie oven and washed sequentially in 2× SSC/0.1% SDS, 1× SSC/0.1% SDS, and 0.5× SSC/0.1% SDS for 20 min each at 42°C. Arrays were placed in a phosphor screen for 24 h and developed on a Storm phosphor imager (GE Healthcare, Piscataway, NJ).
2.5. Custom-designed microarray platforms and data collection
Array platforms consisted of 1 μg linearized cDNA purified from plasmid preparations adhered to high-density nitrocellulose (Hybond WL, GE Healthcare). Approximately 576 cDNAs of interest to neurobiology and neurodegeneration were utilized on the array platform (Ginsberg et al., 2017; Tiernan et al., 2016b). Hybridization signal intensity was determined using Image Quant software (GE Healthcare) and quantified by subtracting background using an empty vector (pBluescript). Expression of TC amplified RNA bound to each linearized cDNA minus background was expressed as a ratio of the total hybridization signal intensity of the array (i.e., global normalization) (Counts et al., 2014, 2006; Ginsberg, 2005; Mufson et al., 1999; Perez et al., 2015b). The data analysis generated expression profiles of relative changes in mRNA levels among the phenotypically distinct nbM neurons dissected from each case within the clinical diagnostic groups. Each neuron was analyzed in triplicate via three independent probe amplifications and array hybridizations using the original neuronal cDNA pool as template.
2.6. Data analysis and statistics
Demographic variables (Table 1) were compared among clinical diagnostic groups by Kruskal-Wallis or Fisher’s Exact tests with Bonferroni correction for pairwise comparisons. Relative changes in total hybridization signal intensity of individual mRNAs were analyzed by one-way ANOVA with post-hoc Newman-Keuls analysis for multiple comparisons. The level of statistical significance was set at p < 0.05. A false discovery rate controlling procedure was used to reduce type I errors due to the large number of genes analyzed simultaneously (Alldred et al., 2015; Che and Ginsberg, 2004; Counts et al., 2007; Hyman et al., 2012; Mirra et al., 1991; Reiner et al., 2003). Expression levels of select mRNAs were clustered and displayed using a bioinformatics and graphics software package (GeneLinker Gold, Improved Outcomes, Kingston, ON). The relationship between select transcript level changes and independent demographic and clinical pathologic variables within unlabeled, pS422+, and pS422+/TauC3+ nbM neurons was assessed by linear regression.
3. Results
3.1. Subject demographics
Clinical and neuropathological characteristics of the 28 cases (10 NCI, 10 MCI, and 8 mild/moderate AD) included in the microarray analysis are summarized in Table 1. No significant differences were observed for age, gender balance, years of education, or postmortem interval. The ApoE4 allele was more frequent in AD compared to NCI, but the MCI cohort was not significantly different from either NCI or AD. The AD group performed significantly poorer on the MMSE compared to the NCI and MCI groups (p < 0.0001), whereas GCS z-scores declined progressively throughout the transition from NCI to MCI to AD (p < 0.0001). Distribution of Braak scores was significantly different across the clinical groups. The NCI cases displayed significantly lower Braak scores than MCI or AD (p = 0.004). NCI cases were classified as Braak stages I/II (40%) or III/IV (60%). No NCI cases were Braak stage V-VI. The MCI cohort met the criteria for Braak stages I/II (20%), III/IV (50%), and V/VI (30%), and AD subjects were classified as Braak stages I/II (12.5%), III/IV (25%), and V/VI (62.5%). NIA-Reagan diagnosis significantly differentiated NCI cases from MCI and AD subjects (p = 0.002), and CERAD scores were significantly higher in AD compared to NCI and MCI (p = 0.01).
3.2. nbM neuronal tau phenotypes
nbM tau pathology was marked by double-label immunohistochemical staining for the pretangle phospho-epitope pS422 and the mature NFT neoepitope TauC3 (Vana et al., 2011). pS422+ staining exhibited a reddish-brown reaction product that filled the neuronal cytoplasm and labeled many neurites (Fig. 1A, B). TauC3+ staining produced a dark blue reaction product that discretely filled the cytoplasm of neurons that were often shrunken or misshapen (Fig. 1A, B). Confocal analysis confirmed the presence of three discrete populations of nbM neurons expressing early, intermediate, or late stage NFT pathology (Fig. 1C–F). For gene expression analysis, individual unlabeled, pS422+, pS422+/TauC3+, or TauC3+ nbM neurons were microdissected.
Fig. 1.

Phenotypic characterization of NFT evolution with pS422 and TauC3 immunoreactivity in nbM neurons. (A–G) Tissue sections from the nbM of a representative AD case. (A) Cholinergic neurons in the nbM can be identified phenotypically by expression of the pan-neurotrophin (p75NTR) receptor. A tissue section from a consecutive series was immunostained with p75NTR (brown) and pS422 (blue) to confirm the location of the cholinergic nbM. (B) Low magnification view of the nbM subfield immunostained with pS422 (brown) and TauC3 (blue). (C) High magnification of pS422 and TauC3 pathology in boxed area from (B). A Nissl counterstain was used to identify nbM neurons lacking tau pathology (*). (D-G) Confocal microscopy was used to confirm the presence of three discrete populations of nbM neurons. (D) Low magnification view of nbM subfield. (E–G) High magnification of boxed area from (D) identify pS422 (E), TauC3 (F), and overlay (G). Single arrowhead indicates a pS422+ nbM neuron, double arrowheads indicate a TauC3+ nbM neuron, and arrow indicates a pS422+/TauC3+ nbM neuron (colocalization appears yellow). Scale bar in A, 100 μm for A–B; scale bar in C, 50 μm for C; scale bar in D, 100 μm for D; scale bar in G, 50 μm for E–G.
3.3. nbM neurotrophin receptor-related gene expression
Expression profiling was performed on approximately 250 custom-designed microarrays following TC RNA amplification. Combining single neuron expression profiling with tau site-specific antibodies allowed for the characterization of the temporal molecular events associated with NFT formation within nbM neurons during the progression of AD. Quantitative analyses compared the signal intensities of transcripts either between clinical disease stages or between tau neuronal phenotypes. Comparison of transcript levels in pS422+ nbM neurons microaspirated from each clinical group revealed no statistical differences (Fig. 2). However, when analyzed independent of clinical diagnosis, expression levels of key transcripts regulating neurotrophin receptor expression and function were altered by the phenotypic transition from unlabeled to pS422+ to pS422+/TauC3+ to TauC3+ in nbM neurons (Fig. 3).
Fig. 2.

The expression of neurotrophin receptor and select downstream signaling molecule gene transcripts is equivalent in pS422+ nbM neurons during the progression of AD. Color-coded heatmap of the relative expression profiles for select transcripts in pS422+ nbM neurons aspirated from NCI, MCI, and AD cases (red to green = increasing mRNA levels). Quantitative analysis revealed no statistical differences in the expression levels of the transcripts examined in pS422+ nbM neurons derived from MCI or AD compared to NCI. This observation suggests that the pathological state of the neuron, not disease status, may drive changes in gene expression. Therefore, in the present analysis, we compared mRNA levels in individual pS422+, pS422+/TauC3+, and TauC3+ nbM neurons independent of clinical diagnosis. Abbreviations: Nrtk1, Nrtk2, and Nrtk3, neurotrophin tyrosine kinase receptor type 1 (TrkA), 2 (TrkB), 3 (TrkC); ECD, extracellular domain; TK, intracellular tyrosine kinase domain; Ngfr, nerve growth factor receptor (p75NTR); Mapk1, mitogen-activated protein kinase 1 (extracellular signal-regulated kinase 2); Mapk3, mitogen-activated protein kinase 3 (extracellular signal-regulated kinase 1); Creb1, cAMP response element binding protein; Akt1, Akt serine/threonine kinase 1 (protein kinase B); Prkca, Prkce, Prkci, protein kinase C alpha, epsilon, iota.
Fig. 3.
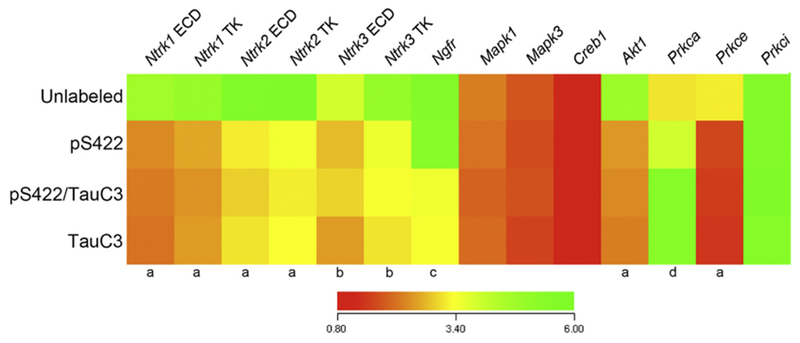
Neurotrophin receptor and select downstream signaling molecule mRNAs are dysregulated during the progression of NFT maturation. Heatmap of relative mRNA expression levels of neurotrophin receptors and downstream signaling molecules in pS422+, pS422+/TauC3+, and TauC3+ nbM neurons compared to unlabeled nbM neurons (red to green = increasing mRNA levels). Quantitative analysis revealed downregulated expression of Nrtk1-3 transcripts as well as Akt1 and Prkce in pS422+ nbM neurons as compared to unlabeled control neurons. Appearance of the late stage neoepitope TauC3 was associated with downregulation of the Ngfr transcript and upregulation of the Prkca transcript. a, unlabeled > pS422, p < 0.001; b, unlabeled > pS422, p < 0.01; c, pS422 > pS422+/TauC3+, p < 0.01; d, pS422 < pS422+/TauC3+, p < 0.01.
Compared to unlabeled neurons, nbM neurons bearing the pretangle phospho-epitope pS422 revealed a significant downregulation of six mRNAs encoding the intracellular tyrosine kinase (TK) and extracellular (ECD) domains of the neurotrophin receptors TrkA (Ntrk1 TK, 50%, p < 0.001; Ntrk1 ECD, 53%, p < 0.001), TrkB (Ntrk2 TK, 45%, p < 0.001; Ntrk2 ECD, 42%, p < 0.001), and TrkC (Ntrk3 TK, 38%, p < 0.01; Ntrk3 ECD, 35%, p < 0.01), as well as two mRNAs encoding signaling molecules downstream of neurotrophin receptor activity, the serine/threonine-specific protein kinases protein kinase B (Akt1, 50%, p < 0.01) and protein kinase C (PKC)-ε (Prkce, 50%, p < 0.01). Interestingly, expression levels of the mRNA encoding the pan-neurotrophin receptor p75NTR (Ngfr) did not decrease until appearance of the TauC3 epitope (40% decrease, p < 0.01). Cleavage at D421 was also associated with the upregulation of one downstream signaling molecule, PKC-α (Prkca, 36% increase, p < 0.01). Loss of the pS422 phenotype in mature NFTs (e.g., TauC3+ only) was not associated with any additional mRNA expression changes.
3.4. Tau pathology and nbM cholinergic neuronal marker-related gene expression
There were no significant differences in the relative expression levels of any genes regulating acetylcholine synthesis, release, or degradation in nbM neurons throughout the progression from prefibrillar to mature NFT tau pathology (Fig. 4), including choline acetyltransferase (Chat), vesicular acetylcholine transporter (Slc18a3), acetylcholinesterase (Ache), and butyrylcholinesterase (Bche). Similarly, expression of the muscarinic acetylcholine receptors M1 (Chrm1) and M2 (Chrm2) remained comparable across pathological states of tau. By contrast, mRNA expression of two nicotinic acetylcholine receptor subunits, α7 (Chrna7) and β2 (Chrnb2), were differentially regulated following appearance of the TauC3 epitope. Chrna7 was significantly upregulated (50% increase, p < 0.01), whereas Chrnb2 was significantly downregulated (40% decrease, p < 0.05).
Fig. 4.
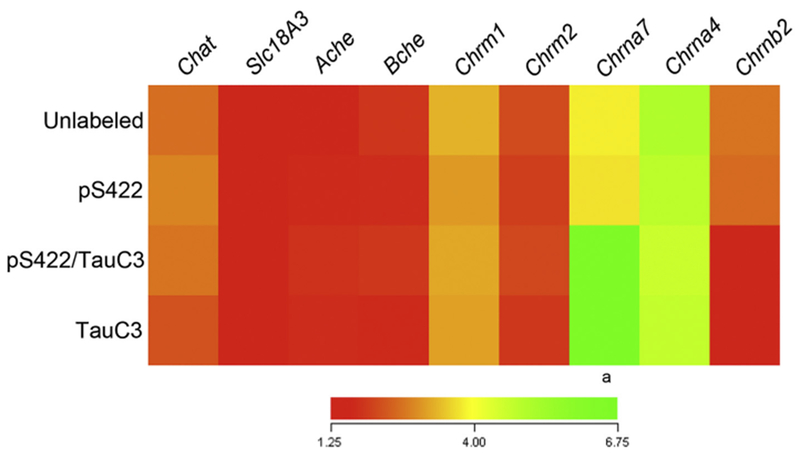
Select cholinergic markers are dysregulated during the development of NFTs in nbM neurons. Heatmap of relative expression levels of cholinergic neuronal markers in pS422+, pS422+/TauC3+, and TauC3+ NB neurons compared to unlabeled control neurons (red to green = increasing mRNA levels). Quantitative analysis revealed upregulation of the Chrna7 transcript and downregulation of the Chrnb2 transcript following the appearance of the TauC3 epitope. Abbreviations: Chat choline acetyltransferase; Slcl8a3, vesicular acetylcholine transporter; Ache, acetylcholinesterase; Bche, butyrylcholinesterase; Chrm1, Chrm2, cholinergic receptor, muscarinic 1, 2; Chrna7, Chrna4, Chrnb2, cholinergic receptor, nicotinic, alpha polypeptide 7, alpha polypeptide 4, beta polypeptide 2. a, pS422 < pS422+/TauC3+, p < 0.01; b, pS422 > pS422+/TauC3+, p < 0.05.
3.5. Tau pathology and neurotransmitter gene expression in nbM neurons
With respect to glutamate receptors, nbM neurons bearing the pS422 pretangle epitope revealed a significant downregulation of ionotropic NMDA receptor subunit 2B (Grin2B, 50% p = 0.001) and metabotropic glutamate receptor 2 (Grm2, 55%, p < 0.001) compared to unlabeled neurons (Fig. 5), whereas select transcripts encoding NMDA receptor subunit 1 (Grin1), AMPA receptor subunits 1 (Gria1) and 2 (Gria2), and kainate receptor subunits 1 (Grik1) and 4 (Grik4) were significantly downregulated with the appearance of the TauC3 epitope (Table 2). Catecholamine receptors were also dysregulated with pretangle pathology, as 50–60% decreases in D2 dopamine receptor (Drd2, p < 0.001) and β1 adrenoceptor (Adra1b, p < 0.001) transcript levels were observed in pS422+ neurons (Fig. 5). The appearance of the TauC3 epitope within nbM neurons coincided with a downregulation of additional dopaminergic (Drd1, 40%, p = 0.02; Drd4, 45%, p = 0.008) and noradrenergic (Adra2a, 45%, p = 0.003; Adra2b, 50%, p = 0.005) receptor gene expression.
Fig. 5.

Downregulation of select glutamatergic, dopaminergic, and noradrenergic receptors in pretangle-bearing nbM neurons. Boxplots show significant down-regulation in (A) the Grin2B NMDA receptor subunit, (B) Grm2 metabotropic glutamate receptor 2, (C) Drd2 D2 dopamine receptor, and (D) Adra1b β1 adrenoceptor in pS422+ neurons compared to unlabeled neurons. This downregulation persisted pS422+/TauC3+ neurons. Expression levels of these transcripts were similar between pS422+/TauC3+ andTauC3+ neurons. **p < 0.001, #, p < 0.05, pS422+ > pS422+/TauC3+.
Table 2.
Diagnostic group differences for select neurotransmitter receptor genes within nbM neurons with varying tau pathology.
| Transcript | p-Value | Groupwise comparison |
|---|---|---|
| Gria1 | 0.002 | pS422/TauC3 < unlabeled, pS422 |
| Gria2 | 0.001 | pS422/TauC3 < unlabeled, pS422 |
| Gria3 | n.s. | |
| Gria4 | n.s. | |
| Grik1 | 0.02 | pS422/TauC3 < unlabeled, pS422 |
| Grik2 | n.s. | |
| Grik3 | n.s. | |
| Grik4 | 0.04 | pS422/TauC3 < unlabeled, pS422 |
| Grik5 | n.s. | |
| Grin1 | 0.005 | pS422/TauC3 < unlabeled, pS422 |
| Grin2a | n.s. | |
| Grin2b | 0.001 | pS422, pS422/TauC3 < unlabeled |
| Grin2c | n.s. | |
| Grin2d | n.s. | |
| Grm1 | n.s. | |
| Grm2 | < 0.001 | pS422/TauC3 < pS422 < unlabeled |
| Grm3 | n.s. | |
| Grm4 | n.s. | |
| Grm5 | n.s. | |
| Grm6 | n.s. | |
| Grm7 | n.s. | |
| Grm8 | n.s. | |
| Gabra1 | n.s. | |
| Gabra2 | n.s. | |
| Gabra3 | n.s. | |
| Gabra4 | n.s. | |
| Gabra5 | n.s. | |
| Gabra6 | n.s. | |
| Gabrb1 | n.s. | |
| Gabrb2 | 0.04 | pS422/TauC3 < unlabeled, pS422 |
| Gabrb3 | n.s. | |
| Gabrd | n.s. | |
| Gabbr1 | 0.05 | pS422/TauC3 < unlabeled, pS422 |
| Drd1 | 0.02 | pS422/TauC3 < unlabeled, pS422 |
| Drd2 | < 0.001 | pS422, pS422/TauC3 < unlabeled |
| Drd3 | n.s. | |
| Drd4 | 0.008 | pS422/TauC3 < unlabeled, pS422 |
| Drd5 | n.s. | |
| Adra1b | < 0.001 | pS422, pS422/TauC3 < unlabeled |
| Adra2a | 0.003 | pS422/TauC3 < unlabeled, pS422 |
| Adra2b | 0.005 | pS422/TauC3 < unlabeled, pS422 |
| Htr1b | n.s. | |
| Htr2b | 0.03 | pS422/TauC3 < unlabeled, pS422 |
| Htr2c | n.s. | |
| Htr3 | n.s. | |
| Htr7 | n.s. | |
| Galr1 | n.s. | |
| Galr2 | n.s. | |
| Galr3 | n.s. |
n.s.: not significant.
See Abbreviations.
3.6. Microarray validation
qPCR and immunoblot validation analyses of frozen tissue samples were not conducted as previously described (Alldred et al., 2015; Ginsberg et al., 2010b, 2010a, 2006), since any changes associated with these phenotypes at the single neuron level would likely be masked by regional gene expression patterns from admixed neuronal and non-neuronal cell types (Ginsberg et al., 2012). On the other hand, the upregulation of neuronal Chrna7 during AD has been reported by both in situ hybridization and immunohistochemical approaches (Counts et al., 2007; Hellström-Lindahl et al., 1999; Teaktong et al., 2004). Future studies employing single population RNA-sequencing, Fluidigm, and/or Nanostring nCounter analyses are warranted when single population transcriptomic technologies become more standardized and economical (Buettner et al., 2015; Kim et al., 2015; Macosko et al., 2015) for human postmortem tissue use.
3.7. Relationships among expression level, demographics, and clinical pathologic variables for select transcripts
Although alterations in transcript levels were related to the progressive appearance of pretangle and NFT tau epitopes as compared to clinical diagnosis, we tested whether transcript levels within each nbM neuronal phenotype were associated with age, postmortem interval, GCS, MMSE scores, Braak stage, CERAD diagnosis, and/or Reagan diagnosis using multivariate linear regression. Neither age nor postmortem interval was a predictor for expression level changes of any of the transcripts analyzed (not shown). By contrast, both GCS and Braak stage predicted transcript levels for Nrtk1 TK, Nrtk2 TK, and Grin2b in unlabeled nbM neurons, whereas GCS alone predicted transcript level changes for Adrab1 (Table 3). In pS422+ nbM neurons, GCS, MMSE score, and Braak stage predicted Nrtk1 TK, Nrtk2 TK, and Grin2b transcript levels, whereas GCS was also a predictor for Nrtk3 TK, Grm2, Drd2, and Adrab1 (Table 3). Reagan diagnosis was also predicted to influence levels of Nrtk1 and Adrab1 transcripts in pS422+ neurons. None of the independent variables predicted expression levels for the transcripts in pS422+/TauC3+ nbM neurons. Notably, Ngfr, Chrna7 and Chrnb2 levels were not associated with clinical pathologic variables (not shown).
Table 3.
Linear regression analysis for association between clinical pathologic status and expression levels of select receptor genes within unlabeled and pS422+ nbM neurons.
| Gene ID | Cell phenotype | GCS | MMSE | Braak | CERAD | Reagan |
|---|---|---|---|---|---|---|
| Nrtk1 TK | Unlabeled | p = 0.01 | p = 0.09 | p = 0.04 | p = 0.2 | p = 0.1 |
| pS422+ | p = 0.007 | p = 0.05 | p = 0.02 | p = 0.1 | p = 0.04 | |
| Nrtk2 TK | Unlabeled | p = 0.01 | p = 0.1 | p = 0.03 | p = 0.1 | p = 0.1 |
| pS422+ | p = 0.008 | p = 0.06 | p = 0.01 | p = 0.3 | p = 0.08 | |
| Nrtk3 TK | Unlabeled | p = 0.2 | p = 0.6 | p = 0.3 | p = 0.3 | p = 0.6 |
| pS422+ | p = 0.01 | p = 0.2 | p = 0.08 | p = 0.5 | p = 0.4 | |
| Gria2 | Unlabeled | p = 0.4 | p = 0.5 | p = 0.3 | p = 0.8 | p = 0.5 |
| pS422+ | p = 0.06 | p = 0.1 | p = 0.05 | p = 0.3 | p = 0.1 | |
| Grin2b | Unlabeled | p = 0.03 | p = 0.1 | p = 0.05 | p = 0.09 | p = 0.1 |
| pS422+ | p = 0.006 | p = 0.05 | p = 0.01 | p = 0.2 | p = 0.06 | |
| Grm2 | Unlabeled | p = 0.2 | p = 0.4 | p = 0.08 | p = 0.7 | p = 0.5 |
| pS422+ | p = 0.05 | p = 0.1 | p = 0.1 | p = 0.5 | p = 0.2 | |
| Drd2 | Unlabeled | p = 0.07 | p = 0.1 | p = 0.1 | p = 0.6 | p = 0.5 |
| pS422+ | p = 0.01 | p = 0.07 | p = 0.09 | p = 0.2 | p = 0.2 | |
| Adrab1 | Unlabeled | p = 0.05 | p = 0.1 | p = 0.06 | p = 0.3 | p = 0.1 |
| pS422+ | p = 0.008 | p = 0.06 | p = 0.02 | p = 0.09 | p = 0.05 |
Boldface: significant association.
4. Discussion
The present study reveals that dysregulation of mRNAs encoding select neurotrophin and neurotransmitter receptors critical for nbM function and cortical cholinergic tone coincides with progressive intraneuronal post-translational modifications of tau that lead to NFT formation. In addition, alterations in several of these mRNAs (e.g., Nrtk1, Nrtk2, Grirt2B, Adrab1) were associated clinical pathologic variables - particularly GCS and Braak stage - in unlabeled and pS422+ nbM neurons, suggesting a correlation among neurotrophic and neurotransmitter abnormalities, worsening global cognition, and the global spread of neurofibrillary pathology as tau pretangles accumulate within cholinergic nbM projection neurons.
Cholinergic nbM neurons rely on NGF and its cognate (TrkA) and pan-neurotrophin (p75NTR) receptors for proper cellular function and survival (Counts and Mufson, 2005; Lad et al., 2003). Many previous reports have identified an early deficit in nbM neurotrophic support, namely a phenotypic downregulation of TrkA expression in MCI and early AD (Chu et al., 2001; Counts et al., 2004; Mufson et al., 2000). Here, we demonstrate that downregulation of transcripts encoding TrkA and its family members TrkB and TrkC, within individual nbM neurons coincides with the pre-tangle tau pathological marker pS422, suggesting that cholinergic nbM neuronal survival is compromised prior to the formation of mature NFTs. We cannot ascertain causality at this point, and whether pathological changes in tau drive diminished TrkA expression in nbM neurons is unclear. However, TrkA expression is under positive feedback from NGF (Holtzman et al., 1992; Li et al., 1995), and this pathway may be disrupted during the progression of dementia by reduced retrograde transport of cortical NGF to nbM consumer neurons (Mufson et al., 1995; Scott et al., 1995). While aggregated wild-type tau is a known inhibitor of anterograde fast axonal transport (Kanaan et al., 2012, 2011; LaPointe et al., 2009), there is some evidence to suggest that phosphorylation at S422 impairs retrograde transport, as well (Tiernan et al., 2016a). Thus, phosphorylation of tau at S422 and the resulting inhibition of retrograde transport may impair positive feedback from NGF leading to a loss of TrkA expression on the nbM neuronal cell surface. It is also possible that diminished TrkA expression does not result from pathological maturation of tau and/or impaired retrograde transport of NGF, but rather some other mechanism related to the binding and internalization of NGF at the terminal or activation of downstream signal transduction pathways (Klesse and Parada, 1999; Sofroniew et al., 2001). Future analysis of the potential interactions between aberrant tau phosphorylation and disrupted neurotrophic signaling in cholinergic nbM neurons is warranted in cohorts such as the RROS as well as in relevant animal and cellular models.
TrkA maintains nbM neuronal viability through a number of signal transduction pathways, including MAPK/CREB, PI3K, and PLCγ (Kaplan and Miller, 2000; Klesse and Parada, 1999; Lad et al., 2003; Sofroniew et al., 2001). The present findings suggest that appearance of the pS422 epitope in nbM neurons is associated with alterations in some but not all of these signal transduction pathways. Appearance of the pS422 epitope was not associated with expression level changes in Mapk1, Mapk3, or Creb1, suggesting that transcriptional regulation of the MAPK/CREB pathway in nbM neurons is unaffected by pathogenic modification of tau. Conversely, expression of genes encoding the serine/threonine kinase Akt (Akt1) and the calcium-modulated PKC-ε isozyme (Prkce) were downregulated in pS422-positive nbM neurons, whereas PKC-α (Prkca) was upregulated with the appearance of TauC3. Akt is the principal downstream mediator of PI3K (Burgering and Coffer, 1995; Datta et al., 1996; Franke et al., 1997; Klippel et al., 1996), promoting cell survival through a phosphorylation cascade that prevents the insertion of pro-apoptotic Bax proteins into the mitochondrial membrane (Dudek et al., 1997; Gross et al., 1998; Putcha et al., 1999). PKC-α and PKC-ε are components of the PLCγ pathway, which promotes survival following activation by PLCγ-mediated hydrolysis of PI 4,5-P2 to diacylglycerol (Bell and Burns, 1991; Nishizuka, 1988; Sofroniew et al., 2001). The dysregulation of these three kinases suggests that two of the principal signal transduction pathways mediating nbM neuronal survival, PI3K and PLCγ, may be compromised during the formation of mature NFTs.
Ngfr transcripts encoding p75NTR were not significantly reduced until appearance of the TauC3 epitope, suggesting that this receptor is functional during the early stages of tau pathology but is down-regulated in nbM neurons progressing into the later stages of NFT formation. p75NTR bifunctionally mediates a signal to induce or inhibit cell death, depending on a variety of factors including the co-expression of Trk receptor family members and the presence of pro- or mature forms of neurotrophins (Carter et al., 1996; Casaccia-Bonnefil et al., 1996; Hempstead et al., 1991; Mamidipudi and Wooten, 2002; Miller and Kaplan, 2001; Roux and Barker, 2002). When expressed together, p75NTR positively regulates signaling through TrkA by enhancing the specificity and binding of NGF (Barker and Shooter, 1994; Berg et al., 1991; Hempstead et al., 1991; Mahadeo et al., 1994), which in turn promote cell survival. In the absence of TrkA, p75NTR has been demonstrated to mediate both anti-apoptotic and pro-apoptotic effects. For example, in the presence of NGF, p75NTR can rescue peripheral cell cultures from apoptosis (Gentry et al., 2000; Roux et al., 2001). However, in central neurons and oligodendrocytes, NGF stimulation of p75NTR in the absence of TrkA more commonly triggers apoptosis (Casaccia-Bonnefil et al., 1996; Frade et al., 1996; Friedman, 2000; Yoon et al., 1998). A putative proapoptotic role for p75NTR has been demonstrated following the withdrawal of neurotrophic support (Martin et al., 1988). Mechanisms underlying NGF withdrawal-mediated apoptosis likely involves activation of the JNK pathway and consequent release of cytochrome c and caspase activation (Bruckner et al., 2001; Eilers et al., 2001; Harding et al., 2001; Martinou et al., 1999; Putcha et al., 1999), as well as activation of the cell cycle regulating molecules cyclin-dependent kinases 4/5 (Park et al., 1997, 2000, 1998). Interestingly, we have previously reported an increase in Casp3, Casp7, and Cdk5 in TauC3-immunopositive nbM neurons (Tiernan et al., 2016b), suggesting that p75NTR-dependent apoptosis may be actively occurring in cells expressing the mature NFT marker, TauC3. An additional mechanism of p75NTR-mediated cell death may involve accumulation of the NGF precursor protein proNGF. While cortical levels of mature NGF remain steady during the progression of AD (Mufson et al., 2003), proNGF levels increase by 40–60% in the cortex of subjects diagnoses with MCI or mild AD compared with NCI (Peng et al., 2004). TrkA protein levels were found to be reduced in the cortex in early stage AD compared to p75NTR levels (Counts et al., 2004), and both reduced TrkA levels and increased proNGF levels in the cortex were associated with poorer antemortem cognitive performance (Counts et al., 2004; Peng et al., 2004). Our present finding that TrkA expression is relatively downregulated in pS422+ nbM neurons compared to p75NTR, taken together with the accumulation of pS422+ nbM neurons in MCI and AD (Vana et al., 2011), suggests a pathologic link between pretangle pathology and a shift from pro-survival to pro-apoptotic signaling in nbM neurons (Counts and Mufson, 2005; Masoudi et al., 2009; Mufson et al., 2007). This process is likely exacerbated upon appearance of TauC3+ NFT pathology, when p75NTR expression is reduced.
Appearance of the TauC3 neoepitope was also associated with the differential regulation of two nAChR subunits, upregulation of α7 and downregulation of β2. α7 subunits are likely expressed as homodimeric assemblies, whereas β2 co-assembles with α4 as a heterodimer. Together, α7 homodimer and α4β2 heterodimer nAChRs constitute the two major nAChR subtypes expressed in the brain (Gotti et al., 1997). Upregulation of α7 nAChR mRNA has been demonstrated previously in subjects diagnosed with mild/moderate AD compared to NCI and MCI, however no change in the β2 nAChR subunit was reported (Counts et al., 2007). This discrepancy likely results from the more stringent phenotypic selection of nbM neurons based on tau pathology that was used in the present investigation. There is some evidence from PET imaging studies to suggest that the α4β2 nAChR subtype is down-regulated in MCI and AD (Kendziorra et al., 2010; Terrière et al., 2010), however ours is the first report to suggest interplay between expression of the α7 homodimer and α4β2 heterodimer during the progression of AD. Overall, the present results suggest that appearance of the TauC3 epitope may shift the cell surface stoichiometry of neuronal nAChRs from heterodimeric α4β2 to homodimeric α7 subtypes.
Pretangle pathology in nbM neurons was associated with decreased expression of select glutamatergic, dopaminergic, and noradrenergic receptors. Downregulation of Drd2 and Adra1b may be related to dysfunction and neurodegeneration of catecholaminergic systems, including the ventral tegmental area and locus coeruleus (Bondareff et al., 1987; Gibb et al., 1989; Mann et al., 1980), during the progression of AD, which would cause dysregulation of inputs to the cholinergic nbM (Jones and Cuello, 1989; Smiley and Mesulam, 1999; Smiley et al., 1999; Zaborszky and Cullinan, 1996). In particular, we and others have shown that locus coeruleus noradrenergic neuron loss occurs very early in the disease process (Arendt et al., 1985, 2015; Kelly et al., 2017; Theofilas et al., 2017) and likely contributes to disruptions in cholinergic modulation of attentional function. Glutamate-mediated excitotoxicity has been implicated in AD neuronal dysfunction and cognitive impairment, and dysregulation of the Grin2B-encoded NMDA receptor 2B subunit appears to be a primary pathogenic event in disease progression (Andreoli et al., 2013; Hu et al., 2012; Olney et al., 1997). GRIN2B plays a crucial role in learning and memory (Cao et al., 2007; Tang et al., 2001), and its expression is reduced in the entorhinal cortex and hippocampus of the AD brain (Bi and Sze, 2002; Sze et al., 2001). The present results extend these findings to the nbM, and suggest that perturbations in NMDA receptor activation and functionality may induce excitotoxic neuronal injury (Farber et al., 1998), which manifests as cognitive impairment. A role for excitotoxicity-mediated neuronal injury in nbM neurons is also suggested by the presently observed decrease in the Gria2-encoded AMPA 2 receptor subunit following appearance of the TauC3 epitope. The AMPA 2 subunit significantly influences calcium permeability of AMPA receptor gated ion channels, whereby its coexpression with other AMPA receptor subunits produces channels with little to no calcium permeability (Hollmann et al., 1991). Loss of Gria2 expression would result in increased intracellular calcium levels through unopposed activation of the calcium permeable subunits GRIA4/5, which were unaltered presently. Hence, these findings reinforce the potential contribution of calcium dysregulation to tangle formation in nbM neurons (Ahmadian et al., 2015; Riascos et al., 2014; Wu et al., 2005) and implicate glutamate-mediated excitotoxicity as a potential mediator of this pathogenic process.
5. Conclusions
These results derived from single-population analysis of nbM neurons with defined tau pathology status suggest that neurotrophic receptor expression and functionality in cholinergic nbM neurons is compromised prior to the onset of frank NFT pathology, and early impairments of neurotrophic and neurotransmitter signaling play a substantial role in nbM cholinergic tone and survival. We and others have previously reported some of these cholinotrophic changes in individual nbM neurons during the progression from NCI to MCI to AD (Chu et al., 2001; Counts et al., 2007, 2004; Mufson et al., 2002a, 2000, 1997; Salehi et al., 1996); however, here we demonstrate in a well-characterized clinical pathological cohort that these alterations are associated with specific stages of tau pathology, supporting the hypothesis that the accumulation of pathological tau epitopes in nbM neurons drives neurodegenerative processes that contribute to the clinical progression of AD (Mesulam et al., 2004; Tiernan et al., 2016b; Vana et al., 2011). Limitations of this study include the fact that this postmortem human tissue-based study is inherently correlative and cannot address causality, underscoring the need for more detailed mechanistic experimentation in relevant preclinical models to understand the sequence of events that link tau pathology to potential deleterious alterations in neuronal gene expression regulation. In summary, dysregulation of neurotrophic cell survival and afferent glutamatergic and catecholaminergic signaling is an early pathogenic mechanism associated with NFT formation in vulnerable cholinergic nbM neurons in AD, which provide new clues for translational approaches to therapeutic intervention.
Acknowledgements
We thank John Beck and Muhammad Nadeem for excellent technical assistance. We are indebted to the altruism of the RROS participants.
Funding
This work was supported by NIH grants AG014449 (CTT, SDG, NMK, EJM, SEC), AG053581 (SEC), AG053760 (SEC), NS082730 (NKM), AG044372 (NKM), AG043375 (EJM, SDG), AG107617 (SDG), AG19610 (EJM) as well as the Alzheimer’s Association grant IIRG-11-203928 (SDG), Thorek Memorial Foundation (SEC, NKM), Saint Mary’s Foundation (SEC), Miles for Memories of Battle Creek, MI (SEC), and the Barrow Neurological Institute Barrow and Beyond (EJM).
Abbreviations:
- Ache
acetylcholinesterase
- AD
Alzheimer’s disease
- Adra2a, Adra2b, Adra1b
adrenoceptor alpha 2a, alpha 2b, beta 1
- Akt1
Akt serine/threonine protein kinase 1/protein kinase B
- ApoE
apolipoprotein E
- Bche
butyrylcholinesterase
- BDNF
brain derived neurotrophic factor
- Casp3,7
caspases 3,7
- Cdk5
cyclin-dependent kinase 5
- CERAD
Consortium to Establish a Registry for Alzheimer’s Disease
- Chat
choline acetyltransferase
- Creb1
cAMP regulatory element binding protein
- Drd1–5
dopamine receptor D1–D5
- ECD
extracellular domain
- Gabbr1
gamma-aminobutyric acid (GABA) type B receptor subunit 1
- Gabra1–6
GABA type A receptor subunit alpha 1–6 subunit
- Gabrb1–3
GABA type A receptor subunit beta 1–3 subunit
- Gabrd
GABA type A receptor subunit delta
- Galr1–3
galanin receptor 1–3
- GCS
Global Cognitive Score
- Gria1–4
AMPA receptor subunit 1–4
- Grik1–5
kainite receptor subunit 1–5
- Grin1, Grin2a-d
NMDA receptor subunits 1, 2A–D
- Grm1–8
metabotropic glutamate receptor 1–8
- Htr1b
5-hydroxytryptamine (serotonin) receptor 1B
- Htr2b,c
serotonin receptor 2B, C
- Htr3,7
serotonin receptor 3, 7
- JNK
c-jun N-terminal kinase
- mAChR (Chrm1,2)
cholinergic receptor, muscarinic 1, 2
- MAPK, Mapk1, 3
mitogen-activated protein kinase 1 (Erk2), 3 (Erk1)
- MCI
mild cognitive impairment
- MMSE
Mini-Mental State Exam
- nAChR (Chrna7, Chrna4, Chrnb2)
cholinergic receptor, nicotinic, alpha polypeptide 7, alpha polypeptide 4, beta polypeptide 2
- nbM
nucleus basalis of Meynert
- NCI
no cognitive impairment
- NFT
neurofibrillary tangle
- NGF
nerve growth factor
- NT-3
neurotrophin-3
- PI3K
phosphatidylinositol 3 kinase
- Prkca, Prkce, Prkci
protein kinase C (PKC) alpha, epsilon, iota
- PLCγ, phospholipase C-γ; pS422
phosphorylation of tau at serine-422
- p75NTR (Ngfr)
nerve growth factor receptor
- RROS
Rush Religious Order Study
- Slc18a3
vesicular acetylcholine transporter
- TauC3
antibody directed against tau truncated at aspartic acid-421
- TC
terminal continuation
- TK
intracellular tyrosine kinase domain
- TrkA (Ntrk1), TrkB (Ntrk2), TrkC (Ntrk3)
neurotrophin tyrosine kinase receptor type 1, 2, 3
Footnotes
Declaration of conflicts of interest
None of the authors has any conflicts of interest related to this study or its reported findings.
References
- Ahmadian SS, Rezvanian A, Peterson M, Weintraub S, Bigio EH, Mesulam M-M, Geula C, 2015. Loss of calbindin-D28K is associated with the full range of tangle pathology within basal forebrain cholinergic neurons in Alzheimer’s disease. Neurobiol. Aging 36, 3163–3170. http://dx.doi.org/10.1016/j.neurobiolaging.2015.09.001. [DOI] [PMC free article] [PubMed] [Google Scholar]
- Alldred MJ, Che S, Ginsberg SD, 2009. Terminal continuation (TC) RNA amplification without second strand synthesis. 177, 381–385. http://dx.doi.org/10.1016/j.jneumeth.2008.10.027. [DOI] [PMC free article] [PubMed] [Google Scholar]
- Alldred MJ, Lee SH, Petkova E, Ginsberg SD, 2015. Expression profile analysis of vulnerable CA1 pyramidal neurons in young-middle-aged Ts65Dn mice. J. Comp. Neurol. 523, 61–74. http://dx.doi.org/10.1002/cne.23663. [DOI] [PMC free article] [PubMed] [Google Scholar]
- Andreoli V, De Marco EV, Trecroci F, Cittadella R, Di Palma G, Gambardella A, 2013. Potential involvement of GRIN2B encoding the NMDA receptor subunit NR2B in the spectrum of Alzheimer’s disease. J. Neural Transm. 7, 574 http://dx.doi.org/10.1074/jbc.M700050200. [DOI] [PubMed] [Google Scholar]
- Arendt T, Bigl V, Tennstedt A, Arendt A, 1985. Neuronal loss in different parts of the nucleus basalis is related to neuritic plaque formation in cortical target areas in Alzheimer’s disease. Neuroscience 14, 1–14. [DOI] [PubMed] [Google Scholar]
- Arendt T, Bruckner MK, Morawski M, Jager C, Gertz H-J, 2015. Early neurone loss in Alzheimer’s disease: cortical or subcortical? Acta Neuropathol. Commun. 3, 10 http://dx.doi.org/10.1186/s40478-015-0187-1. [DOI] [PMC free article] [PubMed] [Google Scholar]
- Barker PA, Shooter EM, 1994. Disruption of NGF binding to the low affinity neurotrophin receptor p75 LNTR reduces NGF binding to TrkA on PC12 cells. Neuron 13, 203–215. [DOI] [PubMed] [Google Scholar]
- Baxter MG, Chiba AA, 1999. Cognitive functions of the basal forebrain. Curr. Opin. Neurobiol. 9, 178–183. [DOI] [PubMed] [Google Scholar]
- Bell RM, Burns DJ, 1991. Lipid activation of protein-kinase-C. J. Biol. Chem. 266, 4661–4664. [PubMed] [Google Scholar]
- Bennett DA, Wilson RS, Schneider JA, Evans DA, Beckett LA, Aggarwal NT, Barnes LL, Fox JH, Bach J, 2002. Natural history of mild cognitive impairment in older persons. 59, 198–205. [DOI] [PubMed] [Google Scholar]
- Berg MM, Sternberg DW, Hempstead BL, Chao MV, 1991. The low-affinity p75 nerve growth factor (NGF) receptor mediates NGF-induced tyrosine phosphorylation. PNAS 88, 7106–7110. [DOI] [PMC free article] [PubMed] [Google Scholar]
- Bi H, Sze CI, 2002. N-methyl-d-aspartate receptor subunit NR2A and NR2B messenger RNA levels are altered in the hippocampus and entorhinal cortex in Alzheimer’s disease. J. Neurol. Sci. 200, 11–18. [DOI] [PubMed] [Google Scholar]
- Bierer LM, Haroutunian V, Gabriel S, Knott PJ, Carlin LS, Purohit DP, Perl DP, Schmeidler J, Kanof P, Davis KL, 1995. Neurochemical correlates of dementia severity in Alzheimer’s disease: relative importance of the cholinergic deficits. J. Neurochem. 64, 749–760. http://dx.doi.org/10.1046/j.1471-4159.1995.64020749.x. [DOI] [PubMed] [Google Scholar]
- Bondareff W, Mountjoy CQ, Roth M, Rossor MN, Iversen LL, Reynolds GP, Hauser DL, 1987. Neuronal degeneration in locus ceruleus and cortical correlates of Alzheimer disease. Alzheimer Dis. Assoc. Disord. 1, 256–262. [DOI] [PubMed] [Google Scholar]
- Braak H, Braak E, 1991. Neuropathological stageing of Alzheimer-related changes. Acta Neuropathol. 82 (4), 239–259. [DOI] [PubMed] [Google Scholar]
- Braak E, Braak H, Mandelkow EM, 1994. A sequence of cytoskeleton changes related to the formation of neurofibrillary tangles and neuropil threads. Acta Neuropathol. 87, 554–567. [DOI] [PubMed] [Google Scholar]
- Breese CR, Adams C, Logel J, Drebing C, Rollins Y, Barnhart M, Sullivan B, Demasters BK, Freedman R, Leonard S, 1997. Comparison of the regional expression of nicotinic acetylcholine receptor alpha 7 mRNA and [I-125]alpha-bungarotoxin binding in human postmortem brain. J. Comp. Neurol. 387, 385–398. [DOI] [PubMed] [Google Scholar]
- Bruckner SR, Tammariello SP, Kuan CY, Flavell RA, Rakic P, Estus S, 2001. JNK3 contributes to c-Jun activation and apoptosis but not oxidative stress in nerve growth factor-deprived sympathetic neurons. J. Neurochem. 78, 298–303. [DOI] [PubMed] [Google Scholar]
- Buettner F, Natarajan KN, Casale FP, Proserpio V, Scialdone A, Theis FJ, Teichmann SA, Marioni JC, Stegle O, 2015. Computational analysis of cell-tocell heterogeneity in single-cell RNA-sequencing data reveals hidden subpopulations of cells. Nat. Biotechnol. 33, 155–160. http://dx.doi.org/10.1093/bioinformatics/bts385. [DOI] [PubMed] [Google Scholar]
- Burgering B, Coffer PJ, 1995. Protein-kinase-B (C-Akt) in phosphatidylinositol-3-OH inase signal-transduction. Nature 376, 599–602. http://dx.doi.org/10.1038/376599a0. [DOI] [PubMed] [Google Scholar]
- Cao X, Cui Z, Feng R, Tang Y-P, Qin Z, Mei B, Tsien JZ, 2007. Maintenance of superior learning and memory function in NR2B transgenic mice during ageing. Eur. J. Neurosci. 25, 1815–1822. http://dx.doi.org/10.1113/jphysiol.1996.sp021779. [DOI] [PubMed] [Google Scholar]
- Carter BD, Kaltschmidt C, Kaltschmidt B, Offenhauser N, Bohm-Matthaei R, Baeuerle PA, Barde Y-A, 1996. Selective activation of NF-kappaB by nerve growth factor through the neurotrophin receptor p75. Science 272, 542. [DOI] [PubMed] [Google Scholar]
- Casaccia-Bonnefil P, Carter BD, Dobrowsky RT, Chao MV, 1996. Death of oligodendrocytes mediated by the interaction of nerve growth factor with its receptor p75. Nature 383, 716–719. http://dx.doi.org/10.1038/383716a0. [DOI] [PubMed] [Google Scholar]
- Che S, Ginsberg SD, 2004. Amplification of RNA transcripts using terminal continuation. 84, 131–137. http://dx.doi.org/10.1038/sj.labinvest.3700005. [DOI] [PubMed] [Google Scholar]
- Chen C, Li X, Wang T, Wang H-H, Fu Y, Zhang L, Xiao S-F, 1984. Association between NMDA receptor subunit 2b gene polymorphism and Alzheimer’s disease in Chienes Han population in Shanghai. Neurol. Sci 34, 939–944. http://dx.doi.org/10.1212/WNL.34.7.939. [DOI] [PMC free article] [PubMed] [Google Scholar]
- Chu YP, Cochran EJ, Bennett DA, Mufson EJ, Kordower JH, 2001. Down-regulation of trkA mRNA within nucleus basalis neurons in individuals with mild cognitive impairment and Alzheimer’s disease. J. Comp. Neurol. 437, 296–307. [DOI] [PubMed] [Google Scholar]
- Counts SE, Mufson EJ, 2005. The role of nerve growth factor receptors in cholinergic basal forebrain degeneration in prodromal Alzheimer disease. J. Neuropathol. Exp. Neurol. 64, 263–272. [DOI] [PubMed] [Google Scholar]
- Counts SE, Nadeem M, Wuu J, Ginsberg SD, Saragovi HU, Mufson EJ, 2004. Reduction of cortical TrkA but not p75NTR protein in early-stage Alzheimer’s disease. Ann. Neurol. 56, 520–531. http://dx.doi.org/10.1002/ana.20233. [DOI] [PubMed] [Google Scholar]
- Counts SE, Nadeem M, Lad SP, Wuu J, Mufson EJ, 2006. Differential expression of synaptic proteins in the frontal and temporal cortex of elderly subjects with mild cognitive impairment. J. Neuropathol. Exp. Neurol. 65, 592–601. [DOI] [PubMed] [Google Scholar]
- Counts SE, He B, Che S, Ikonomovic MD, DeKosky ST, Ginsberg SD, Mufson EJ, 2007. Alpha 7 nicotinic receptor up-regulation in cholinergic basal forebrain neurons in Alzheimer disease. Arch. Neurol. 64, 1771–1776. http://dx.doi.org/10.1001/archneur.64.12.1771. [DOI] [PubMed] [Google Scholar]
- Counts SE, Alldred MJ, Che S, Ginsberg SD, Mufson EJ, 2014. Synaptic dysregulation within hippocampal CA1 pyramidal neurons in mild cognitive impairment. Neuropharmacology 79, 172–179. http://dx.doi.org/10.1016/j.neuropharm.2013.10.018. [DOI] [PMC free article] [PubMed] [Google Scholar]
- Datta K, Bellacosa A, Chan TO, Tsichlis PN, 1996. Akt is a direct target of the phosphatidylinositol 3-kinase - activation by growth factors, v-src and v-Ha-ras, in Sf9 and mammalian cells. J. Biol. Chem. 271, 30835–30839. [DOI] [PubMed] [Google Scholar]
- Dudek H, Datta SR, Franke TF, Birnbaum MJ, Yao R, Cooper GM, Segal RA, Kaplan DR, Greenberg ME, 1997. Regulation of neuronal survival by the serinethreonine protein kinase Akt. Science 275, 661–665. [DOI] [PubMed] [Google Scholar]
- Eilers A, Whitfield J, Shah B, Spadoni C, Desmond H, Ham J, 2001. Direct inhibition of c-Jun N-terminal kinase in sympathetic neurones prevents c-jun promoter activation and NGF withdrawal-induced death. J. Neurochem. 76, 1439–1454. [DOI] [PubMed] [Google Scholar]
- Farber NB, Newcomer JW, Olney JW, 1998. The glutamate synapse in neuropsychiatric disorders: focus on schizophrenia and Alzheimer’s disease. Prog. Brain Res. 116, 421–437. [DOI] [PubMed] [Google Scholar]
- Frade JM, Rodriguez-Tebar A, Barde YA, 1996. Induction of cell death by endogenous nerve growth factor through its p75 receptor. Nature 383, 166–168. http://dx.doi.org/10.1038/383166a0. [DOI] [PubMed] [Google Scholar]
- Franke TF, Kaplan DR, Cantley LC, Toker A, 1997. Direct regulation of the Akt proto-oncogene product by phosphatidylinositol-3,4-bisphosphate. Science 275, 665–668. [DOI] [PubMed] [Google Scholar]
- Friedman WJ, 2000. Neurotrophins induce death of hippocampal neurons via the p75 receptor. J. Neurosci. 20, 6340–6346. [DOI] [PMC free article] [PubMed] [Google Scholar]
- Gamblin TC, Chen F, Zambrano A, Abraha A, Lagalwar S, Guillozet AL, Lu M, Fu Y, García-Sierra F, LaPointe N, Miller R, Berry RW, Binder LI, Cryns VL, 2003. Caspase cleavage of tau: linking amyloid and neurofibrillary tangles in Alzheimer’s disease. PNAS 100, 10032–10037. http://dx.doi.org/10.1073/pnas.1630428100. [DOI] [PMC free article] [PubMed] [Google Scholar]
- García-Sierra F, Ghoshal N, Quinn B, Berry RW, Binder LI, 2003. Conformational changes and truncation of tau protein during tangle evolution in Alzheimer’s disease. J. Alzheimers Dis. 5, 65–77. [DOI] [PubMed] [Google Scholar]
- Gentry JJ, Casaccia-Bonnefil P, Carter BD, 2000. Nerve growth factor activation of nuclear factor κB through its p75 receptor is an anti-apoptotic signal in RN22 schwannoma cells. J. Biol. Chem. 275, 7558–7565. [DOI] [PubMed] [Google Scholar]
- Ghoshal N, Garcia-Sierra F, Fu YF, Beckett LA, Mufson EJ, Kuret J, Berry RW, Binder LI, 2001. Tau-66: evidence for a novel tau conformation in Alzheimer’s disease. J. Neurochem. 77, 1372–1385. [DOI] [PubMed] [Google Scholar]
- Ghoshal N, García-Sierra F, Wuu J, Leurgans S, Bennett DA, Berry RW, Binder LI, 2002. Tau conformational changes correspond to impairments of episodic memory in mild cognitive impairment and Alzheimer’s disease. Exp. Neurol. 177, 475–493. http://dx.doi.org/10.1006/exnr.2002.8014. [DOI] [PubMed] [Google Scholar]
- Gibb WR, Mountjoy CQ, Mann DM, Lees AJ, 1989. The substantia nigra and ventral tegmental area in Alzheimer’s disease and Down’s syndrome. J. Neurol. Neurosurg. Psychiatry 52, 193–200. [DOI] [PMC free article] [PubMed] [Google Scholar]
- Ginsberg SD, 2005. RNA amplification strategies for small sample populations. Methods 37, 229–237. http://dx.doi.org/10.1016/j.ymeth.2005.09.003. [DOI] [PubMed] [Google Scholar]
- Ginsberg SD, Crino PB, Lee VM, Eberwine JH, Trojanowski JQ, 1997. Sequestration of RNA in Alzheimer’s disease neurofibrillary tangles and senile plaques. 41, 200–209. http://dx.doi.org/10.1002/ana.410410211. [DOI] [PubMed] [Google Scholar]
- Ginsberg SD, Che S, Wuu J, Counts SE, Mufson EJ, 2006. Down regulation of trk but not p75 NTRgene expression in single cholinergic basal forebrain neurons mark the progression of Alzheimer’s disease. J. Neurochem. 97, 475–487. http://dx.doi.org/10.1111/j.1471-4159.2006.03764.x. [DOI] [PubMed] [Google Scholar]
- Ginsberg SD, Alldred MJ, Counts SE, Cataldo AM, Neve RL, Jiang Y, Wuu J, Chao MV, Mufson EJ, Nixon RA, Che S, 2010a. Microarray analysis of hippocampal CA1 neurons implicates early endosomal dysfunction during Alzheimer’s disease progression. Biol. Psychiatry 68, 885–893. http://dx.doi.org/10.1016/j.biopsych.2010.05.030. [DOI] [PMC free article] [PubMed] [Google Scholar]
- Ginsberg SD, Mufson EJ, Counts SE, Wuu J, Alldred MJ, Nixon RA, Che S, 2010b. Regional selectivity of rab5 and rab7 protein upregulation in mild cognitive impairment and Alzheimer’s disease. J. Alzheimers Dis. 22, 631–639. http://dx.doi.org/10.3233/JAD-2010-101080. [DOI] [PMC free article] [PubMed] [Google Scholar]
- Ginsberg SD, Alldred MJ, Che S, 2012. Gene expression levels assessed by CA1 pyramidal neuron and regional hippocampal dissections in Alzheimer’s disease. Neurobiol. Dis. 45, 99–107. http://dx.doi.org/10.1016/j.nbd.2011.07.013. [DOI] [PMC free article] [PubMed] [Google Scholar]
- Ginsberg SD, Malek-Ahmadi MH, Alldred MJ, Che S, Elarova I, Chen Y, Jeanneteau F, Kranz TM, Chao MV, Counts SE, Mufson EJ, 2017. Selective decline of neurotrophin and neurotrophin receptor genes within CA1 pyramidal neurons and hippocampus proper: correlation with cognitive performance and neuropathology in mild cognitive impairment and Alzheimer’s disease. Hippocampus. http://dx.doi.org/10.1002/hipo.22802. [DOI] [PMC free article] [PubMed] [Google Scholar]
- Gotti C, Fornasari D, Clementi F, 1997. Human neuronal nicotinic receptors. Prog. Neurobiol. 53, 199–237. [DOI] [PubMed] [Google Scholar]
- Gross A, Jockel J, Wei MC, Korsmeyer SJ, 1998. Enforced dimerization of BAX results in its translocation, mitochondrial dysfunction and apoptosis. EMBO J. 17, 3878–3885. http://dx.doi.org/10.1093/emboj/17.14.3878. [DOI] [PMC free article] [PubMed] [Google Scholar]
- Guillozet-Bongaarts AL, García-Sierra F, Reynolds MR, Horowitz PM, Fu Y, Wang T, Cahill ME, Bigio EH, Berry RW, Binder LI, 2005. Tau truncation during neurofibrillary tangle evolution in Alzheimer’s disease. Neurobiol. Aging 26, 1015–1022. http://dx.doi.org/10.1016/j.neurobiolaging.2004.09.019. [DOI] [PubMed] [Google Scholar]
- Guillozet-Bongaarts AL, Cahill ME, Cryns VL, Reynolds MR, Berry RW, Binder LI, 2006. Pseudophosphorylation of tau at serine 422 inhibits caspase cleavage: in vitro evidence and implications for tangle formation in vivo. J. Neurochem. 97, 1005–1014. http://dx.doi.org/10.1111/j.1471-4159.2006.03784.x. [DOI] [PubMed] [Google Scholar]
- Harding TC, Xue L, Bienemann A, Haywood D, Dickens M, Tolkovsky AM, Uney JB, 2001. Inhibition of JNK by overexpression of the JNK binding domain of JIP-1 prevents apoptosis in sympathetic neurons. J. Biol. Chem. 276, 4531–4534. http://dx.doi.org/10.1074/jbc.C000815200. [DOI] [PubMed] [Google Scholar]
- Hellström-Lindahl E, Mousavi M, Zhang X, Ravid R, Nordberg A, 1999. Regional distribution of nicotinic receptor subunit mRNAs in human brain: comparison between Alzheimer and normal brain. Brain Res. Mol. Brain Res. 66, 94–103. [DOI] [PubMed] [Google Scholar]
- Hempstead BL, Martin-Zanca D, Kaplan DR, Parada LF, Chao MV, 1991. Highaffinity NGF binding requires coexpression of the trk proto-oncogene and the lowaffinity NGF receptor. Nature 350, 678–683. http://dx.doi.org/10.1038/350678a0. [DOI] [PubMed] [Google Scholar]
- Hollmann M, Hartley M, Heinemann S, 1991. Ca2+ permeability of KAAMPA—gated glutamate receptor channels depends on subunit composition. Science 252, 851–853. [DOI] [PubMed] [Google Scholar]
- Holtzman DM, Li Y, Parada LF, Kinsman S, Chen CK, Valletta JS, Zhou J, Long JB, Mobley WC, 1992. p140trk mRNA marks NGF-responsive forebrain neurons: evidence that trk gene expression is induced by NGF. Neuron 9, 465–478. [DOI] [PubMed] [Google Scholar]
- Hu N-W, Ondrejcak T, Rowan MJ, 2012. Glutamate receptors in preclinical research on Alzheimer’s disease: Update on recent advances. Pharmacol. Biochem. Behav. 100, 855–862. http://dx.doi.org/10.1016/j.pbb.2011.04.013. [DOI] [PubMed] [Google Scholar]
- Hyman BT, Phelps CH, Beach TG, Bigio EH, Cairns NJ, Carrillo MC, Dickson DW, Duyckaerts C, Frosch MP, Masliah E, Mirra SS, Nelson PT, Schneider JA, Thal DR, Thies B, Trojanowski JQ, Vinters HV, Montine TJ, 2012. National Institute on Aging–Alzheimer’s Association guidelines for the neuropathologic assessment of Alzheimer’s disease. Alzheimers Dement. 8, 1–13. http://dx.doi.org/10.1016/j.jalz.2011.10.007. [DOI] [PMC free article] [PubMed] [Google Scholar]
- Jones BE, Cuello AC, 1989. Afferents to the basal forebrain cholinergic cell area from pontomesencephalic–catecholamine, serotonin, and acetylcholine–neurons. Neuroscience 31, 37–61. [DOI] [PubMed] [Google Scholar]
- Kanaan NM, Kordower JH, Collier TJ, 2007. Age-related accumulation of Marinesco bodies and lipofuscin in rhesus monkey midbrain dopamine neurons: relevance to selective neuronal vulnerability. J. Comp. Neurol. 502, 683–700. http://dx.doi.org/10.1002/cne.21333. [DOI] [PubMed] [Google Scholar]
- Kanaan NM, Kordower JH, Collier TJ, 2010. Age-related changes in glial cells of dopamine midbrain subregions in rhesus monkeys. Neurobiol. Aging 31, 937–952. http://dx.doi.org/10.1016/j.neurobiolaging.2008.07.006. [DOI] [PMC free article] [PubMed] [Google Scholar]
- Kanaan NM, Morfini GA, LaPointe NE, Pigino GF, Patterson KR, Song Y, Andreadis A, Fu Y, Brady ST, Binder LI, 2011. Pathogenic forms of tau inhibit kinesin-dependent axonal transport through a mechanism involving activation of axonal phosphotransferases. J. Neurosci. 31, 9858–9868. http://dx.doi.org/10.1523/JNEUROSCI.0560-11.2011. [DOI] [PMC free article] [PubMed] [Google Scholar]
- Kanaan NM, Morfini G, Pigino G, LaPointe NE, Andreadis A, Song Y, Leitman E, Binder LI, Brady ST, 2012. Phosphorylation in the amino terminus of tau prevents inhibition of anterograde axonal transport. Neurobiol. Aging 33, 826.e15–826.e30. http://dx.doi.org/10.1016/j.neurobiolaging.2011.06.006. [DOI] [PMC free article] [PubMed] [Google Scholar]
- Kaplan DR, Miller FD, 2000. Neurotrophin signal transduction in the nervous system. Curr. Opin. Neurobiol. 10, 381–391. [DOI] [PubMed] [Google Scholar]
- Kelly SC, He Bin, Perez SE, Ginsberg SD, Mufson EJ, Counts SE, 2017. Locus coeruleus cellular and molecular pathology during the progression of. Acta Neuropathol. Commun. 1–14. http://dx.doi.org/10.1186/s40478-017-0411-2. [DOI] [PMC free article] [PubMed] [Google Scholar]
- Kendziorra K, Wolf H, Meyer PM, Barthel H, Hesse S, Becker GA, Luthardt J, Schildan A, Patt M, Sorger D, Seese A, Gertz H-J, Sabri O, 2010. Decreased cerebral α4β2* nicotinic acetylcholine receptor availability in patients with mild cognitive impairment and Alzheimer’s disease assessed with positron emission tomography. Eur. J. Nucl. Med. Mol. Imaging 38, 515–525. http://dx.doi.org/10.1007/s00259-010-1644-5. [DOI] [PubMed] [Google Scholar]
- Kim T, Lim C-S, Kaang B-K, 2015. Cell type-specific gene expression profiling in brain tissue: comparison between TRAP, LCM and RNA-seq. BMB Rep 48, 388–394. http://dx.doi.org/10.5483/BMBRep.2015.48.7.218. [DOI] [PMC free article] [PubMed] [Google Scholar]
- Klesse LJ, Parada LF, 1999. Trks: signal transduction and intracellular pathways. Microsc. Res. Tech. 45, 210–216. http://dx.doi.org/10.1002/(SICI)1097-0029(19990515/01)45:4/5<210::AID-JEMT4>3.0.CO;2-F. [DOI] [PubMed] [Google Scholar]
- Klippel A, Reinhard C, Kavanaugh WM, Apell G, Escobedo M, Williams LT, 1996. Membrane localization of phosphatidylinositol 3-kinase is sufficient to activate multiple signal-transducing kinase pathways. Mol. Cell. Biol. 16, 4117–4127. [DOI] [PMC free article] [PubMed] [Google Scholar]
- Lad SP, Neet KE, Mufson EJ, 2003. Nerve growth factor: structure, function and therapeutic implications for Alzheimer’s disease. Curr. Drug Targets CNS Neurol. Disord 2, 315–334. [DOI] [PubMed] [Google Scholar]
- LaPointe NE, Morfini G, Pigino G, Gaisina IN, Kozikowski AP, Binder LI, Brady ST, 2009. The amino terminus of tau inhibits kinesin-dependent axonal transport: implications for filament toxicity. J. Neurosci. Res. 87, 440–451. http://dx.doi.org/10.1002/jnr.21850. [DOI] [PMC free article] [PubMed] [Google Scholar]
- Levey AI, 1996. Muscarinic acetylcholine receptor expression in memory circuits: implications for treatment of Alzheimer disease. PNAS 93, 13541–13546. [DOI] [PMC free article] [PubMed] [Google Scholar]
- Li YW, Holtzman DM, Kromer LF, Kaplan DR, Chuacouzens J, Clary DO, Knusel B, Mobley WC, 1995. Regulation of Trka and Chat expression in developing rat basal forebrain - evidence that both exogenous and endogenous Ngf regulate differentiation of cholinergic neurons. J. Neurosci. 15, 2888–2905. [DOI] [PMC free article] [PubMed] [Google Scholar]
- Macosko EZ, Basu A, Satija R, Nemesh J, Shekhar K, Goldman M, Tirosh I, Bialas AR, Kamitaki N, Martersteck EM, Trombetta JJ, Weitz DA, Sanes JR, Shalek AK, Regev A, McCarroll SA, 2015. Highly parallel genome-wide expression profiling of individual cells using nanoliter droplets. Cell 161, 1202–1214. http://dx.doi.org/10.1016/j.cell.2015.05.002. [DOI] [PMC free article] [PubMed] [Google Scholar]
- Mahadeo D, Kaplan L, Chao MV, Hempstead BL, 1994. High affinity nerve growth factor binding displays a faster rate of association than p140trk binding. Implications for multi-subunit polypeptide receptors. J. Biol. Chem. 269, 6884–6891. [PubMed] [Google Scholar]
- Mamidipudi V, Wooten MW, 2002. Dual role for p75NTR signaling in survival and cell death: can intracellular mediators provide an explanation? J. Neurosci. Res. 68, 373–384. http://dx.doi.org/10.1002/jnr.10244. [DOI] [PubMed] [Google Scholar]
- Mann DM, Lincoln J, Yates PO, Stamp JE, Toper S, 1980. Changes in the monoamine containing neurones of the human CNS in senile dementia. Br. J. Psychiatry 136, 533–541. [DOI] [PubMed] [Google Scholar]
- Martin DP, Schmidt RE, Distefano PS, Lowry OH, Carter JG, Johnson EM, 1988. Inhibitors of protein-synthesis and RNA-synthesis prevent neuronal death caused by nerve growth-factor deprivation. J. Cell Biol. 106, 829–844. [DOI] [PMC free article] [PubMed] [Google Scholar]
- Martinou I, Desagher S, Eskes R, Antonsson B, Andre E, Fakan S, Martinou J, 1999. The release of cytochrome c from mitochondria during apoptosis of NGF-deprived sympathetic neurons is a reversible event. J. Cell Biol. 144, 883–889. [DOI] [PMC free article] [PubMed] [Google Scholar]
- Masoudi R, Ioannou MS, Coughlin MD, Pagadala P, Neet KE, Clewes O, Allen SJ, Dawbarn D, Fahnestock M, 2009. Biological activity of nerve growth factor precursor is dependent upon relative levels of its receptors. J. Biol. Chem. 284, 18424–18433. http://dx.doi.org/10.1074/jbc.M109.007104. [DOI] [PMC free article] [PubMed] [Google Scholar]
- Mesulam M, Mufson EJ, Levey AI, Wainer BH, 1983. Cholinergic innervation of cortex by the basal forebrain: cytochemistry and cortical connections of the septal area, diagonal band nuclei, nucleus basalis (substantia innominata), and hypothalamus in the rhesus monkey. J. Comp. Neurol. 214, 170–197. [DOI] [PubMed] [Google Scholar]
- Mesulam M, Shaw P, Mash D, Weintraub S, 2004. Cholinergic nucleus basalis tauopathy emerges early in the aging-MCI-AD continuum. Ann. Neurol. 55, 815–828. http://dx.doi.org/10.1002/ana.20100. [DOI] [PubMed] [Google Scholar]
- Miller FD, Kaplan DR, 2001. Neurotrophin signalling pathways regulating neuronal apoptosis. Cell. Mol. Life Sci. 58, 1045–1053. http://dx.doi.org/10.1007/PL00000919. [DOI] [PMC free article] [PubMed] [Google Scholar]
- Mirra SS, Heyman A, McKeel D, Sumi SM, Crain BJ, 1991. The Consortium to Establish a Registry for Alzheimer’s Disease (CERAD) part II. Standardization of the neuropathologic assessment of Alzheimer’s disease. Neurol. Sci. 41, 479–486. [DOI] [PubMed] [Google Scholar]
- Mufson EJ, Bothwell M, Hersh LB, Kordower JH, 1989. Nerve growth factor receptor immunoreactive profiles in the normal, aged human basal forebrain: colocalization with cholinergic neurons. J. Comp. Neurol. 285, 196–217. http://dx.doi.org/10.1002/cne.902850204. [DOI] [PubMed] [Google Scholar]
- Mufson EJ, Conner JM, Kordower JH, 1995. Nerve growth-factor in Alzheimersdisease: defective retrograde transport to nucleus basalis. Neuroreport 6, 1063–1066. [DOI] [PubMed] [Google Scholar]
- Mufson EJ, Lavine N, Kordower JH, Quirion R, Saragovi HU, 1997. Reduction in p140-TrkA receptor protein within the nucleus basalis and cortex in Alzheimer’s disease. Exp. Neurol. 146, 91–103. [DOI] [PubMed] [Google Scholar]
- Mufson EJ, Jaffar S, Levey AI, 1998. m2 muscarinic acetylcholine receptor-immunoreactive neurons are not reduced within the nucleus basalis in Alzheimer’s disease: relationship with cholinergic and …. J. Comp. Neurol. 392, 313–329. [PubMed] [Google Scholar]
- Mufson EJ, Chen EY, Cochran EJ, Beckett LA, Bennett DA, Kordower JH, 1999. Entorhinal cortex β-amyloid load in individuals with mild cognitive impairment. Exp. Neurol. 158, 469–490. [DOI] [PubMed] [Google Scholar]
- Mufson EJ, Ma SY, Cochran EJ, Bennett DA, Beckett LA, Jaffar S, Saragovi HU, Kordower JH, 2000. Loss of nucleus basalis neurons containing trkA immunoreactivity in individuals with mild cognitive impairment and early Alzheimer’s disease. J. Comp. Neurol. 427, 19–30. http://dx.doi.org/10.1002/1096-9861(20001106)427:1<19::AID-CNE2>3.0.CO;2-A. [DOI] [PubMed] [Google Scholar]
- Mufson EJ, Counts SE, Ginsberg SD, 2002a. Gene expression profiles of cholinergic nucleus basalis neurons in Alzheimer’s disease. Neurochem. Res. 27, 1035–1048. [DOI] [PubMed] [Google Scholar]
- Mufson EJ, Ma SY, Dills J, Cochran EJ, Leurgans S, Wuu J, Bennett DA, Jaffar S, Gilmor ML, Levey AI, Kordower JH, 2002b. Loss of basal forebrain P75NTR immunoreactivity in subjects with mild cognitive impairment and Alzheimer’s disease. J. Comp. Neurol. 443, 136–153. http://dx.doi.org/10.1002/cne.10122. [DOI] [PubMed] [Google Scholar]
- Mufson EJ, Ginsberg SD, Ikonomovic MD, DeKosky ST, 2003. Human cholinergic basal forebrain: chemoanatomy and neurologic dysfunction. J. Chem. Neuroanat. 26, 233–242. http://dx.doi.org/10.1016/S0891-0618(03)00068-1. [DOI] [PubMed] [Google Scholar]
- Mufson EJ, Counts SE, Fahnestock M, Ginsberg SD, 2007. Cholinotrophic molecular substrates of mild cognitive impairment in the elderly. Curr. Alzheimer Res. 4, 340–350. [DOI] [PubMed] [Google Scholar]
- Mufson EJ, Malek-Ahmadi M, Snyder N, Ausdemore J, Chen K, Perez SE, 2016. Braak stage and trajectory of cognitive decline in noncognitively impaired elders. Neurobiol. Aging 43, 101–110. http://dx.doi.org/10.1016/j.neurobiolaging.2016.03.003. [DOI] [PMC free article] [PubMed] [Google Scholar]
- Nishizuka Y, 1988. The molecular heterogeneity of protein kinase C and its implications for cellular regulation. Nature 334, 661–665. [DOI] [PubMed] [Google Scholar]
- Olney JW, Wozniak DF, Farber NB, 1997. Excitotoxic neurodegeneration in Alzheimer disease. New hypothesis and new therapeutic strategies. Arch. Neurol. 54, 1234–1240. [DOI] [PubMed] [Google Scholar]
- Park DS, Levine B, Ferrari G, Greene LA, 1997. Cyclin dependent kinase inhibitors and dominant negative cyclin dependent kinase 4 and 6 promote survival of NGFdeprived sympathetic neurons. J. Neurosci. 17, 8975–8983. [DOI] [PMC free article] [PubMed] [Google Scholar]
- Park DS, Morris EJ, Padmanabhan J, Shelanski ML, Geller HM, Greene LA, 1998. Cyclin-dependent kinases participate in death of neurons evoked by DNA-damaging agents. J. Cell Biol. 143, 457–467. [DOI] [PMC free article] [PubMed] [Google Scholar]
- Park DS, Morris EJ, Bremner R, Keramaris E, Padmanabhan J, Rosenbaum M, Shelanski ML, Geller HM, Greene LA, 2000. Involvement of retinoblastoma family members and E2F/DP complexes in the death of neurons evoked by DNA damage. J. Neurosci. 20, 3104–3114. [DOI] [PMC free article] [PubMed] [Google Scholar]
- Peng SY, Wuu J, Mufson EJ, Fahnestock M, 2004. Increased proNGF levels in subjects with mild cognitive impairment and mild Alzheimer disease. J. Neuropathol. Exp. Neurol. 63, 641–649. [DOI] [PubMed] [Google Scholar]
- Perez SE, He B, Nadeem M, Wuu J, Ginsberg SD, Ikonomovic MD, Mufson EJ, 2015a. Hippocampal endosomal, lysosomal, and autophagic dysregulation in mild cognitive impairment: correlation with Aβ and tau pathology. J. Neuropathol. Exp. Neurol. 74. [DOI] [PMC free article] [PubMed] [Google Scholar]
- Perez SE, He B, Nadeem M, Wuu J, Scheff SW, Abrahamson EE, Ikonomovic MD, Mufson EJ, 2015b. Resilience of precuneus neurotrophic signaling pathways despite amyloid pathology in prodromal Alzheimer’s disease. Biol. Psychiatry 77, 693–703. http://dx.doi.org/10.1016/j.biopsych.2013.12.016. [DOI] [PMC free article] [PubMed] [Google Scholar]
- Petersen RC, Doody R, Kurz A, Mohs RC, Morris JC, Rabins PV, Ritchie K, Rossor M, Thal L, Winblad B, 2001. Current concepts in mild cognitive impairment. Arch. Neurol. 58, 1985–1992. http://dx.doi.org/10.1001/archneur.58.12.1985. [DOI] [PubMed] [Google Scholar]
- Putcha GV, Deshmukh M, Johnson EM, 1999. BAX translocation is a critical event in neuronal apoptosis: regulation by neuroprotectants, BCL-2, and caspases. J. Neurosci. 19, 7476–7485. [DOI] [PMC free article] [PubMed] [Google Scholar]
- Reiner A, Yekutieli D, Benjamini Y, 2003. Identifying differentially expressed genes using false discovery rate controlling procedures. 19, 368–375. http://dx.doi.org/10.1093/bioinformatics/btf877. [DOI] [PubMed] [Google Scholar]
- Riascos D, Nicholas A, Samaeekia R, Yukhananov R, Mesulam MM, Bigio EH, Weintraub S, Guo L, Geula C, 2014. Neurobiology of aging. Neurobiol. Aging 35, 1325–1333. http://dx.doi.org/10.1016/j.neurobiolaging.2013.12.017. [DOI] [PMC free article] [PubMed] [Google Scholar]
- Roux PP, Barker PA, 2002. Neurotrophin signaling through the p75 neurotrophin receptor. Prog. Neurobiol. 67, 203–233. [DOI] [PubMed] [Google Scholar]
- Roux PP, Bhakar AL, Kennedy TE, Barker PA, 2001. The p75 neurotrophin receptor activates Akt (protein kinase B) through a phosphatidylinositol 3-kinase-dependent pathway. J. Biol. Chem. 276, 23097–23104. http://dx.doi.org/10.1074/jbc.M011520200. [DOI] [PubMed] [Google Scholar]
- Salehi A, Verhaagen J, Dijkhuizen PA, Swaab DF, 1996. Co-localization of highaffinity neurotrophin receptors in nucleus basalis of Meynert neurons and their differential reduction in Alzheimer’s disease. Neuroscience 75, 373–387. [DOI] [PubMed] [Google Scholar]
- Scott SA, Mufson EJ, Weingarten JA, Skau KA, Crutcher KA, 1995. Nerve growth-factor in Alzheimers-disease: increased levels throughout the brain coupled with declines in nucleus basalis. J. Neurosci. 15, 6213–6221. [DOI] [PMC free article] [PubMed] [Google Scholar]
- Smiley JF, Mesulam MM, 1999. Cholinergic neurons of the nucleus basalis of meynert receive cholinergic, catecholaminergic and gabaergic synapses: an electron microscopic investigation in the monkey. Neuroscience 88, 241–255. [DOI] [PubMed] [Google Scholar]
- Smiley JF, Subramanian M, Mesulam MM, 1999. Monoaminergic-cholinergic interactions in the primate basal forebrain. Neuroscience 93, 817–829. [DOI] [PubMed] [Google Scholar]
- Sofroniew MV, Howe CL, Mobley WC, 2001. Nerve growth factor signaling, neuroprotection, and neural repair. Annu. Rev. Neurosci. 24, 1217–1281. [DOI] [PubMed] [Google Scholar]
- Sze CI, Bi H, Kleinschmidt-DeMasters BK, Filley CM, Martin LJ, 2001. N-methyl-D-aspartate receptor subunit proteins and their phosphorylation status are altered selectively in Alzheimer’s disease. J. Neurol. Sci. 182, 151–159. [DOI] [PubMed] [Google Scholar]
- Tang YP, Wang H, Feng R, Kyin M, Tsien JZ, 2001. Differential effects of enrichment on learning and memory function in NR2B transgenic mice. Neuropharmacology 41, 779–790. [DOI] [PubMed] [Google Scholar]
- Teaktong T, Graham AJ, Court JA, Perry RH, Jaros E, Johnson M, Hall R, Perry EK, 2004. Nicotinic acetylcholine receptor immunohistochemistry in Alzheimer’s disease and dementia with Lewy bodies: differential neuronal and astroglial pathology. J. Neurol. Sci. 225, 39–49. http://dx.doi.org/10.1016/j.jns.2004.06.015. [DOI] [PubMed] [Google Scholar]
- Terrière E, Dempsey MF, Herrmann LL, Tierney KM, Lonie JA, O’Carroll RE, Pimlott S, Wyper DJ, Herholz K, Ebmeier KP, 2010. 5-123I-A-85380 binding to the α4β2-nicotinic receptor in mild cognitive impairment. Neurobiol. Aging 31, 1885–1893. http://dx.doi.org/10.1016/j.neurobiolaging.2008.10.008. [DOI] [PubMed] [Google Scholar]
- Theofilas P, Ehrenberg AJ, Dunlop S, Di Lorenzo Alho AT, Nguy A, Leite REP, Rodriguez RD, Mejia MB, Suemoto CK, Ferretti-Rebustini REDL, Polichiso L, Nascimento CF, Seeley WW, Nitrini R, Pasqualucci CA, Jacob Filho W, Rueb U, Neuhaus J, Heinsen H, Grinberg LT, 2017. Locus coeruleus volume and cell population changes during Alzheimer’s disease progression: a stereological study in human postmortem brains with potential implication for early-stage biomarker discovery. Alzheimers Dement. 13, 236–246. http://dx.doi.org/10.1016/j.jalz.2016.06.2362. [DOI] [PMC free article] [PubMed] [Google Scholar]
- Tiernan CT, Combs B, Cox K, Morfini G, Brady ST, Counts SE, Kanaan NM, 2016a. Pseudophosphorylation of tau at S422 enhances SDS-stable dimer formation and impairs both anterograde and retrograde fast axonal transport. Exp. Neurol. 283, 318–329. http://dx.doi.org/10.1016/j.expneurol.2016.06.030. [DOI] [PMC free article] [PubMed] [Google Scholar]
- Tiernan CT, Ginsberg SD, Guillozet-Bongaarts AL, Ward SM, He Bin, Kanaan NM, Mufson EJ, Binder LI, Counts, 2016b. Protein homeostasis gene dysregulation in pretangle-bearing nucleus basalis neurons during the progression of Alzheimer’s disease. Neurobiol. Aging 42, 80–90. http://dx.doi.org/10.1016/j.neurobiolaging.2016.02.031. [DOI] [PMC free article] [PubMed] [Google Scholar]
- Vana L, Kanaan NM, Ugwu IC, Wuu J, Mufson EJ, Binder LI, 2011. Progression of tau pathology in cholinergic basal forebrain neurons in mild cognitive impairment and Alzheimer’s disease. Am. J. Pathol. 179, 2533–2550. http://dx.doi.org/10.1016/j.ajpath.2011.07.044. [DOI] [PMC free article] [PubMed] [Google Scholar]
- Wu C-K, Thal L, Pizzo D, Hansen L, Masliah E, Geula C, 2005. Apoptotic signals within the basal forebrain cholinergic neurons in Alzheimer’s disease. Exp. Neurol. 195, 484–496. http://dx.doi.org/10.1016/j.expneurol.2005.06.020. [DOI] [PubMed] [Google Scholar]
- Yoon SO, Casaccia-Bonnefil P, Carter B, Chao MV, 1998. Competitive signaling between TrkA and p75 nerve growth factor receptors determines cell survival. J. Neurosci. 18, 3273–3281. [DOI] [PMC free article] [PubMed] [Google Scholar]
- Zaborszky L, Cullinan WE, 1996. Direct catecholaminergic-cholinergic interactions in the basal forebrain. I. Dopamine-β-hydroxylase-and tyrosine hydroxylase input to cholinergic neurons. J. Comp. Neurol. 374, 535–554. [DOI] [PubMed] [Google Scholar]