

Abstract
A key step in nutrient sensing is the activation of the master growth regulator, mTORC1 kinase, on the surface of lysosomes. Nutrients enable mTORC1 scaffolding by a complex composed of the Rag GTPases (Rags) and Ragulator, but the underlying mechanism of mTORC1 capture is poorly understood. Combining dynamic imaging in cells and reconstituted systems, we uncover an affinity switch that controls mTORC1 lifetime and activation at the lysosome. Nutrients destabilize the Rag-Ragulator interface, causing cycling of the Rags between lysosome-bound Ragulator and the cytoplasm, and rendering mTORC1 capture contingent on simultaneous engagement of two Rag-binding interfaces. Rag GTPase domains trigger cycling by coordinately weakening binding of the C-terminal domains to Ragulator in a nucleotide-controlled manner. Cancer-specific Rag mutants override release from Ragulator and enhance mTORC1 recruitment and signaling output. Cycling in the active state sets the Rags apart from most signaling GTPases, and provides a mechanism to attenuate mTORC1 signaling.
INTRODUCTION
A key event in nutrient-dependent signal transduction is the recruitment of the master growth regulator, mechanistic Target of Rapamycin Complex 1 (mTORC1) kinase, to the surface of lysosomes. mTORC1 integrates signals from nutrients, growth factors and energy to drive cellular mass accumulation and proliferation, while simultaneously inhibiting nutrient scavenging and quality-control 1, 2. Due to its extensive actions on cellular metabolism, dysregulated mTORC1 signaling is a driving force in diseases ranging from cancer to type-2 diabetes to neurodegeneration1, 2.
Nutrients, including amino acids, glucose and lipids, drive the recruitment of mTORC1 to the lysosomal surface via the Rag Guanosine Triphosphatases (GTPases) 3-8. The Rags are heterodimers of functionally equivalent Rag A or B in complex with functionally equivalent Rag C or D6, 8. A second GTPase, Rheb, downstream of the insulin-PhosphatidylInositol 3-Kinase (PI3K) pathway1, 2, unlocks mTORC1 kinase activity and enables phosphorylation of mTORC1 substrates7-10. Current evidence suggests that, similar to other small GTPase-regulated kinases, mTORC1 must be bound to the lysosomal membrane surface and in physical contact with Rheb in order to be active 7, 9-12. Thus, factors regulating the residence time of mTORC1 at the lysosomal surface should play critical roles in regulating mTORC1 signaling strength, as suggested by the recent identification of oncogenic mutations or deletions in several of these factors13-15.
Lysosomal recruitment of mTORC1 requires a concerted transition in the nucleotide-binding state of the Rag GTPases. The ‘inactive’ combination of GDP-loaded Rag A/B and GTP-loaded Rag C/D is unable to bind to mTORC1, which remains inactive in the cytoplasm. Conversely, GTP-loaded Rag A/B and GDP-loaded Rag C/D capture mTORC1 to the lysosomal surface by binding to its Raptor subunit6, 8. Dedicated GTPase Activating Proteins (GAPs) and Guanine nucleotide Exchange Factors (GEFs) control the transition between inactive and active Rag nucleotide states3, 13, 16-20 in response to amino acid and lipid ligands that bind to dedicated sensors located at the lysosome or in the cytoplasm4, 21-25.
The Rags are scaffolded to the lysosomal surface by the pentameric Ragulator complex, composed of p18, p14, MP1, c7orf59 and HBXIP (also known as Lamtor1-5, respectively)7, 16, 26. Ragulator is specifically targeted to the lysosome via myristoyl and palmitoyl modifications of the N-terminal region of its p18/Lamtor1 subunit7, 27. In addition to its scaffolding function, Ragulator has been reported to be a GEF for RagA/B16. Thus, Ragulator could couple Rag anchoring to the lysosome to their activation. How Rag binding to Ragulator is controlled, and how their interaction coordinates mTORC1 recruitment with kinase activation remains unclear.
We dissected the lysosomal mTORC1 capture process using dynamic imaging both in cells and in minimal reconstituted systems. These studies reveal an affinity switch that enables Rag-mTORC1 binding, while destabilizing Rag GTPase binding to Ragulator. This mechanism renders mTORC1 recruitment dependent on the simultaneous engagement of two highly dynamic interfaces on the Rag GTPases, a feature that prevents mTORC1 hyperaccumulation and oncogenic activity.
RESULTS
mTORC1 association with the lysosome is transient and involves a minor fraction of the total cellular pool
To determine the efficiency of mTORC1 lysosomal capture, we quantitated the fraction of lysosome-localized mTORC1 from z-stacks of U2OS cells. The percent of endogenous mTOR signal that colocalized with lysosomes (LAMP2) in nutrient-stimulated cells was only around 50% (Fig. 1a,b and Supplementary Fig. 1a). We obtained similar results in HAP-1 cells in which the endogenous Raptor gene is tagged with GFP (Raptor:GFP)28 (Fig. 1a,b and Supplementary Fig. 1a). This finding, which was supported by subcellular fractionation experiments (Supplementary Fig. 1b), is surprising given that Rags and Ragulator are estimated to be in excess of Raptor with stoichiometries ranging between 4:1 and 25:129. Thus, mTORC1 lysosomal binding is not saturated in nutrient-replete conditions.
Figure 1. mTORC1 association with the lysosome is transient and involves a minor fraction of the total cellular pool.
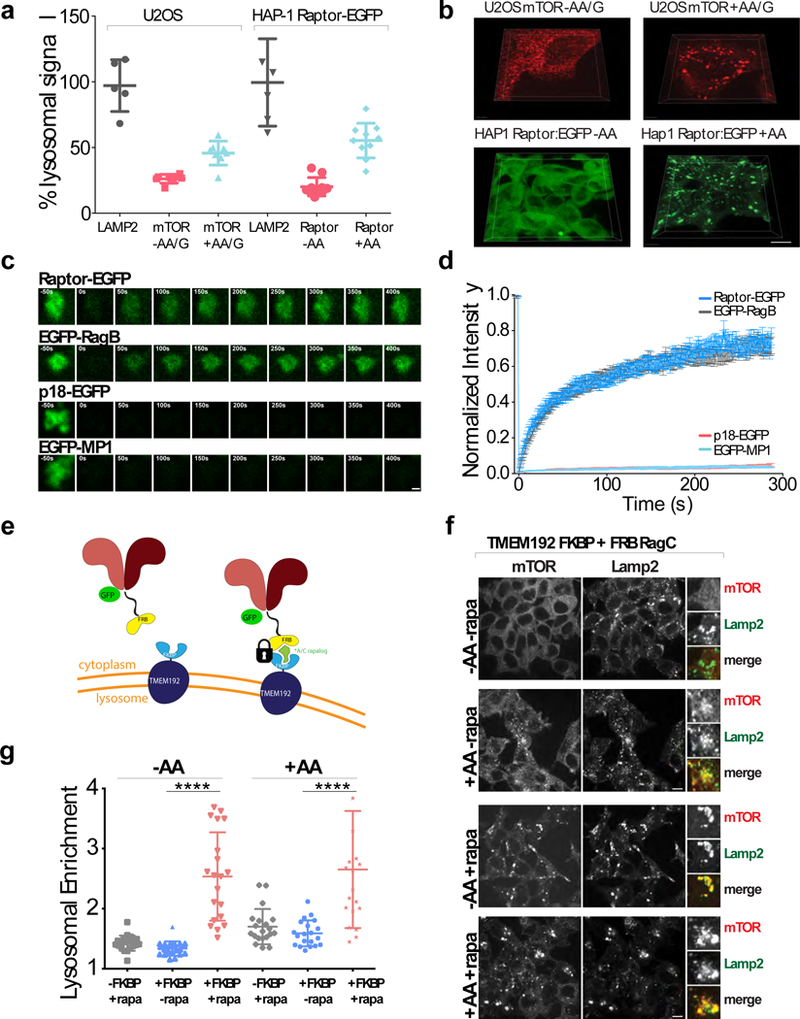
(a)Quantitation of lysosome-localized mTOR or Raptor:EGFP from U2OS or genome edited HAP-1 Raptor:GFP cells, respectively. U2OS cells were starved for amino acids and glucose (-AA/G) or starved and restimulated (+AA/G), and HAP-1 Raptor:EGFP cells were starved for amino acids (-AA) or starved and restimulated (+AA) followed by 3-D volumetric analysis of z-stacks. (average ± Standard Deviation (SD), [U2OS Lamp2 N=5, U2OS mTOR-AA/G N=7, U2OS mTOR +AA/G N=9, Hap1 LAMP2 N=6, Hap1 Raptor-EGFP -AA/G N=10, Hap1 Raptor-EGFP +AA/G N=10] fields of cells respectively. (b) (Top) Representative 3D images of U2OS cells analyzed as in (a). (Bottom) Representative 3D images of HAP-1 Raptor:EGFP cells analyzed as in (a). Scale bar 10 μm. Experiment performed 1 time. (c) Time-lapse of Fluorescence Recovery After Photobleaching (FRAP) of single lysosomes in U2OS cells expressing the indicated EGFP-tagged mTORC1, Rag GTPase and Ragulator subunits. Scale bar 1 μm. (d) Fluorescence over time curves from FRAP experiments in U2OS cells expressing the indicated constructs. Each curve is the average ± S.E.M. of [Raptor-EGFP N=21, EGFP-RagB N=14, p18-EGFP N=21, EGFP-MP1 N=24] lysosomes. (e) Schematic of in vivo induced dimerization assay for locking Rags to the lysosomal surface via rapalogue-mediated FRB/FKBP induced dimerization to the TMEM192 lysosomal resident protein. (f) Immunofluorescence images of 293T cells expressing the indicated constructs that have been starved of amino acids for 1 hour (‘-AA’) or starved for 50 minutes then restimulated with amino acids for 10 minutes (‘+AA’). For conditions treated with 50 nM rapalogue (rapa), the drug was added for 20 minutes prior to starvation and was maintained in the media throughout starvation. Scale bar 10 μm. (g) Quantitation of mTOR Lysosomal Enrichment Score for immunofluorescence images in (f) (mean ± S.D., N=20 cells for all conditions, **** p<0.0001, two-sided unpaired t-test). See Supplementary Table 1 for statistics source data.
To determine whether the lysosome-bound and cytoplasmic mTORC1 pools are separate or in dynamic equilibrium, we performed Fluorescence Recovery After Photobleaching (FRAP), which reveals the rate of exchange between two populations30. We transiently expressed GFP-tagged Raptor, Rags or Ragulator in U2OS cells, photobleached selected GFP-positive lysosomes, and measured fluorescence recovery over five-minute periods (Fig. 1c,d). To minimize measurement errors due to microtubule-based lysosomal motility, we briefly treated cells with nocodazole prior to imaging. Nocodazole did not appreciably affect mTORC1 lysosomal localization or nutrient-stimulated signaling (Supplementary Fig. 1c,d).
In nutrient-replete cells, Raptor:GFP fluorescence recovered to 70-80% of pre-bleach intensity, with halftimes on the order of 30 seconds (Fig. 1c,d), indicating that mTORC1 actively exchanges between lysosome-bound and cytoplasmic pools. Similar results were obtained with Raptor:GFP genome-edited HAP-1 cells, ruling out overexpression artifacts (Supplementary Fig. 1e). Ragulator subunits p18 and MP1 showed minimal fluorescence recovery, indicating stable binding to the lysosomal surface (Fig. 1c,d, and Supplementary Fig. 1f,g). Surprisingly, both GFP-tagged RagB and RagC actively exchanged between the lysosomal surface and the cytoplasm, with kinetics nearly identical to Raptor:GFP (Fig. 1c,d, and Supplementary Fig. 1f,g)
Spatial cycling of the Rag GTPases could limit lysosomal accumulation of mTORC1 in full nutrients. To directly test this possibility, we engineered a system to inducibly lock the Rags to the lysosomal surface via heterodimerization of the FRB domain fused to RagA or RagC with the FKBP domain fused to lysosomal transmembrane protein TMEM192 31, 32,33, 34 (Fig. 1e). Addition of a rapamycin-like molecule (rapalogue) which does not target endogenous mTORC135 induced dimerization of FRB-RagC with TMEM192 FKBP as shown by loss of fluorescence recovery following photobleaching (Supplementary Fig. 2a).
Locking the Rags to the lysosome strongly increased mTORC1 lysosomal recruitment compared to non-rapalogue-treated cells, or to rapalogue-treated cells expressing TMEM192 without FKBP (Fig. 1f,g and Supplementary Fig. 2b). Notably, upon Rag dimerization to TMEM192-FKBP, mTORC1 did not release from lysosomes upon nutrient withdrawal (Fig. 1f,g and Supplementary Fig. 2b), suggesting that release of Rags from the lysosome may facilitate their inactivation and subsequent dissociation from mTORC1.
To determine whether the Rags and mTORC1 could stabilize each other at the lysosomal surface, we fractionated cells expressing a membrane-anchored Raptor isoform (Raptor-Rheb15) 7. Larger amounts of RagC and RagA were recovered in membrane fractions from cells expressing Raptor-Rheb15 than in control Raptor-expressing cells (Supplementary Fig. 2c). Consistently, in cells expressing Raptor-Rheb15, both RagA and RagC were strongly clustered on lysosomes to a much greater extent than in control cells (Supplementary Fig. 2d and 2e). Thus, the transient Rag-mTORC1 complex can be stabilized when either partner is more securely attached to the lysosomal membrane.
Nutrients control Rag GTPase association with the lysosomal surface
Nutrients are thought to switch the Rag GTPases to the ‘active’ (mTORC1-binding) nucleotide state 6, 8. Thus, we asked whether nutrients and nucleotide state also control Rag spatial cycling. By quantifying spatial colocalization between endogenous Rags and Lamp2, we noticed that the fraction of lysosome-bound RagA and RagC decreased in response to nutrient stimulation, whereas the lysosomal fraction of Ragulator subunit p18 was nutrient-independent (Fig. 2a,b).
Figure 2. The Rag GTPases cycle between the lysosome and the cytoplasm in a nutrient-controlled manner.
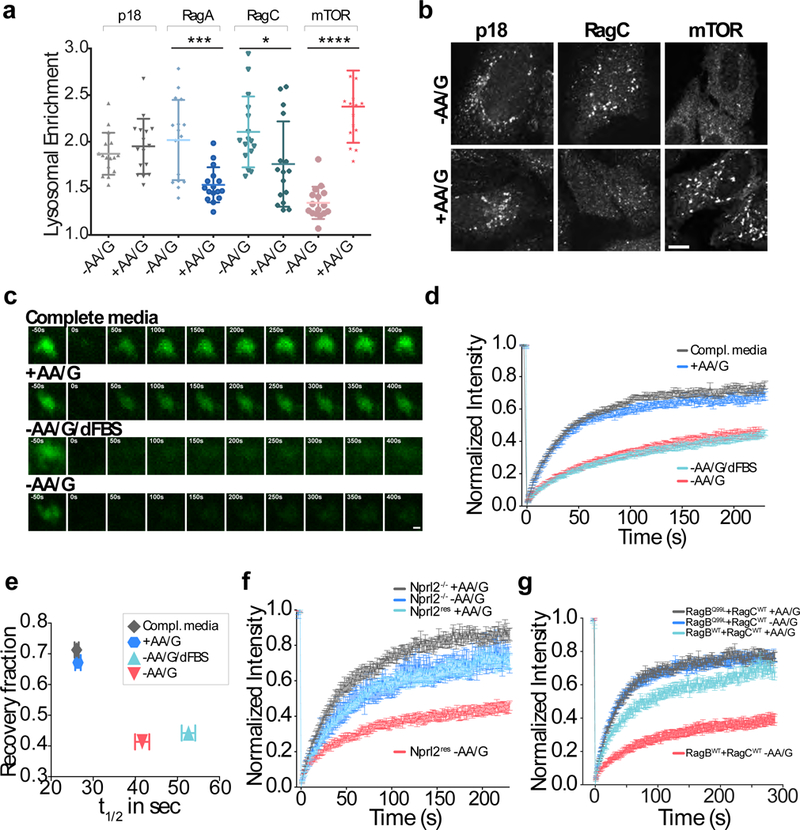
(a)Quantitation of Lysosomal Enrichment Score for p18, RagA, RagC and mTOR based on endogenous LAMP2 staining in U2OS cells that were starved for amino acids and glucose for 2h (‘-AA/G’), or starved for 1.5h and restimulated for amino acids and glucose for 30 min (‘+AA/G’) (mean ± S.D., N =16 cells/condition, *** p=0.0003, * p=0.0274, **** p<0.0001, two-sided unpaired t-tests). (b) Representative immunofluorescence images analyzed in (a). Scale bar 10 μm. (c) FRAP time-lapse of single lysosomes in U2OS cells expressing GFP-RagB + FLAG-RagC and subjected to the indicated nutrient conditions. “Compl. Media” indicates that cells were kept continuously in complete media, whereas “+AA/G” cells were starved of amino acids and glucose for 1.5hr then restimulated with amino acids and glucose for 30 min. “-AA/G/dFBS” indicates that cells were deprived of dialyzed FBS during starvation whereas -AA/G were starved in the presence of dialyzed FBS. Scale bar 1 μm. (d) Fluorescence over time curves from FRAP experiments in (c). Each curve is the average ± S.E.M. of [Compl. media N=30, +AA/G N=24, -AA/G/dFBS N=28, -AA/G N=27] lysosomes. (e) Plot showing inverse correlation between recovery fraction and halftime (t1/2) from the curves in (d). Shown are best fit values with 95% confidence intervals. (f) Fluorescence over time curves from FRAP experiments on SW780 Nprl2−/− cells and SW780 Nprl2 rescue (Nprl2res) cells expressing GFP-RagB that were either starved or restimulated for amino acids and glucose. Each curve is the average ± S.E.M. of [grey N=22, dark blue N=13, light blue N=20, red N=18] lysosomes. (g) Fluorescence over time curves from FRAP experiments on U2OS cells coexpressing GFP-RagBQ99L (nucleotide hydrolysis deficient mutant) or GFP-RagBWT along with FLAG-RagC, which were either starved or restimulated for amino acids and glucose. Each curve is the average ± S.E.M. of [grey N=20, dark blue N=16, light blue N=22, red N=21] lysosomes. See Supplementary Table 1 for statistics source data.
In FRAP experiments conducted under high nutrients, Rags had a higher recovery fraction than in starved conditions, indicating transient association with the lysosome (Fig. 2c-e and Supplementary Video 1). In cells lacking the Nprl2 component of the RagA/B-specific GAP, GATOR1 6, 8, 13, 17, GFP-RagB exhibited high fluorescence recovery independent of nutrient status, and re-expressing Nprl2 was sufficient to restore suppression of RagB cycling by nutrient withdrawal (Fig. 2f). Similarly, GTP-locked GFP-RagBQ99L was highly dynamic irrespective of nutrient condition (Fig. 2g). In contrast, in cells lacking FLCN, the GAP for RagC/D, Rag GTPase cycling was indistinguishable from wild-type cells and fully responsive to nutrient status (Supplementary Fig. 3a).
Unlike the Rags, Ragulator remained stably bound to the lysosomal surface irrespective of nutrient status (Supplementary Fig. 3b). Also, the resident lysosomal GTPase Rab7 displayed nearly identical recovery fractions in nutrient starved and replete conditions (Supplementary Fig. 3b). Thus, by controlling the nucleotide state of RagA/B, nutrients specifically trigger the cycling of Rags between the lysosomal and the cytoplasmic pools.
Taken together, these data indicate that nutrient-driven mTORC1 recruitment to the lysosome is intrinsically inefficient. Nutrients enable the Rag GTPases to bind mTORC1, but also trigger their dissociation from the lysosomal surface. As suggested by heterodimerization experiments, Rag cycling places a limit on the amount of mTORC1 that is bound to lysosomes.
GTP-loading of RagA/B destabilizes the interaction between Rag GTPases and Ragulator
To dissect nutrient-regulated spatial cycling of the Rag GTPases in mechanistic detail, we engineered a minimal reconstituted system that enables dynamic analysis of Ragulator-Rag interactions (Fig. 3a)36-38. Recombinant, GST-tagged Ragulator was immobilized to glutathione beads and incubated with excess GFP-tagged Rag heterodimers. After a short incubation, Ragulator-coated beads (but not beads coated with a control protein, GST-Metap2) acquired a uniform green fluorescent signal, indicating Rag binding to Ragulator (Fig. 3b).
Figure 3. GTP-loading of RagA/B destabilizes Ragulator-Rag GTPase interaction.
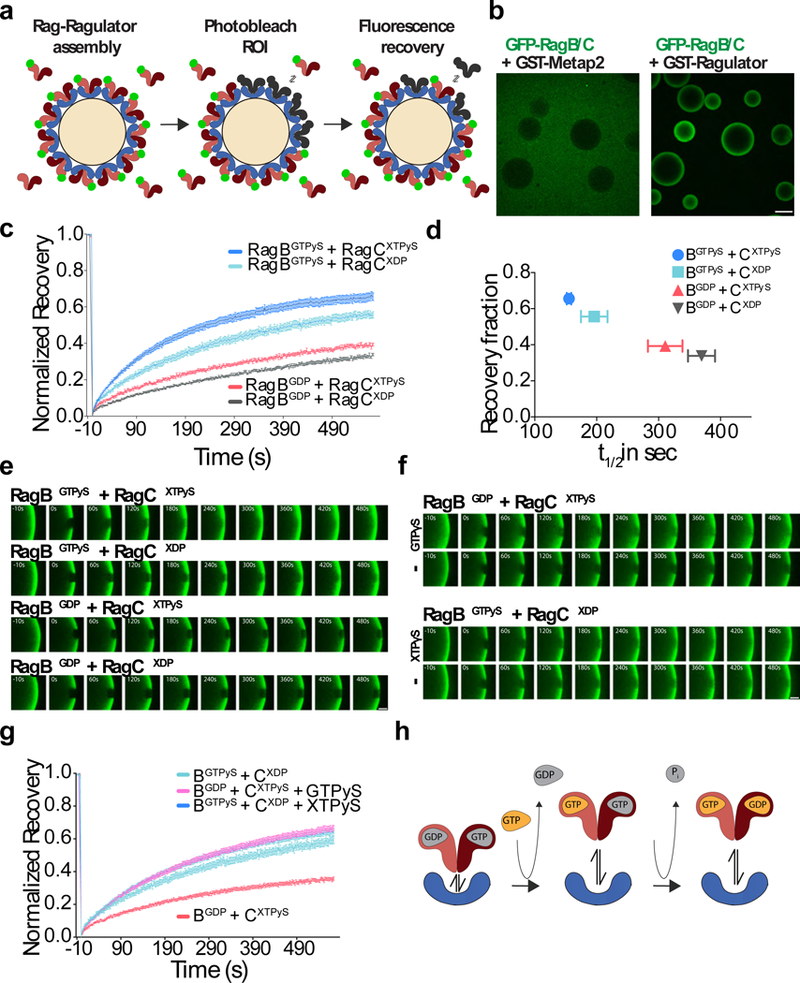
(a)Schematic of the fluorescence in vitro binding assay for interaction of soluble, GFP-tagged Rag GTPases with non-fluorescent, bead-bound Ragulator. Excess GFP-Rags in solution allow fluorescence recovery upon photobleaching of a bead section. (b) Confocal images of glutathione beads coated with GST-Metap2 (left) or pentameric GST-Ragulator (right) and incubated with an excess of GFP-RagB + FLAG-RagC. Scale bar 100 μm. Experiment repeated 3 times. (c) In vitro FRAP experiment in which Ragulator-coated beads were incubated with GFP-RagB + FLAG-RagCD181N (X-mutant) and loaded with the indicated guanine nucleotide combinations. Each curve is the average ± S.E.M. of [GTPγS/XTPγS N=12, GTPγS/XDP N=6, GDP/XTPγS N=6, GDP/XDP N=4] bead regions. (d) Plot of recovery fraction vs. halftime (t1/2) from the fits in (c). Shown are best fit values with 95% confidence intervals. (e) FRAP time-lapse of single ROIs from Ragulator-coated beads incubated with excess GFP-RagB + FLAG-RagCD181N (X-mutant) and loaded with the indicated guanine or xanthosine nucleotide combinations. Scale bar 10 μm. Experiment repeated 3 times. (f) FRAP time-lapse of single ROIs from Ragulator-coated beads incubated with excess GFP-RagB + FLAG-RagCD181N (X-mutant) loaded with the indicated guanine nucleotide combinations and, where indicated, incubated with 1mM GTPγS or XTPγS. Scale bar 10 μm. (g) FRAP curves related to the experiment in (f). Each curve is the average ± S.E.M. of [GTPγS/XDP N=8, GDP/XTPγS N=8, GDP/XTPγS + GTPγS N=11, GTPγS/XDP + XTPγS N=12] bead regions. (h) Model displaying destabilization of Ragulator-Rag GTPase interaction upon GTP-loading of RagA/B. Interaction with Ragulator is minimally affected by the nucleotide state of Rag C/D.See Supplementary Table 1 for statistical source data.
When we photobleached a small region of the bead in the presence of excess, unbound GFP-Rags, a large fraction of the initial fluorescence recovered. The recovery percentage and rate were independent of the concentration of excess GFP-Rags, which therefore were not rate-limiting (Supplementary Fig. 4a-c). However, without excess of unbound GFP-Rags, no fluorescence recovery occurred, indicating absence of lateral mobility of Ragulator-Rag complexes on the bead surface (Supplementary Fig. 4d,e). Furthermore, no fluorescence recovery was observed for bead-bound GST-RagB + GFP-RagC (without Ragulator) incubated in the presence of excess FLAG-RagB + GFP-RagC, indicating that Rag heterodimers are stable and do not exchange individual Rag subunits (Supplementary Fig. 4f,g).
Next, we tested whether cycling off Ragulator in vitro is governed by Rag nucleotide state, as suggested by our results in cells. To load the two Rags independently with nucleotides, we utilized a RagC mutant that binds preferentially to xanthosine over guanosine nucleotides (RagCX)16, 39. RagAWT and RagCX were co-expressed, co-purified, and independently loaded with nucleotides in vitro. Using FRAP, we established that the ‘inactive-loaded’ GFP-tagged RagBGDP + RagCXTPγS heterodimer bound to Ragulator on the beads more stably than the ‘active-loaded’ RagBGTPγS + RagCXDP heterodimer (Fig. 3c-e). Interestingly, the ‘double-GTP’ heterodimer (RagBGTPγS + RagCXTP), which likely represents a transition state, exhibited slightly higher fluorescence recovery than the active-loaded Rags. Conversely, RagBGDP + RagCXDP was the least mobile (Fig. 3c-e).
When inactive-loaded RagBGDP + RagCXTPγS were provided with excess GTPγS, they transitioned to the high cycling state, consistent with RagB exchanging GDP with GTPγS (Fig. 3f,g). In contrast, supplementing active-loaded Rags (RagBGTPγS + RagCXDP) with XTPγS increased the rate of cycling only marginally. Taken together, these results demonstrate that nutrient-dependent Rag cycling can be fully recapitulated on a Ragulator scaffold in vitro without additional factors. Moreover, consistent with the observations in cells, the cycling is largely determined by the nucleotide state of RagA/B (Fig. 3h).
GTP loading of RagA/B increases the off-rate of Rag GTPases and controls mTORC1 residence time
FRAP recovery curves represent the combined contributions of both on-rates and off-rates, so cannot unambiguously reveal the absolute lifetime (off-rate) of protein-protein interactions 30. Moreover, the in vitro FRAP system was not suitable to characterize the interaction of mTORC1 with Rag GTPases due to weak binding of GFP-tagged Raptor (co-purified with mTOR and mLST8) to bead-bound active Rags (Supplementary Fig. 5a). We thus developed an in vitro system that allows direct measurement of single molecule lifetimes. RagB was fused to a Halo tag, which enables covalent labeling with tetramethylrhodamine (TMR) dyes that are sufficiently bright and photostable for single molecule visualization40-42 and imaged via near-Total Internal Reflection Fluorescence (TIRF) microscopy with a relatively shallow angle that captures a significant cross-section of the Ragulator-coated beads (Fig. 4a,b and Supplementary Video 2). Single HaloTMR -Rag heterodimers were imaged with long exposure times (300 ms) to motion-blur freely diffusing (unbound) molecules40-42. Binding events were tracked using single particle-tracking algorithms, displayed as survival probability plots (Fig. 4c,d) and fitted with double exponential functions, in which the fast component likely represents short-lived nonspecific collisions and the slow component reflects Rag-Ragulator binding lifetimes (Supplementary Fig. 5b). Residence times were estimated after correcting the slow component for photobleaching (Fig. 4e).
Figure 4. GTP loading of RagA/B increases the off-rate of Rag GTPases and controls mTORC1 residence time.
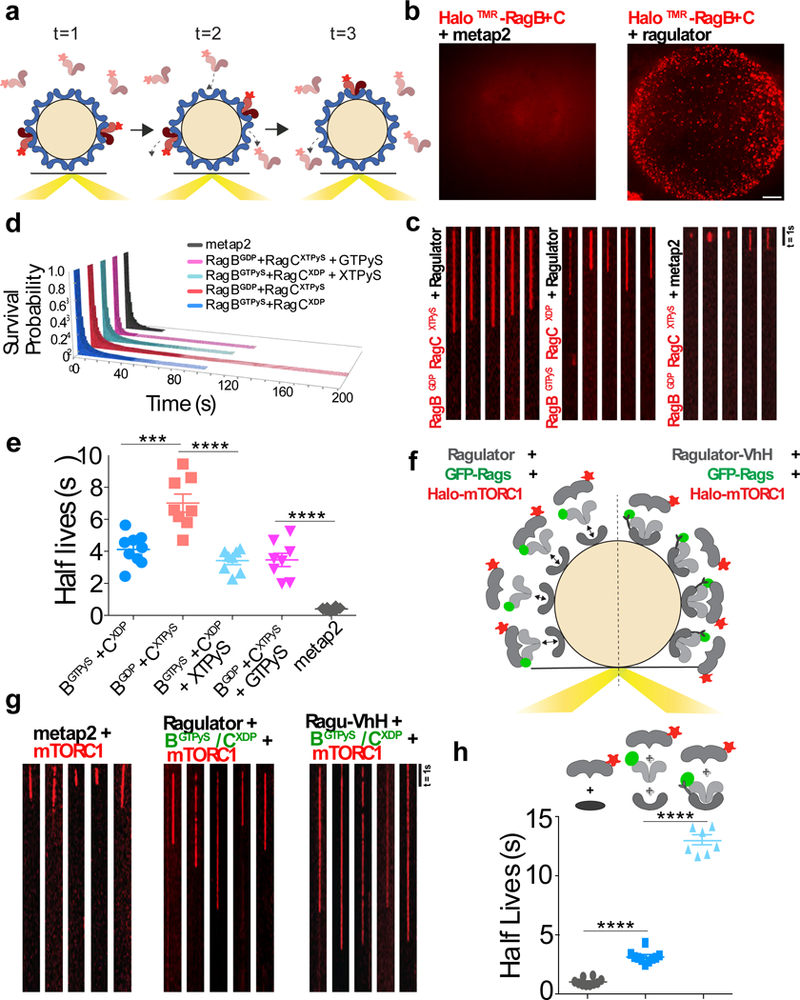
(a)Single molecule in vitro binding assay. Recombinant, Halo-tagged Rag GTPases bound to tetramethylrhodamine (TMR) are combined with Ragulator-coated beads. Binding events are visualized using near-Total Internal Reflection Fluorescence (TIRF). (b) Integrated time-lapse image of HaloTMR-RagB + FLAG-RagC binding to a Ragulator-coated bead (right) or to a Metap2-coated bead (left). Scale bar 10 μm. Experiment performed 1 time. (c) Kymographs of single HaloTMR-RagB + FLAG-RagCX molecules loaded with the indicated guanine and xanthosine nucleotides, binding to Ragulator-coated or to Metap2-coated beads. Scale bar 1s. Experiment repeated 3 times. (d) Survival probability plots of HaloTMR-RagB + FLAG-RagCX molecules loaded with the indicated combination of guanine and xanthosine nucleotides, binding to Ragulator-coated or to Metap2-coated beads. Number of particles: grey N=216, pink N=2464, light blue N=2515, red N=9247, dark blue N=3447. (e) Comparison of the slow t1/2 values, following photobleaching correction, for the residence time of the indicated Rag nucleotide states on Ragulator. Residence times from three biological replicates were pooled, divided into 10 randomly determined sets. Survival probabilities were fitted to single exponentials. Displayed is mean ± S.E.M., for [dark blue N=9, red N=8, light blue N=8, pink N=8, grey N=10] calculated half-lives, *** p=0.0004, **** p<0.0001, two-sided unpaired t-tests. (f) Three-component binding assay. TMR-labeled mTORC1 is combined with Ragulator-coated beads and free, active GFP-tagged Rags (left) or with beads coated with stable Ragulator-VhH + GFP-Rag complexes (right). Binding events are visualized using near-TIRF. (g) Kymographs of single Raptor-HaloTMR-containing mTORC1 complexes binding to Metap2-coated beads (left), Ragulator-coated beads in the presence of excess GFP-tagged Rag GTPases (middle), or beads coated with stable Ragulator-VhH(Ragu-VhH)-GFP-Rag complexes (right). Experiment repeated 3 times. (h) Photobleaching-corrected halflives (t1/2) values for binding of Raptor-HaloTMR molecules to beads coated with Metap2 or with the indicated Ragulator-Rag GTPase combinations. Single molecule residence time data from three biological replicates were pooled and divided into 10 randomly determined sets. Half-lives were calculated from single exponential fits of each set. Displayed is mean ± S.E.M., for [grey N=10, dark blue N=7, light blue N=10] calculated half-lives, **** p<0.0001, two-sided unpaired t-tests. See Supplementary Table 1 for statistical source data.
In agreement with bulk FRAP measurements, inactive-loaded HaloTMR-tagged RagBGDP + RagCXTPγS displayed two-fold longer residence times on Ragulator than active-loaded RagBGTPγS + RagCXDP (7.0 ± 0.5s vs 3.5 ± 0.2s) (Fig. 4e). Furthermore, when GTPγS was added to inactive-loaded Rags, their half-lives decreased to match those of active-loaded Rags, whereas adding XTPγS to active-loaded RagBGTPγS + RagCXDP did not significantly affect the half-life (Fig. 4e). Thus, both FRAP and single molecule analysis support a model in which GTP-loading of RagA/B accelerates their dissociation from Ragulator.
To determine how a destabilized interface between Rags and Ragulator influences mTORC1 residence times, we engineered a three-component single molecule assay (Fig. 4f). The average residence times of Raptor-HaloTMR (co-purified with mTOR and mLST8) on glutathione beads bearing GST-Ragulator pre-incubated with GFP-tagged active-loaded Rag heterodimers was 3.1 ± 0.2 seconds (Fig. 4g,h).
To measure the contribution of Rag-Ragulator dissociation to mTORC1 residence time, we repeated the experiment with p18 fused to VhHGFP, a nanobody that binds to GFP with nanomolar affinity (p18-VhHGFP)43. Due to the high affinity of the VhHGFP- GFP interaction, active GFP-Rag heterodimers were effectively locked to p18-VhHGFP, as shown by FRAP (Supplementary Fig. 5c). Locking the Rags to Ragulator via p18-VhHGFP increased the residence times of mTORC1-HaloTMR molecules four-fold, from 3.1 ± 0.2 to 13.2 ± 0.4 seconds (Fig. 4g,h). Thus, a destabilized Rag-Ragulator interface increases the probability of mTORC1 dissociation from its lysosomal scaffold.
Rag release from Ragulator requires both G-domains
We next dissected the mechanisms through which GTP-loading of RagA/B destabilizes binding to Ragulator. The Rags are each composed of a canonical G-Domain (GD) and a C-Terminal Domain (CTD) that has a roadblock fold44-47. Structural studies show that the Rag CTDs make direct contact with the p14 and MP1 subunits of Ragulator, which also have roadblock folds 48-51. Moreover, by interacting with each other, the CTDs mediate heterodimerization of RagA/B with Rag C/D44, 52.
We engineered GFP-tagged Rag CTD heterodimers (RagBCTD + RagCCTD) and confirmed their binding to each other by co-immunoprecipitation (Supplementary Fig. 6a). When expressed in cells, RagBCTD + RagCCTD localized to lysosomes, as previously shown44 (Supplementary Fig. 6b). In contrast, GFP-tagged G domains of RagB and C (RagBGD + RagCGD) did not heterodimerize when coexpressed, nor localize to lysosomes (Supplementary Fig. 6a and 6b, and Fig. 5a). Heterodimers composed of one full-length Rag and one G domain-deleted Rag (RagBFL + RagCCTD or RagBCTD + CFL) localized to the lysosome (Fig. 5a) and bound to Ragulator on beads, (Fig. 5b). Thus Rag CTDs are necessary and sufficient for Rag binding to lysosomes44.
Figure 5. Both G-domains are required for dynamic Rag GTPase dissociation from Ragulator.
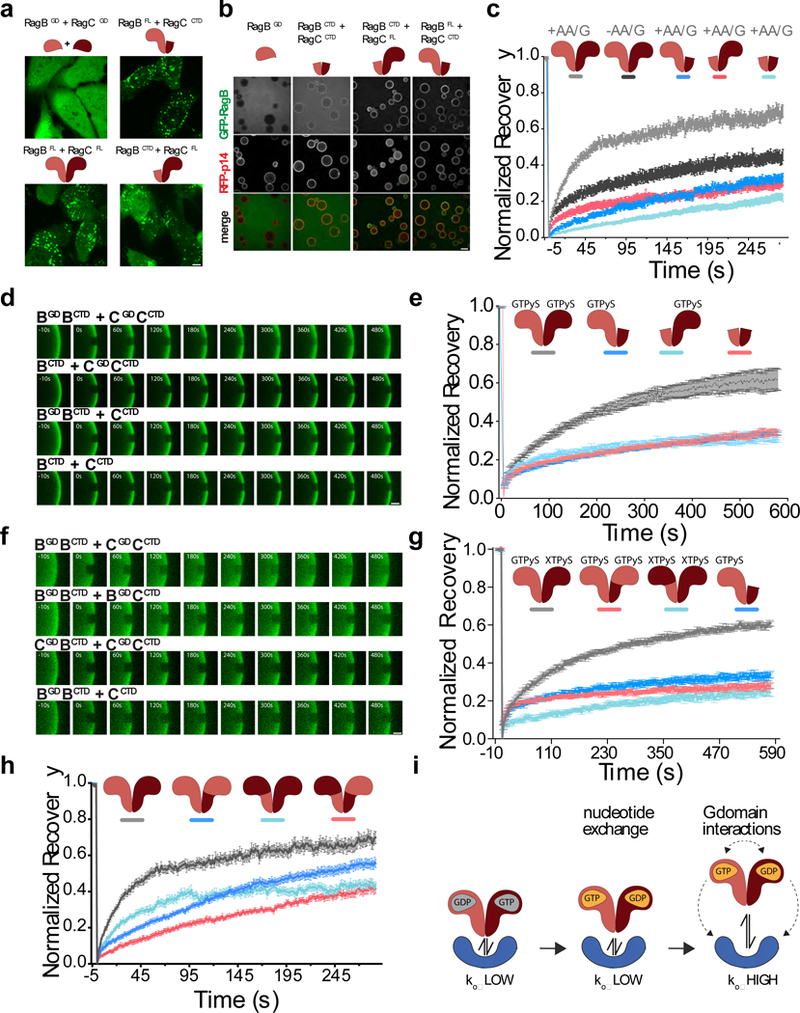
(a)Subcellular localization of the indicated full length or truncated GFP-RagB + FLAG-RagC heterodimers in U2OS cells. Scale bar 10 μm. Experiment repeated 3 times. (b) Equilibrium binding of the indicated full length or truncated GFP-RagB constructs (co-purified with full length or truncated FLAG-RagC, where indicated) to beads coated with GST- and RFP-tagged Ragulator complex. Scale bar 100 μm. Experiment repeated 2 times. (c) Both G-domains are required for dynamic Rag GTPase association to lysosomes. Fluorescence recovery over time curves for nutrient starved (-AA/G) and nutrient restimulated (+AA/G) GFP-tagged Rag GTPase heterodimers as well as indicated truncation constructs. Each curve is the average ± S.E.M. of [light grey N=30, dark grey N=27, dark blue N=24, red N=30, light blue N=30] lysosomes. (d) Two Rag G-domains are required for dynamic binding to Ragulator in vitro. FRAP time-lapse of single ROIs from Ragulator-coated beads incubated with excess GFP-tagged Rag full length and truncation constructs that were loaded with GTPγS. Scale bar 10 μm. (e) Fluorescence Recovery curves for the experiment shown in (d). Each curve is the average ± S.E.M. of [grey N=6, dark blue N=12, red N=11 light blue N=16] bead regions. (f) Chimeric Rag heterodimers containing two of the same G domains release less efficiently from Ragulator than wild-type Rag heterodimers. FRAP time-lapse of single ROIs from Ragulator-coated beads incubated with excess GFP-tagged, wild-type and chimeric Rag heterodimers that were loaded with GTPγS. Scale bar 10 μm. (g) FRAP recovery curves for the experiment shown in (f). Each curve is the average ± S.E.M. of [light grey N=12, dark blue N=12, red N=12, light blue N=14] bead regions. (h) Fluorescence recovery curves from FRAP experiments in U2OS cells expressing the indicated GFP-tagged wildtype and chimera Rag constructs. Each curve is the average ± S.E.M. of [light grey N=23, dark blue N=31, red N=19, light blue N=31] lysosomes. (i) Model displaying how, upon loading of Rag A/B with GTP, the presence of both G-domains is required to destabilize Ragulator-Rag GTPase interaction. See Supplementary Table 1 for statistical source data.
Surprisingly, in nutrient-replete cells both RagBCTD + RagCCTD and the single-G domain RagBFL + RagCCTD and RagBCTD + RagCFL heterodimers exhibited minimal fluorescence recovery, even lower than full-length Rag heterodimers in starved cells (Fig. 5c). Thus, both G-domains are required to induce Rag separation from Ragulator in response to nutrients.
Moreover, absence of the RagC/D G-domain suppressed cycling induced by GTP-loading of the RagA/B G-domain. Consistent with the results in cells, RagBFL-GTPγS + RagCCTD failed to cycle in vitro despite the presence of GTPγS in the G-domain of RagB (Fig. 5d,e and Supplementary Video 3). RagBCTD + RagCFL-GTPγS also showed little FRAP recovery on Ragulator. Thus, lack of RagC G-domain overrides cycling induced by GTP-loading of RagB.
The previous result suggests that the two Rag G-domains must cooperate to trigger active release from Ragulator. To test the requirement for inter-G-domain communication, we constructed chimeras in which the G-domain of RagC was replaced with that of RagB (RagBGDBCTD + RagBGDCCTD) or, conversely, chimeras bearing two RagC G-domains (RagCGDBCTD + RagCGDCCTD). Despite loading with GTPγS, both chimeras were stably bound to Ragulator (Fig. 5f,g). Similarly, RagBGDBCTD + RagBGDCCTD and RagCGDBCTD + RagCGDCCTD chimeras exhibited reduced cycling in nutrient-replete cells (Fig. 5h). Thus, upon GTP loading of RagA/B, the two G-domains cooperate to trigger the release of the CTDs from Ragulator (Fig. 5i).
Cancer-specific Rag mutants override dynamic dissociation from Ragulator and boost mTORC1 lysosomal recruitment
The above data indicate that Rag cycling limits the fraction of lysosome-bound mTORC1. We wondered whether disrupting Rag cycling may contribute to aberrant mTORC1 activation in disease settings. Recently, recurrent mutations in the G-domain of RagC were identified in Follicular Lymphoma (FL)14, 15. These mutations alter the affinity of RagC for guanine nucleotides in vitro, increase RagC binding to Raptor in cells, and render mTORC1 signaling resistant to leucine starvation.
We stably expressed RagC constructs harboring FL hotspot mutations Thr90Asn and Trp115Arg, along with wild-type RagC and the previously characterized, ‘activating’ Ser75Asn, which behaves similarly to Ser75 RagC mutants found in FL 14, 15, 20. All mutants increased lysosomal mTORC1 recruitment compared to wild-type RagC, both in nutrient-starved and replete U2OS cells (Fig. 6a,b). Furthermore, expression of FL RagC mutants increased lysosome-associated Raptor-GFP irrespective of nutrient levels(Supplementary Fig. 6c,d).
Figure 6: Cancer-specific Rag GTPase mutants stabilize mTORC1 at the lysosome by overriding dynamic dissociation from Ragulator.
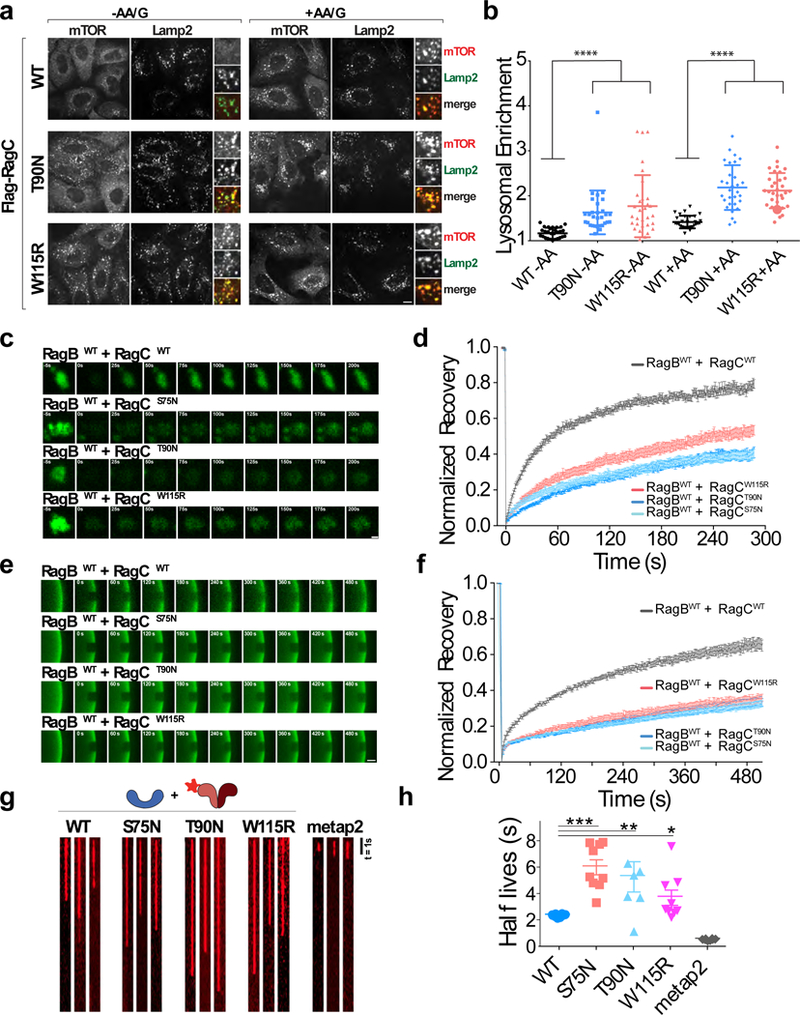
(a)Immunofluorescence images of endogenous mTOR and LAMP2 in U2OS cells stably expressing the indicated wild-type and mutant FLAG-RagC constructs and maintained for 2h in the indicated nutrient conditions. Scale bar 10 μm. (b) Quantitation of mTOR Lysosomal Enrichment Score for immunofluorescence images in (a) (mean ± S.D., [WT -AA N=30, T90N -AA N=30, W115R -AA N=32, WT +AA N=30, T90N +AA N=30, W115R +AA N=33] cells/condition, **** p<.0001, two-sided unpaired t-tests). (c) Time-lapse of fluorescence recovery after photobleaching (FRAP) of single lysosomes in U2OS cells expressing the indicated GFP-tagged Rag GTPase heterodimer containing the indicated RagC mutation. Scale bar 1 μm. (d) Fluorescence recovery over time curves from FRAP experiments in U2OS cells expressing the indicated GFP-tagged Rag GTPase heterodimer. Each curve is the average ± S.E.M. of [WT/WT N=28, WT/S75N N=28, WT/T90N N=28, WT/W115R N=25] lysosomes. (e) FRAP time-lapse of single ROIs from Ragulator-coated beads incubated with excess GFP-tagged Rag heterodimers containing the indicated wild-type and mutant RagC constructs. Scale bar 10 μm. (f) FRAP recovery curves for the experiment shown in (e). Each curve is the average ± S.E.M. of [WT N=12, S75N N=11, T90N N=8, W115R N=12] bead regions. (g) Kymographs of single HaloTMR-RagB co-purfied with the indicated wild-type and mutant FLAG-RagC constructs, binding to Ragulator-coated or to Metap2-coated beads. Scale bar 1s. Experiment repeated 3 times. (h) Photobleach-corrected half-life (t1/2) values for the residence time of the indicated HaloTMR-RagB + FLAG-RagC constructs on Ragulator beads. Metap2 is included as negative control. Single molecule residence time data from three biological replicates were pooled and divided into 10 randomly determined sets. Half-lives were calculated from single exponential fits of each set. Displayed is mean ± S.E.M., for [WT N=10, S75N N=9 T90N N=7, W115R N=9, MetaP2 N=10] calculated half-lives, **** p<0.0001, ** p=0.0074; *p=0.0238, two-sided unpaired t-tests. See Supplementary Table 1 for statistical source data.
We hypothesized that increased recruitment of mTORC1 to the lysosome might be due to altered cycling behavior of the FL RagC mutants. FRAP experiments revealed that FL-mutant containing Rag heterodimers FL RagC mutants were more stably associated with lysosomes than wild-type Rags in nutrient replete U2OS cell (Fig. 6c,d). Similarly, in vitro, FL RagC mutant-containing heterodimers displayed dramatically reduced cycling on Ragulator-coated beads, even when RagB was loaded with GTPγS. (Fig. 6e,f). These results were confirmed at the single molecule level; FL mutant-containing HaloTMR-RagB + FL RagC showed 2 to 3-fold increases in residence time on Ragulator relative to wildtype heterodimers (Fig. 6g,h).
Thus, we propose that the FL RagC mutants lead to increased lysosomal mTORC1 capture in part by stabilizing the Rag-Ragulator interface. Consistent with our results with rapalogue-mediated tethering, stabilized binding of FL-mutant Rags to Ragulator may also prevent mTORC1 dissociation from the lysosome in response to nutrient depletion.
Spatial cycling attenuates mTORC1 signaling activity.
We next investigated how spatial cycling of mTORC1 driven by the Rag GTPases affects mTORC1 signaling activity. Two models are conceivable: mTORC1 accumulation at the lysosome, where its activator Rheb resides, may increase its ability to phosphorylate substrates. Alternatively, spatial cycling may enable mTORC1 to release from the lysosome upon activation and diffuse to phosphorylate its substrates elsewhere.
First we analyzed the effects of expressing FL-RagC mutants, which cause lysosomal accumulation of mTORC1, on its signaling output. Stable expression of the S75N, T90N and W115R mutants boosted S6K1, ULK1 and 4E-BP1 phosphorylation over wild-type RagC expressed at similar levels (Fig. 7a and Supplementary Fig. 6e and 6f). These mutants also conferred resistance to starvation to varying degrees, consistent with previous reports 14, 15.
Figure 7: mTORC1 activation and substrate phosphorylation are highest at the lysosomal surface.
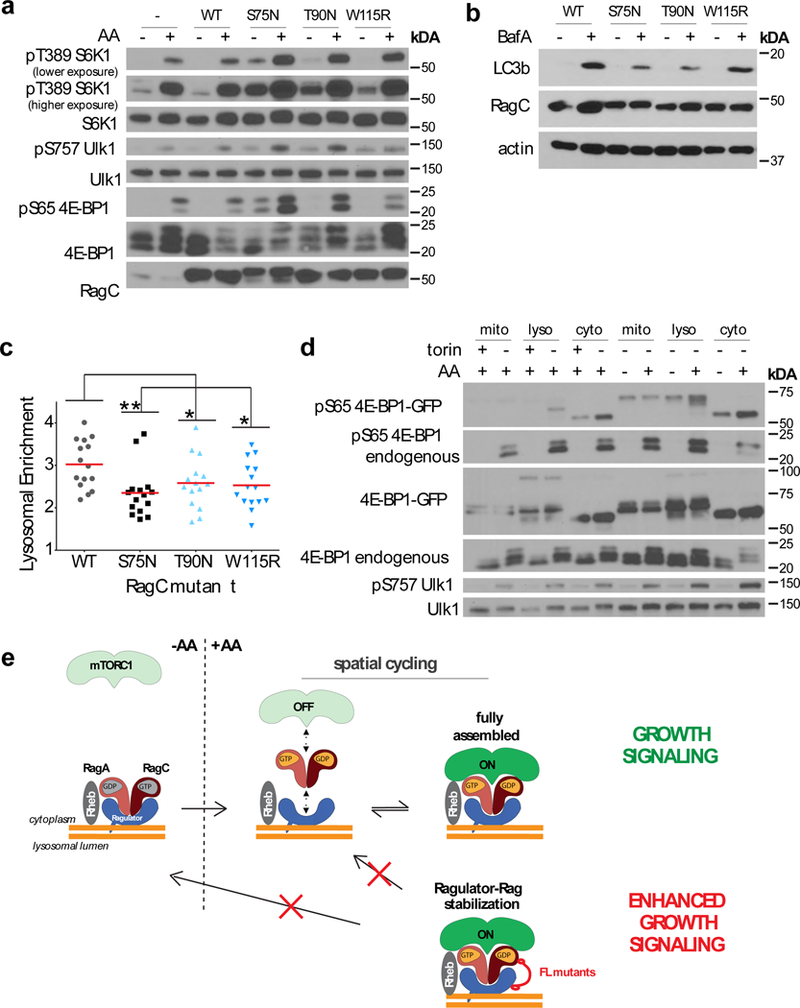
(a)HEK-293T cells stably expressing Flag-RagC harboring the indicated mutations were starved for amino acids for 50 min or starved and restimulated for 10 min, lysed, and immunoblotted for the indicated proteins and phosphor-proteins. Experiment repeated 3 times. Unprocessed scans are shown in Supplementary Fig. 8. (b) HEK-293T cells stably expressing Flag-RagC containing the indicated mutations were treated with vehicle or BafA for 2h, then lysed and immunoblotted for the indicated proteins. Experiment performed 1 time. Unprocessed scans are shown in Supplementary Fig. 8. (c) HEK-293T cells stably expressing Flag-RagC containing the indicated mutations were treated with BafA for 2h, fixed and immunostained for LC3 and LAMP2, then quantitated for the Lysosomal Enrichment Score of LC3 signal at LAMP2-positive lysosomes versus cytoplasmic LC3 signal (mean ± S.D., N = 15 cells/condition, **p = .0036, (T90N) *p = 0.0498, (W115R) *p = 0.0230, two-sided unpaired t-tests). Experiment performed 1 time. (d) HEK-293T cells stably expressing GFP-4E-BP1-OMP25 (mito), GFP-4E-BP1-Rheb15 (lyso) or GFP-4E-BP1-Rheb15-CAAX mutant (cyto) were treated with torin overnight or with torin overnight followed by a 2-hour torin washout (lanes 1-6), or were starved of amino acids for two hours or starved then restimulated for 10 minutes (lanes 7-12), followed by cell lysis and immunoblotting for the indicated proteins and phosphor-proteins. Experiment repeated 2 times. Unprocessed scans are shown in Supplementary Fig. 8. (e) Model for nutrient-induced mTORC1 capture to the lysosome. In low-nutrient states, Rag heterodimers loaded with the inactive nucleotide combinations are stably bound to Ragulator on the lysosomal surface. Nutrients cause the switch of the Rags to the active nucleotide state, while destabilizing Rag interaction with Ragulator. Consequently, both Rag GTPases and mTORC1 undergo spatial cycling, which limits the pool of mTORC1 activated by Rheb at the lysosomal surface. Cancer-specific RagC mutants decrease the off-rate of the Rag-Ragulator interaction and stabilize mTORC1 at the lysosome, resulting in increased signaling. Stabilization of the Rag-Ragulator interaction may also prevent Rag inactivation as nutrient levels decrease, maintaining mTORC1 in a constitutively active state. See Supplementary Table 1 for statistical source data.
In cells stably expressing the FL-RagC mutants autophagic flux, a canonical mTORC1 activity readout, was significantly inhibited over wild type RagC-expressing cells, as shown by decreased accumulation of cleaved LC3b upon Bafilomycin A (BafA) treatment (Fig. 7b). Immunofluorescence-based quantification of LC3b puncta in BafA-treated cells supported this conclusion (Fig. 7c and Supplementary Fig. 7d).
Next, we tested the effect of membranous mTORC1 association with Rheb by fusing Raptor and Rheb to a mitochondrial transmembrane tag (REF) (Supplementary Fig. 7a,b). Co-targeting Raptor and Rheb (but not either protein individually) to mitochondria resulted in both resistance to amino acid withdrawal and enhanced signaling in the presence of amino acids (Supplementary Fig. 7c), supporting the conclusion that mTORC1 does not need to release from a membrane that contains Rheb in order to phosphorylate its substrates.
To compare the ability of mTORC1 to phosphorylate substrates located at the lysosome versus elsewhere, we targeted 4E-BP1 to the mitochondrial surface and compared the efficiency of its phosphorylation by endogenous mTORC1 to that of cytoplasmic and lysosome-anchored 4E-BP1 isoforms. Upon stimulation with amino acids or washout of the mTOR inhibitor, Torin1, mitochondria-anchored 4E-BP1 was not phosphorylated, whereas lysosome-anchored and cytoplasmic 4E-BP1 proteins were efficiently phosphorylated (Fig. 7d). Taken together, our results suggest that mTORC1 efficiently phosphorylate substrates when localized to a rheb-containing membrane, and that efficiency is reduced at locations distal to rheb-containing membranes. We hence propose that release of mTORC1 from the lysosomal surface by Rag cycling serves to attenuate mTORC1 activity.
DISCUSSION
Our results reveal a nutrient-activated mechanism that modulates Rag-Ragulator affinity and ultimately limits mTORC1 lysosomal recruitment and activity. Specifically, as nutrients activate a Rag-mTORC1 binding interface, they also cause the Rag-Ragulator binding interface to become destabilized, leading to mTORC1 release and inactivation (Fig. 7e).
This feature places the Rags in a distinct category from most signaling GTPases, which rely on feed-forward mechanisms to recruit their effectors to membranes. For example, a pioneer pool of activated Rab5 molecules activate the Rab5 GEF, Rabex, leading to increased Rab5 activation and establishment of patches of amplified effector recruitment and activity on endosomal membranes53-55. Ras activation proceeds similarly 56, 57. In contrast, rather than evolving to maximize effector recruitment, Rag activation is tuned to oppose hyperaccumulation and activation of mTORC1 on the lysosomal membrane. Accordingly, RagC mutations found in follicular lymphoma override this attenuator mechanism, at least in part, by stabilizing Rag binding to Ragulator and suppressing Rag spatial cycling.
Recent structural work provides hints of possible mechanisms for Rag GTPase release from Ragulator. Rag-Ragulator structures indicate that a primary interacting surface is provided by the Rag CTDs binding to the Lamtor2-3 (p14-MP1) dimer 48-51. In addition, Lamtor1/p18, which wraps around the Ragulator ordered core, contributes additional binding elements that stabilize the Ragulator-Rag interaction 48-51. It is conceivable that displacement of one or more of these elements upon GTP loading of RagA/B may weaken the interaction and trigger Rag cycling.
A conformational change initiated by the G-domains may destabilize binding of the CTDs to Ragulator. Structural studies of the yeast Rag homologues, Gtr1 and 2, suggest that the two G-domains come into increased contact with one another in the active conformation, in which Gtr1 (the RagA/B homolog) is GTP-loaded and Gtr2 (the RagC/D homolog) is GDP-loaded44, 52. Homology modeling and EM density fitting of human Rags is also consistent with inter-G domain communication 49. Furthermore, a recent report suggests that inter-G domain communication may help to rapidly switch the Rags between active and inactive states, while minimizing the intermediate double-GTP and double-GDP states 58. It remains to be determined how the FL-associated RagC mutants could override this mechanism.
Where in the cell mTORC1 encounters its substrates has been an active area of investigation 7, 10, 28, 59-62. While our data cannot rule out that a subset of mTORC1 molecules may retain activity as they diffuse in the cytoplasm, direct comparison of membrane-immobilized and freely diffusing 4E-BP1 indicates that most of the kinase activity occurs at the lysosomal membrane, where mTORC1 may directly contact Rheb. Recent structural work supports this model by demonstrating that Rheb activates mTORC1 by physically binding to it and allosterically displacing an auto-inhibitory intramolecular interaction (‘FAT-clamp’) that would otherwise prevent substrate phosphorylation 12.
Based on these considerations, a likely function of Rag spatial cycling is to attenuate mTORC1 signaling by decreasing the amount of time that mTORC1 spends in direct contact with Rheb at the lysosomal surface. Consistently, expression of FL-associated RagC mutants, which stabilize both the Rag-Ragulator and the Rag-Raptor interfaces 14, 15, results in increased lysosomal mTORC1 recruitment and enhanced substrate phosphorylation.
Future studies will determine how other components of the mTORC1-scaffolding machinery may modulate the stability of the Rag-Ragulator interface 4, 24, 63-66. Furthermore, additional mutations recently identified in human cancers, such as those targeting the mTOR gene67, 68, could affect signaling outputs by altering the lifetime of these scaffolding interactions.
Methods
Cell lines and Culture Conditions
Biochemical experiments were performed in HEK293T human-derived cell lines. Live imaging experiments were performed in the U2OS, UOK257-1, UOK257-2, SW780, and SW780-1 human-derived cell lines. Immunofluorescence experiments were performed in HEK293T, HAP-1 Raptor:GFP, and U2OS cell lines. Purified proteins in Visual IP assay were purified from adherent HEK293T human tissue culture cells. HEK293T, UOK257-1, and UOK257-2 cells were cultured in DMEM (Thermo Fisher) supplemented with 10 % FBS + 5 % penicillin-streptomycin at 37°C and 5% CO2. SW780-1 and SW780-2 cell lines were cultured in IMDM (Thermo Fisher) supplemented 10% FBS and 5% penicillin-streptomycin at 37°C and 5% CO2. U2OS cells were cultured in McCoy’s 5A media (GE Healthcare) lacking phenol red supplemented with 5% FBS and 5% penicillin-streptomycin at 37°C and 5% CO2. HAP-1 Raptor:GFP cell lines were cultured in IMDM (Thermo Fisher) supplemented 10% FBS and 5% penicillin-streptomycin at 37°C and 5% CO2.
Microscopy
All images were collected on a Nikon Ti-E inverted microscope (Nikon Instruments, Melville, NY) equipped with a Plan Apo 40x Air/1.21, 60x or 100x/1.49 Oil objective, and a Perfect Focus System. All live imaging was acquired using an electron-multiplying charge-coupled device camera (iXon ULTRA 897BV; Andor Technology). All immunofluorescence imaging was acquired using a Zyla 5.5 sCMOS camera (Andor Technology). All data was acquired using iQ3 acquisition software (Andor Technology).
Immunofluorescence
HEK-293T or HAP-1 cells were plated on fibronectin-coated glass coverslips in 6-well plates (35mm diameter/well), at 300,000-500,000 cells/well. U2OS were plated directly onto glass coverslips in 6- well plates at 150,000 cells/well. 12-16 hours later, cells were subjected to amino acid depletion/restimulation (see below) and fixed in 4% paraformaldehyde (in PBS) for 15 min at RT. The coverslips were rinsed twice with PBS and cells were permeabilized with 0.1% (w/v) saponin in PBS for 10 min. After rinsing twice with PBS, the slides were incubated with primary antibody in 5% normal donkey serum for 1 hour at room temperature, rinsed four times with PBS, and incubated with fluorophore-conjugated secondary antibodies produced in goat or donkey (Life Technologies, diluted 1:1000 in 5% normal donkey serum) for 45 min at room temperature in the dark, washed four times with PBS. Coverslips were mounted on glass slides using Vectashield and imaged on a spinning disk confocal system as indicated above.
For antibody information see Supplementary Table 2.
Acquisition of Z-stacks for 3D Colocalization
U2OS or HAP-1 Raptor:GFP cells were fixed and stained for mTOR/LAMP2 (U2OS) or LAMP2 (HAP-1), and mounted in media containing DAPI stain for nuclei. At least 8 Z-stacks containing at least 4 U2OS cells or at least 10 HAP-1 cells were acquired covering a 8-10 μm range (depending on cell volume) acquired at 0.33 μm intervals for U2OS an 0.5 μm intervals for HAP-1 cells.
Nucleofection of U2OS and SW780 cells for Live Imaging
For each condition, 1.2 million U2OS or SW780 cells were combined with 350 ng DNA for fluorescently labeled complex components and 700 ng DNA for non-fluorescently labeled components and transfected using a Lonza Nucleofector T-2b machine, resuspended using Nucleofector Kit R and pulsed with protocol X-001. Each transfection was divided and plated onto two chambered culture dishes with a glass coverslip bottom. Cells were treated and imaged the following day.
Fluorescence Recovery After Photobleaching
Fluorescence Recovery After Photobleaching (FRAP) experiments were performed on U2OS cells nucleofected with desired constructs as described above one day prior to imaging. For forty minutes prior to the experiment, U2OS cells were incubated in imaging buffer (10 mM HEPES, 136 mM NaCl, 2.5 mM KCl, 2 mM CaCl2, 1.2 mM MgCl2, pH 7.4) supplemented with 5 mM glucose, 1% dialysed FBS (dFBS), and amino acids (Sancak et al., 2008), 2.5 μg/mL nocodazole, and the indicated concentration A/C rapalog if indicated, for forty minutes. FRAP movies for nutrient depleted conditions were acquired in imaging buffer lacking supplemented nutrients. FRAP movies were acquired by taking five frames at one second intervals, applying a photobleach calibrated to bleach lysosome to background fluorescence levels using a dual galvanometer laser beam delivery system (Andor FRAPPA), then acquiring images at one second intervals for five minutes.
Live Cell Treatments
HEK293T and HAP-1 cells were plated in culture dishes or on glass coverslips and rinsed and incubated in amino acid-free RPMI for 50 minutes and restimulated with a 10X solution of amino acids or leucine for 10 minutes. Amino acid solutions were prepared from powders and the final concentration of amino acids in the media was the same as in commercial RPMI. For A/C rapalog (rapa) treatments, cells were pre-incubated for 20 minutes in complete media with 5 nM A/C rapalog for signaling experiments and 50 nM A/C rapalog for immunofluorescence experiments. Cells were then starved as above with the amino acid-free RPMI supplemented with 5 nM or 50 nM rapalog for signaling and immunofluorescence experiments, respectively. U2OS and SW780 cells were treated as above except that starvation media lacked glucose and was supplemented with 5% dialyzed Fetal Bovine Serum (dFBS), and the starvation duration was two hours while the restimulation duration was 30 min. Nutrient starvation treatments were adjusted based on determining conditions that maximally disperse mTORC1 from lysosomes in each cell type. Torin treatments of 293T cells were applied as overnight (16 hour) treatment in 250 nM Torin in standard culture media, followed by washout (2 media replacements) with standard culture media. Bafilomycin treatments of 293T cells were applied as 2 hour treatments with 100 nM bafilomycin.
Visual IP Sample Preparation
HEK293T cells were plated on 15 cm plates at 10 million cells per plate. 24 hours later, the cells were transfected using 500 uL OptiMEM transfection media, 60 uL polyethyleneimine (PEI, Sigma) and 10 ug total DNA. The transfection mix was incubated for 15 minutes and then added directly to the cell media. 48 hours later, the media was removed, and the cells were washed three times with PBS. The cells were scraped from the plate and collected in 10 mL PBS. The samples were centrifuged for 5 minutes at 1500g at 4°C. The cell pellets were then resuspended in 1 mL Triton lysis buffer (1% Triton X-100, 130 mM NaCl, 2mM EGTA, 2.5 mM MgCl2, 25 mM HEPES, pH 7.4, 10% glycerol, protease inhibitor (Pierce)), and allowed to rotate at 4°C for 20 minutes. The samples were then centrifuged at 13000g for 2 minutes, and the supernatant was separated for immunoprecipitation. 50 uL of washed anti-FLAG affinity beads (Sigma) were added to the supernatant and the sample was rotated at 4°C for 2 hours. After immunoprecipitation, the samples were washed twice in Triton lysis buffer, once in high salt (500 mM NaCl) lyso sucrose buffer, and once in normal salt lyso sucrose buffer (250 mM sucrose, 10 mM KCl, 2 mM EGTA, 2.5 mM MgCl2, 25 mM HEPES, pH 7.4, 10% glycerol, protease inhibitor (Pierce)). Each wash consisted of rotating with the wash buffer for 5 minutes at 4°C and subsequent centrifugation at 2000g for 1 minute. For elution off FLAG beads, 3x- FLAG peptide in Phosphate Buffered Saline (PBS) was added to the sample, [RL2] and the sample was allowed to rotate overnight at 4°C. The sample was then centrifuged at 3000g for 3 minutes and the proteins used for subsequent experiments were present in the supernatant fraction.
Cytosol Preparation
HEK293T cells were grown to confluence on 15 cm plates. The media was removed, and the cells were washed three times with PBS. The samples were centrifuged for 5 minutes at 1500g at 4°C, and the pellet was resuspended in 500 uL lyso sucrose buffer (250 mM sucrose, 10 mM KCl, 2 mM EGTA, 2.5 mM MgCl2, 25 mM HEPES, pH 7.4, 10% glycerol, protease inhibitor (Pierce)). The resuspended cells were passaged through a 25g needle syringe three times, and then centrifuged for 10 minutes at 2700g at 4°C. The supernatant was extracted and further centrifuged for 2 minutes at 13000g at 4°C; the supernatant fraction of the final centrifugation step was the cytosol fraction.
Rag GTPase Nucleotide Loading
For nucleotide loading of Rag GTPases that are bound to affinity beads, EDTA was added to lyso buffer to a concentration of 20 mM and beads were allowed to rotate for 1 hour at 4°C. The sample was washed in lyso sucrose buffer twice and the corresponding nucleotides for loading (XTPγS/XDP/GTPγS/GDP) were added to a final concentration of 25 uM each. The sample was allowed to rotate for 30 minutes at 4°C. MgCl2 was added to the sample to a final concentration of 50 mM, and the sample was rotated for 1 hour at 4°C. The sample was washed twice before use in subsequent experiments. If the Rag GTPases were used as the soluble partner in the assay, they were eluted in 0.5 mg/mL 3x-Flag peptide.
Visual IP FRAP
Samples were assembled with 10 uL bead suspension with bound protein 1, 15 uL cytosol preparation, 20 uL lyso sucrose buffer, and 3 uL FLAG elution of protein 2. Ragulator and Rags were incubated at room temperature for 15 minutes. 20 uL of the sample was mounted onto a glass slide, and the coverslip was sealed with nail polish. FRAP movies were acquired by taking five frames at two second intervals, applying photobleach using a dual galvanometer laser beam delivery system (Andor FRAPPA), and then imaging at two second intervals for 10 minutes.
Visual IP Single-Molecule
For single-molecule experiments, samples were prepared as previously described with minor adjustments. Expressed Halo-tagged proteins were tagged in cells directly by adding tetramethylrhodamine (TMR) ligand to the media at a final concentration of 1 nM, and incubated for 15 minutes at 37°C. After protein purification, samples were assembled with 20 uL bead suspension with bound protein 1, 20 uL cytosol preparation, 5 uL FLAG elution of protein 2, 20 uL 5x concentration lyso sucrose buffer, 35 uL Trolox/dextrose solution (10 mg/mL Trolox, and 0.8% w/v D- glucose), and 1 uL glucose oxidase/catalase solution (34 U/uL glucose oxidase, 520 U/uL catalase in 50 mM Tris, pH 8). The samples were imaged using near-TIRF and images were acquired using 300 msec exposures, at 1 second intervals for 15 minutes.
Lentiviral infection
Lentivirus was generated using the Calcium Phosphate packaging method. Briefly, 20 ug of a lentiviral vector (desired construct in pLJM1-PURO) was combined with 15 ug of psPax2 and 5 ug VSVG viral packaging plasmids in 500 uL ddH2O supplemented with a final concentration of 500 uM CaCl2, pH 7. This DNA solution was combined dropwise with 500 uL HEBS buffer (280 mM NaCl, 50 mM HEPES, 1.5 mM Na2PO4, pH 7) while maintaining bubbles in the HEBS buffer during DNA addition. This solution was incubated at room temperature for 15 minutes, then added to a 10 cm dish containing 7 million recently plated 293T cells. 16 hours later, media was exchanged for Complete Media. 24 hours after that, media containing virus was collected from cells, spun down at 1300 x g for 5 minutes to remove cell debris, and then concentrated using Lenti-X Concentrator (Takara) and resuspended in 500 uL of complete media per 10 cm dish. For FRB-FKBP experiments, 20 uL of TMEM192-Flag-FKBP or TMEM192-Flag concentrated virus was co-infected with 5 uL of FRB-myc-RagA or FRB-myc-RagC frozen virus on day 1. For Raptor:GFP + F.L. RagC mutant experiments, 5 uL of Raptor:GFP frozen virus was co-infected with 10 uL of the corresponding Flag-RagC frozen virus. On day 2, media was replaced with media containing 1 ng/mL Puromycin. On day 3 cells were plated onto fibronectin-coated coverslips or split into multiple wells of a 6-well plate for signaling experiments.
Cell lysis, Immunoprecipitation, and Western Blot
HEK-293T cells stably expressing FLAG-tagged and myc-tagged proteins were lysed in ice- cold lysis buffer (150mM NaCl, 20 mM HEPES [pH 7.4], 2 mM EDTA, 0.3% CHAPS or 1% Triton X-100, and one tablet of EDTA-free protease inhibitors per 50 ml). Cell lysates were cleared by centrifugation at 13,000 rpm for 10 minutes in a microfuge. For immunoprecipitations, 30 μl of a 50% slurry of anti-FLAG affinity gel (Sigma) were added to each lysate and incubated with rotation for 2-3 hours at 4°C. Immunoprecipitates were washed three times with lysis buffer. Immunoprecipitated proteins were denatured by the addition of 50 μl of sample urea buffer and heating to 37°C for 15 minutes. For western blots without immunoprecipitation, samples were normalized to a total concentration of 1 mg/mL protein and combined with protein sample buffer, then boiled for 5 minutes at 95C. Samples were loaded onto 10% or 12% SDS-Page gels, and analyzed by immunoblotting.
For antibody information see Supplementary Table 2.
Cell Fractionation
Confluent HEK-293T cells stably expressing FLAG-Raptor or FLAG-Raptor-Rheb15, plated in 2×15cm dishes, were rinsed once in cold PBS, then scraped, spun down and resuspended in 750ul of fractionation buffer: 140mM KCl, 1mM EGTA, 2.5mM MgCl2, 50mM Sucrose, 20mM HEPES, pH 7.4, supplemented with protease inhibitors. Cells were mechanically broken by spraying 4-5 times through a 23G needle attached to a 1ml syringe, then spun down at 2000g for 10min, yielding a post nuclear supernatant (PNS). The PNS was further spun at max speed for 15 min in a tabletop refrigerated centrifuge, thus separating the cytosol (the supernatant) from the light organellar fraction (the pellet), which contains the FLAG-Raptor or FLAG-Raptor-Rheb15-expressing lysosome. The light organelle fraction was resuspended in 50/50 Laemmli/fractionation buffer, bringing it to an equal volume to the Laemmli-supplemented cytosol. Equal volumes of each fraction were gel-loaded and subjected to immunoblotting. For antibody information see Supplementary Table 2.
Quantitation of FRAP data
FRAP data analysis was performed using custom-built MATLAB (Mathworks) scripts modified from those written by Lana Bosanac of the Xavier Darzacq lab (Knight et al., Science, 2016). Lysosomes that did not move substantially within the five minute movie were manually selected. Data was bleach corrected on a cell-by-cell basis by normalizing lysosomal intensities to the total cellular intensity. The contribution of diffusion of GFP-tagged molecules into the FRAPPed region was corrected for by FRAPPing several non-lysosomal spots of equal area and directly substracting the mean intensities of FRAPPed non-lysosomal areas from the FRAPPed lysosomal area. Bleach-corrected and photobleach-corrected recovery curves were assigned Normalized Intensity values based on a linear 0 to 1 scale between the post-bleach and the mean of 5 pre-bleach values, respectively. For each condition, between twenty and thirty individual FRAP traces from lysosomes from at least three different movies and five different cells were averaged and reported as a mean value with error bars representing Standard Error of the Mean (S.E.M.). Bleach- and diffusion-corrected FRAP curves were fitted using a single-component exponential.
Quantitation of Single-Molecule Assays
Single-molecule data was analyzed using a home-built MATLAB (Mathworks) script that localizes single molecule binding events by automatically determining local maxima, and tracks particles through the entire time lapse. Single-molecule binding events from three imaging experiments were pooled together. Ten sets of residence times were generated by randomly selecting ten percent of total binding events from the original pool. Each set was fitted with a double exponential binding curve, and the slow components were used for calculation of photobleach-corrected half-lives. Individual slow kinetic components were corrected for photobleaching using the formula kactual = kempirical - kphotobleaching. kphotobleaching was determined by fitting taking the mean value of the slow component from 2-component exponential fits of 10 Halo-GST survival probability plots prepared from 10 randomly generated subsets of residence times, as above. Half lives were calculated using t1/2 = ln2/k, and mean values and Standard Error of the Mean (S.E.M.) were calculated.
3D Quantitation of mTORC1 lysosomal localization (fraction lysosomal mTOR)
3-channel Z-stacks were processed using Imaris software (Bitplane, Oxford Instruments). First, total cell voxels were segmented using the inbuilt “cell segmentation” algorithm, using the DAPI channel to detect nuclei and building out total cell volume using the mTOR or Raptor:GFP channel for U2OS and HAP-1 cells, respectively. The mTOR or Raptor:GFP channel was masked to exclude extracellular voxels. Total cellular intensity and total cellular volume (in voxels) was exported. Next, lysosomes were detected using the inbuilt “surfaces” algorithm,: the LAMP2 channel was masked to exclude voxels outside of the segmented lysosome surface, and filtered to remove objects that were smaller than 5 voxels. Total lysosomal intensity and total lysosomal volume (in voxels) measurements were exported. Finally, a control volume was generated manually in the mTOR or Raptor:GFP channel in a volume that did not include cells. The mTOR or Raptor:GFP channels were masked to exclude voxels outside of the control surface. Total control intensity and total control volume (in voxels) was exported. For both U2OS and HAP-1 cells, the LAMP2 channel was segmented three times to exclude voxels outside of the total cell volume, lysosome volume, and control volumes created above. Total intensity and volume (in voxels) measurements were exported for the corresponding LAMP2 channels.
The percent of mTOR or Raptor:GFP signal that colocalized with lysosomes was determined using intensity and voxel values measured in the mTORC1 or LAMP2 channel. Lysosomal Intensities and Totalcell Intensities were corrected for background by subtracting the total background intensity predicted for the corresponding volume based on the mean voxel intensity of the control region as follows:
Background-Corrected Lysosomal Intensity = Lysosomal Intensity - (Control Intensity/Control Volume) * Lysosomal Volume
Background-Corrected Totalcell intensity = Totalcell Intensity - (Control Intensity/Control Volume) * Totalcell Volume
The Raw Percent Lysosomal Intensity was calculated:
Raw Percent Lysosomal Intensity = (Background-Corrected Lysosomal Intensity) / (Background- Corrected Totalcell Intensity)
The same calculations were performed for the LAMP2 channel to determine the Percent Lysosomal Intensity for LAMP2. LAMP2 is a transmembrane protein and is a marker for the expected value of a 100% lysosome-localized protein. We normalized all Background-Corrected Percent Lysosomal Intensity values and Background-Corrected Percent Lysosomal Intensity values to the corresponding mean LAMP2 Background-Corrected Percent Lysosomal Intensity value by performing the following operation:
Normalized mTORC1 Percent Lysosomal Intensity = (Raw mTORC1 Lysosomal Intensity) / (Raw Lamp2 Lysosomal Intensity)
These values are reported as “% lysosomal signal” in Figure 1a.
Quantitation of 2D Immunofluorescence data for Lysosomal Enrichment Score
For immunofluorescence datasets in which images were acquired for both LAMP2 stain (mouse) and mTOR, RagA, RagC, p18, mp1, or LC3 stain, a home-built Matlab script was used to determine the lysosomal enrichment of the non-Lamp stain. First, a single cell was manually selected in the lamp channel. The nucleus was also manually selected and excluded from further analysis. Then, an Otsu- based thresholding algorithm was applied to automatically segment cellular pixels into LAMP2 (lysosomal) or non-LAMP2 (cytosolic) pixels. This mask generated in the LAMP2 channel was then applied to the non-LAMP2 channel. The average intensity of pixels in the lysosomal region was determined (mean lysosomal intensity), as was the average intensity of the pixels in the cytosolic region (mean cytosolic intensity). The Lysosomal Enrichment Score was determined by dividing the mean lysosomal intensity by the cytosolic lysosomal intensity. For each condition, at least twenty cells were analyzed from at least three different multi-channel images.
2D Lyso:cyto ratio quantitation
For 2-dimensional immunofluorescence images of cells coexpressing Raptor:GFP along with Flag- tagged Rag GTPases, a lysosomal:cytosolic fluorescence ratio was calculated to assess the level of Raptor:GFP enrichment on lysosomes in different conditions. The lysosomal area was manually selected in ImageJ, and the mean lysosomal intensity was determined by determining the mean intensity of pixels in this region. The mean cytosolic intensity was then calculated in an identically shaped region adjacent to the lysosome. Finally, the “lyso:cyto ratio” was determined by dividing the mean lysosomal intensity by the mean cytosolic intensity. For each condition, at least 30 individual measurements were made in at least five different cells.
Statistics and Reproducibility
Unpaired, parametric student’s t-tests were performed using Prism (Graphpad) to analyze significant variation in Lysosomal Enrichment Scores and Lyso:Cyto Ratio Scores. Except in the case of single molecule residence time data (described in detail above), one representative biological replicate of an experiment is presented in figure panels. All experiments were performed three or more times independently under identical or similar conditions, except experiments shown in Figures 1f, 2a-b,f, 5d-h, 6a-b 7d, S1b-d, S4a-c, S5c, S6b-d, and S7a-b which were performed twice, and experiments in Figures 1a-b, 4b, 7b-c, S6a, and S7d which were performed once.
Supplementary Material
ACKNOWLEDGEMENTS
We thank all members of the Zoncu Lab for helpful insights; Michael Rape and Rushika Perera for critical reading of the manuscript; Anders Hansen and Xavier Darzacq for assistance with analysis of single molecule datasets; Spencer Knight and Lana Bosanac for assistance with FRAP analysis software, Hernan Garcia for insights on co-localization analysis. This work was supported by the NIH Director’s New Innovator Award (1DP2CA195761-01), the Pew-Stewart Scholarship for Cancer Research, the Damon Runyon-Rachleff Innovation Award, the Edward Mallinckrodt, Jr. Foundation Grant and the Packer Wentz Endowment to R.Z., a National Science Foundation Graduate Research Fellowship (DGE 1106400) to R.E.L.
Footnotes
Reagents List
Information regarding all reagents used is provided in Supplementary Table 3.
Code availability
Custom MATLAB scripts (written for FRAP analysis, single molecule detection, and Lysosomal Enrichment Scores) may be directed to, and will be fulfilled by, the corresponding author, Roberto Zoncu.
Data availability
All data supporting the findings of this study are available from the corresponding author on request. Statistical source data for Figures 1-7 and Supplementary Figures 2, 4, 5, and 6 are found in Supplementary Table 1.
COMPETING FINANCIAL INTERESTS
The authors declare no competing financial interests.
REFERENCES
- 1.Perera RM & Zoncu R The Lysosome as a Regulatory Hub. Annual review of cell and developmental biology 32, 223–253 (2016). [DOI] [PMC free article] [PubMed] [Google Scholar]
- 2.Saxton RA & Sabatini DM mTOR Signaling in Growth, Metabolism, and Disease. Cell 169, 361–371 (2017). [DOI] [PubMed] [Google Scholar]
- 3.Binda M et al. The Vam6 GEF controls TORC1 by activating the EGO complex. Mol Cell 35, 563–573 (2009). [DOI] [PubMed] [Google Scholar]
- 4.Castellano BM et al. Lysosomal cholesterol activates mTORC1 via an SLC38A9-Niemann-Pick C1 signaling complex. Science 355, 1306–1311 (2017). [DOI] [PMC free article] [PubMed] [Google Scholar]
- 5.Efeyan A et al. Regulation of mTORC1 by the Rag GTPases is necessary for neonatal autophagy and survival. Nature 493, 679–683 (2013). [DOI] [PMC free article] [PubMed] [Google Scholar]
- 6.Kim E, Goraksha-Hicks P, Li L, Neufeld TP & Guan KL Regulation of TORC1 by Rag GTPases in nutrient response. Nature cell biology 10, 935–945 (2008). [DOI] [PMC free article] [PubMed] [Google Scholar]
- 7.Sancak Y et al. Ragulator-Rag complex targets mTORC1 to the lysosomal surface and is necessary for its activation by amino acids. Cell 141, 290–303 (2010). [DOI] [PMC free article] [PubMed] [Google Scholar]
- 8.Sancak Y et al. The Rag GTPases bind raptor and mediate amino acid signaling to mTORC1. Science 320, 1496–1501 (2008). [DOI] [PMC free article] [PubMed] [Google Scholar]
- 9.Demetriades C, Doumpas N & Teleman AA Regulation of TORC1 in response to amino acid starvation via lysosomal recruitment of TSC2. Cell 156, 786–799 (2014). [DOI] [PMC free article] [PubMed] [Google Scholar]
- 10.Menon S et al. Spatial control of the TSC complex integrates insulin and nutrient regulation of mTORC1 at the lysosome. Cell 156, 771–785 (2014). [DOI] [PMC free article] [PubMed] [Google Scholar]
- 11.Pacold ME et al. Crystal structure and functional analysis of Ras binding to its effector phosphoinositide 3-kinase gamma. Cell 103, 931–943 (2000). [DOI] [PubMed] [Google Scholar]
- 12.Yang H et al. Mechanisms of mTORC1 activation by RHEB and inhibition by PRAS40. Nature (2017). [DOI] [PMC free article] [PubMed] [Google Scholar]
- 13.Bar-Peled L et al. A Tumor suppressor complex with GAP activity for the Rag GTPases that signal amino acid sufficiency to mTORC1. Science 340, 1100–1106 (2013). [DOI] [PMC free article] [PubMed] [Google Scholar]
- 14.Okosun J et al. Recurrent mTORC1-activating RRAGC mutations in follicular lymphoma. Nature genetics 48, 183–188 (2016). [DOI] [PMC free article] [PubMed] [Google Scholar]
- 15.Ying ZX et al. Recurrent Mutations in the MTOR Regulator RRAGC in Follicular Lymphoma. Clin Cancer Res 22, 5383–5393 (2016). [DOI] [PMC free article] [PubMed] [Google Scholar]
- 16.Bar-Peled L, Schweitzer LD, Zoncu R & Sabatini DM Ragulator is a GEF for the rag GTPases that signal amino acid levels to mTORC1. Cell 150, 1196–1208 (2012). [DOI] [PMC free article] [PubMed] [Google Scholar]
- 17.Panchaud N, Peli-Gulli MP & De Virgilio C Amino acid deprivation inhibits TORC1 through a GTPase-activating protein complex for the Rag family GTPase Gtr1. Science signaling 6, ra42 (2013). [DOI] [PubMed] [Google Scholar]
- 18.Peli-Gulli MP, Sardu A, Panchaud N, Raucci S & De Virgilio C Amino Acids Stimulate TORC1 through Lst4-Lst7, a GTPase-Activating Protein Complex for the Rag Family GTPase Gtr2. Cell reports 13, 1–7 (2015). [DOI] [PubMed] [Google Scholar]
- 19.Petit CS, Roczniak-Ferguson A & Ferguson SM Recruitment of folliculin to lysosomes supports the amino acid-dependent activation of Rag GTPases. J Cell Biol 202, 1107–1122 (2013). [DOI] [PMC free article] [PubMed] [Google Scholar]
- 20.Tsun ZY et al. The Folliculin Tumor Suppressor Is a GAP for the RagC/D GTPases That Signal Amino Acid Levels to mTORC1. Mol Cell (2013). [DOI] [PMC free article] [PubMed] [Google Scholar]
- 21.Chantranupong L et al. The CASTOR Proteins Are Arginine Sensors for the mTORC1 Pathway. Cell 165, 153–164 (2016). [DOI] [PMC free article] [PubMed] [Google Scholar]
- 22.Rebsamen M et al. SLC38A9 is a component of the lysosomal amino acid sensing machinery that controls mTORC1. Nature 519, 477–481 (2015). [DOI] [PMC free article] [PubMed] [Google Scholar]
- 23.Saxton RA, Chantranupong L, Knockenhauer KE, Schwartz TU & Sabatini DM Mechanism of arginine sensing by CASTOR1 upstream of mTORC1. Nature 536, 229–233 (2016). [DOI] [PMC free article] [PubMed] [Google Scholar]
- 24.Wang S et al. Metabolism. Lysosomal amino acid transporter SLC38A9 signals arginine sufficiency to mTORC1. Science 347, 188–194 (2015). [DOI] [PMC free article] [PubMed] [Google Scholar]
- 25.Wolfson RL et al. Sestrin2 is a leucine sensor for the mTORC1 pathway. Science 351, 43–48 (2016). [DOI] [PMC free article] [PubMed] [Google Scholar]
- 26.Teis D, Wunderlich W & Huber LA Localization of the MP1-MAPK scaffold complex to endosomes is mediated by p14 and required for signal transduction. Developmental cell 3, 803–814 (2002). [DOI] [PubMed] [Google Scholar]
- 27.Nada S et al. The novel lipid raft adaptor p18 controls endosome dynamics by anchoring the MEK-ERK pathway to late endosomes. Embo J 28, 477–489 (2009). [DOI] [PMC free article] [PubMed] [Google Scholar]
- 28.Manifava M et al. Dynamics of mTORC1 activation in response to amino acids. Elife 5 (2016). [DOI] [PMC free article] [PubMed] [Google Scholar]
- 29.Kulak NA, Pichler G, Paron I, Nagaraj N & Mann M Minimal, encapsulated proteomic-sample processing applied to copy-number estimation in eukaryotic cells. Nat Methods 11, 319–324 (2014). [DOI] [PubMed] [Google Scholar]
- 30.Sprague BL, Pego RL, Stavreva DA & McNally JG Analysis of binding reactions by fluorescence recovery after photobleaching. Biophys J 86, 3473–3495 (2004). [DOI] [PMC free article] [PubMed] [Google Scholar]
- 31.Inoue T, Heo WD, Grimley JS, Wandless TJ & Meyer T An inducible translocation strategy to rapidly activate and inhibit small GTPase signaling pathways. Nat Methods 2, 415–418 (2005). [DOI] [PMC free article] [PubMed] [Google Scholar]
- 32.Zoncu R et al. A phosphoinositide switch controls the maturation and signaling properties of APPL endosomes. Cell 136, 1110–1121 (2009). [DOI] [PMC free article] [PubMed] [Google Scholar]
- 33.Abu-Remaileh M et al. Lysosomal metabolomics reveals V-ATPase- and mTOR-dependent regulation of amino acid efflux from lysosomes. Science 358, 807–813 (2017). [DOI] [PMC free article] [PubMed] [Google Scholar]
- 34.Schroder B, Wrocklage C, Hasilik A & Saftig P Molecular characterisation of ‘transmembrane protein 192’ (TMEM192), a novel protein of the lysosomal membrane. Biol Chem 391, 695–704 (2010). [DOI] [PubMed] [Google Scholar]
- 35.Liberles SD, Diver ST, Austin DJ & Schreiber SL Inducible gene expression and protein translocation using nontoxic ligands identified by a mammalian three-hybrid screen. Proc Natl Acad Sci U S A 94, 7825–7830 (1997). [DOI] [PMC free article] [PubMed] [Google Scholar]
- 36.Fracchiolla D et al. Mechanism of cargo-directed Atg8 conjugation during selective autophagy. Elife 5 (2016). [DOI] [PMC free article] [PubMed] [Google Scholar]
- 37.Vink M et al. In vitro FRAP identifies the minimal requirements for Mad2 kinetochore dynamics. Current biology : CB 16, 755–766 (2006). [DOI] [PubMed] [Google Scholar]
- 38.Young LN, Cho K, Lawrence R, Zoncu R & Hurley JH Dynamics and architecture of the NRBF2-containing phosphatidylinositol 3-kinase complex I of autophagy. Proc Natl Acad Sci U S A 113, 8224–8229 (2016). [DOI] [PMC free article] [PubMed] [Google Scholar]
- 39.Schmidt G et al. Biochemical and biological consequences of changing the specificity of p21ras from guanosine to xanthosine nucleotides. Oncogene 12, 87–96 (1996). [PubMed] [Google Scholar]
- 40.Chen J et al. Single-molecule dynamics of enhanceosome assembly in embryonic stem cells. Cell 156, 1274–1285 (2014). [DOI] [PMC free article] [PubMed] [Google Scholar]
- 41.Hansen AS, Pustova I, Cattoglio C, Tjian R & Darzacq X CTCF and cohesin regulate chromatin loop stability with distinct dynamics. Elife 6 (2017). [DOI] [PMC free article] [PubMed] [Google Scholar]
- 42.Knight SC et al. Dynamics of CRISPR-Cas9 genome interrogation in living cells. Science 350, 823–826 (2015). [DOI] [PubMed] [Google Scholar]
- 43.Caussinus E, Kanca O & Affolter M Fluorescent fusion protein knockout mediated by anti-GFP nanobody. Nat Struct Mol Biol 19, 117–121 (2011). [DOI] [PubMed] [Google Scholar]
- 44.Gong R et al. Crystal structure of the Gtr1p-Gtr2p complex reveals new insights into the amino acid-induced TORC1 activation. Genes Dev 25, 1668–1673 (2011). [DOI] [PMC free article] [PubMed] [Google Scholar]
- 45.Kurzbauer R et al. Crystal structure of the p14/MP1 scaffolding complex: how a twin couple attaches mitogen-activated protein kinase signaling to late endosomes. Proc Natl Acad Sci U S A 101, 10984–10989 (2004). [DOI] [PMC free article] [PubMed] [Google Scholar]
- 46.Powis K et al. Crystal structure of the Ego1-Ego2-Ego3 complex and its role in promoting Rag GTPase-dependent TORC1 signaling. Cell Res 25, 1043–1059 (2015). [DOI] [PMC free article] [PubMed] [Google Scholar]
- 47.Zhang T, Peli-Gulli MP, Yang H, De Virgilio C & Ding J Ego3 functions as a homodimer to mediate the interaction between Gtr1-Gtr2 and Ego1 in the ego complex to activate TORC1. Structure 20, 2151–2160 (2012). [DOI] [PubMed] [Google Scholar]
- 48.de Araujo MEG et al. Crystal structure of the human lysosomal mTORC1 scaffold complex and its impact on signaling. Science 358, 377–381 (2017). [DOI] [PubMed] [Google Scholar]
- 49.Su MY et al. Hybrid Structure of the RagA/C-Ragulator mTORC1 Activation Complex. Mol Cell 68, 835–846 e833 (2017). [DOI] [PMC free article] [PubMed] [Google Scholar]
- 50.Yonehara R et al. Structural basis for the assembly of the Ragulator-Rag GTPase complex. Nature communications 8, 1625 (2017). [DOI] [PMC free article] [PubMed] [Google Scholar]
- 51.Zhang T et al. Structural basis for Ragulator functioning as a scaffold in membrane-anchoring of Rag GTPases and mTORC1. Nature communications 8, 1394 (2017). [DOI] [PMC free article] [PubMed] [Google Scholar]
- 52.Jeong JH et al. Crystal structure of the Gtr1p(GTP)-Gtr2p(GDP) protein complex reveals large structural rearrangements triggered by GTP-to-GDP conversion. J Biol Chem 287, 29648–29653 (2012). [DOI] [PMC free article] [PubMed] [Google Scholar]
- 53.Cherfils J & Zeghouf M Regulation of small GTPases by GEFs, GAPs, and GDIs. Physiol Rev 93, 269–309 (2013). [DOI] [PubMed] [Google Scholar]
- 54.Horiuchi H et al. A novel Rab5 GDP/GTP exchange factor complexed to Rabaptin-5 links nucleotide exchange to effector recruitment and function. Cell 90, 1149–1159 (1997). [DOI] [PubMed] [Google Scholar]
- 55.Lippe R, Miaczynska M, Rybin V, Runge A & Zerial M Functional synergy between Rab5 effector Rabaptin-5 and exchange factor Rabex-5 when physically associated in a complex. Mol Biol Cell 12, 2219–2228 (2001). [DOI] [PMC free article] [PubMed] [Google Scholar]
- 56.Groves JT & Kuriyan J Molecular mechanisms in signal transduction at the membrane. Nat Struct Mol Biol 17, 659–665 (2010). [DOI] [PMC free article] [PubMed] [Google Scholar]
- 57.Gureasko J et al. Membrane-dependent signal integration by the Ras activator Son of sevenless. Nat Struct Mol Biol 15, 452–461 (2008). [DOI] [PMC free article] [PubMed] [Google Scholar]
- 58.Shen K, Choe A & Sabatini DM Intersubunit Crosstalk in the Rag GTPase Heterodimer Enables mTORC1 to Respond Rapidly to Amino Acid Availability. Mol Cell 68, 821 (2017). [DOI] [PMC free article] [PubMed] [Google Scholar]
- 59.Martina JA & Puertollano R Rag GTPases mediate amino acid-dependent recruitment of TFEB and MITF to lysosomes. J Cell Biol 200, 475–491 (2013). [DOI] [PMC free article] [PubMed] [Google Scholar]
- 60.Roczniak-Ferguson A et al. The transcription factor TFEB links mTORC1 signaling to transcriptional control of lysosome homeostasis. Science signaling 5, ra42 (2012). [DOI] [PMC free article] [PubMed] [Google Scholar]
- 61.Settembre C et al. A lysosome-to-nucleus signalling mechanism senses and regulates the lysosome via mTOR and TFEB. Embo J 31, 1095–1108 (2012). [DOI] [PMC free article] [PubMed] [Google Scholar]
- 62.Zhou X et al. Dynamic Visualization of mTORC1 Activity in Living Cells. Cell reports (2015). [DOI] [PMC free article] [PubMed] [Google Scholar]
- 63.Filipek PA et al. LAMTOR/Ragulator is a negative regulator of Arl8b- and BORC-dependent late endosomal positioning. J Cell Biol 216, 4199–4215 (2017). [DOI] [PMC free article] [PubMed] [Google Scholar]
- 64.Pu J, Keren-Kaplan T & Bonifacino JS A Ragulator-BORC interaction controls lysosome positioning in response to amino acid availability. J Cell Biol 216, 4183–4197 (2017). [DOI] [PMC free article] [PubMed] [Google Scholar]
- 65.Wolfson RL et al. KICSTOR recruits GATOR1 to the lysosome and is necessary for nutrients to regulate mTORC1. Nature 543, 438–442 (2017). [DOI] [PMC free article] [PubMed] [Google Scholar]
- 66.Zoncu R et al. mTORC1 senses lysosomal amino acids through an inside-out mechanism that requires the vacuolar H(+)-ATPase. Science 334, 678–683 (2011). [DOI] [PMC free article] [PubMed] [Google Scholar]
- 67.Grabiner BC et al. A diverse array of cancer-associated MTOR mutations are hyperactivating and can predict rapamycin sensitivity. Cancer Discov 4, 554–563 (2014). [DOI] [PMC free article] [PubMed] [Google Scholar]
- 68.Rodrik-Outmezguine VS et al. Overcoming mTOR resistance mutations with a new-generation mTOR inhibitor. Nature 534, 272–276 (2016). [DOI] [PMC free article] [PubMed] [Google Scholar]
Associated Data
This section collects any data citations, data availability statements, or supplementary materials included in this article.