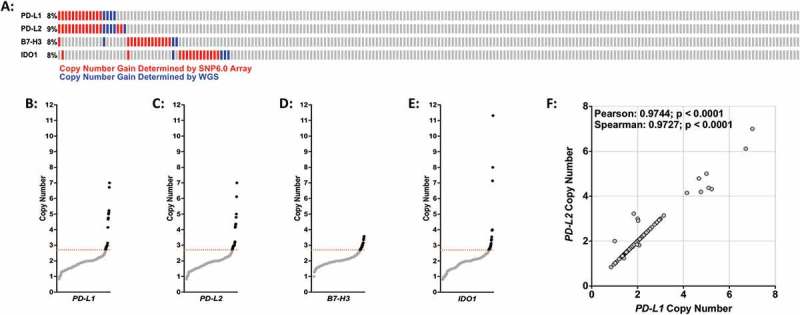
Figure 1.

Copy number gains of PD-L1, PD-L2, B7-H3, and IDO1 in osteosarcoma specimens. (A) Graphical depiction of PD-L1, PD-L2, B7-H3, and IDO1 copy number gains in 215 osteosarcoma specimens. Red bars = copy number detected by SNP6.0 arrays; blue bars = copy number determined by whole genome sequencing. (B-E) DNA copy number distribution of (B) PD-L1, (C) PD-L2, (D) B7-H3, and (E) IDO1 in osteosarcoma specimens where black dots indicate individual specimens with copy number values above threshold (2.7 copies; dotted red line). (F) DNA copy number scatter plot for PD-L1 and PD-L2. Statistical significance (p ≤ 0.05) determined using both Spearman and Pearson correlation tests.
