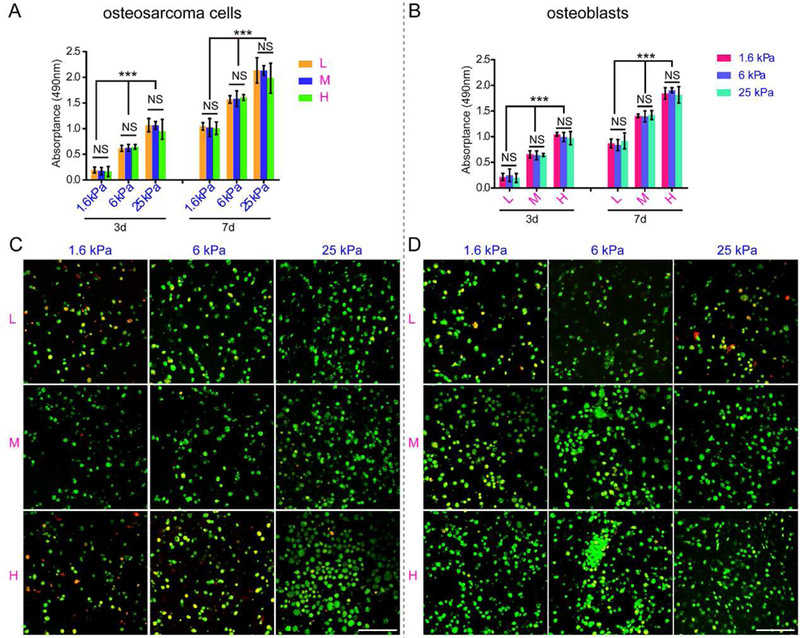
Fig. 3. Cell viability and proliferation of osteosarcoma cells and osteoblasts cultured within scaffolds.

(A) Cell proliferation of intrascaffold-cultured osteosarcoma cells after 3 and 7 days by MTT analysis. (B) Cell Proliferation of intrascaffold-cultured osteoblasts after 3 and 7 days by MTT analysis. (C) Representative images of intrascaffold-cultured osteosarcoma cells after 7 days by live/dead cell assay. Scale bar: 50 µm. (D) Representative images of intrascaffold-cultured osteoblasts after 7 days by live/dead cell assay. Scale bar: 50 µm. n=3; mean ± SD; *P<0.05, **P<0.01, ***P<0.001; NS, not significant. L, M and H correspond to low (0.05% GelMA), middle (0.2% GelMA) and high (0.5% GelMA) adhesion ligand density.
