

Abstract
Intratumoral hypoxia has been associated with invasion, metastasis, and treatment failure, prompting the need for a global characterization of the response to hypoxic conditions. The current study presents the results of a large-scale RNA sequencing (RNA-seq) effort, analyzing 31 breast cancer cell lines representative of breast cancer subtypes or normal mammary epithelial (NME) cells exposed to control tissue culture conditions (20% O2) or hypoxic conditions (1% O2). The results demonstrate that NME have a stronger response to hypoxia both in terms of number of genes induced by hypoxia as well as level of expression. A conserved 42-gene hypoxia signature shared across PAM50 subtypes and genes that are exclusively upregulated in Luminal A, Luminal B, and Normal-like mammary epithelial cells is identified. The 42-gene expression signature is enriched in a subset of Basal-like cell lines and tumors, and differentiates survival among patients with Basal-like tumors. Mechanistically, the hypoxia inducible factors (HIF-1 and/or HIF-2) mediate the conserved hypoxic response. Also, four novel hypoxia-regulated and HIF-1 responsive genes were identified as part of the conserved signature. This dataset provides a novel resource to query transcriptional changes that occur in response to hypoxia and serves as a starting point for a clinical assay to aid in stratifying patients that would benefit from hypoxia-targeted therapies some of which are currently in clinical trials.
Keywords: Hypoxia, Breast Cancer, HIF, CASP14, FUT11, DNAH11, TCAF2
Introduction
Increased cell proliferation and oxygen consumption result in lower oxygen availability in solid tumors as compared to normal tissue (1,2). Intratumoral hypoxia has been associated with invasion, metastasis, treatment failure, and patient mortality (3). Although mechanistic data from preclinical studies and survival data from clinical studies indicate that intratumoral hypoxia and increased HIF-1α expression are associated with aggressive cancers (4–6), the ability to identify individual patients at increased risk is still limited. This is likely a reflection of the heterogeneous nature of the disease (7), both across patients with the same diagnosis and within individual tumors as a function of time, treatment, and spatial localization of hypoxia within a tumor.
Cancer cells survive and adapt to hypoxic conditions, in part, through the activation of hypoxia-inducible factor 1 (HIF-1) and HIF-2, which induce the expression of gene products involved in angiogenesis, glucose utilization, invasion, and metastasis (8). HIF-1 (−2) is a heterodimeric protein composed of a constitutively expressed HIF-1β subunit and an O2-regulated HIF-1α (−1α) subunit that act as transcription factors (9,10). HIF-1 or HIF-2 regulate the expression of potentially 1000s of genes. How HIF-response differs between cell types of different organs or between cells in the same organ that have undergone transformation still remains elusive.
Several studies have used gene expression microarrays (see review (11)) or chromatin immunoprecipitation (ChIP) of HIF-1α or HIF-2α followed by microarray or RNA sequencing (12–14) to attempt to identify global transcriptional responses to hypoxia and/or HIFs. This has typically been carried out in cell lines exposed to normal tissue culture conditions (20% O2) as compared to cells exposed to hypoxic conditions (0.5–2.0% O2) and has resulted in a variety of ‘hypoxia gene signatures’ (11). A recent review aimed at comparing hypoxia signatures identified 32 published gene signatures and concluded that no single gene was present among all signatures (11). The authors suggest that this could reflect a difference between cell lines and clinical samples from different tumor types. Twenty-seven of the studies used at most 7 cell lines to derive a hypoxia-signature. The remaining 7 studies used classic hypoxia-regulated genes in cluster-type analyses to identify additional hypoxia regulated genes. Currently, there is no consensus as to the best way to derive a hypoxia signature. However, it is clear that such a signature would be useful in the stratification of patients who may benefit from therapies currently under development that are aimed at targeting the hypoxic response. For example, a recent study highlighted the utility of a 26-gene hypoxia signature to predict benefit from hypoxia-modifying treatment in laryngeal cancer (15).
Seminal studies by the Gray group, Perou group, The Cancer Genome Atlas (TCGA), and METABRIC (16–21) have uncovered the diverse nature of breast cancer. An analysis of a large panel of breast cancer cell lines has demonstrated that the same heterogeneity in copy number and expression abnormalities found in cell lines are also found in primary tumors (16). The most common cell line panels used in breast cancer research represent almost all of the recurrent genomic abnormalities associated with clinical outcome in primary tumors (16). Early studies using unsupervised clustering of mRNA expression data from cell lines and patient samples led to the identification of “intrinisic subtypes”: Luminal A and B, Basal-like, HER2+ and Normal-like (17,22), although subsequent groups have further stratified these disease entities (23–25). The intrinisic molecular subtypes complement, but do not fully overlap, pathologic classification by ER, PR, and HER2 status (26). Given that in breast cancer tissue, the measured partial pressure of oxygen (PO2) ranges between 2.5 and 28 mm Hg, with a median value of 10 mm Hg (~1% O2), as compared to 65 mm Hg in normal breast tissue (27), we sought to determine whether hypoxia could alter the intrinisic subtype classification of the cell lines and to identify a conserved hypoxia-inducible gene signature in breast cancer.
To assess hypoxia induced transcriptional profile changes specifically in breast cancer cells, we exposed a panel of 31 breast cancer cell lines or normal human mammary epithelial cells to 20% or 1% O2. Our results show that over 1000 genes are induced or repressed in each cell line in response to hypoxia, however only 42-genes shared a conserved response to hypoxia. We demonstrate that cells classified as Normal-like have an overall stronger response to hypoxia both in terms of number of genes induced by hypoxia as well as level of expression. An extensive literature search as well as loss-of-function assays for HIF-expression demonstrate that HIF-1α or HIF-2α are required for the induction of the 42-gene signature under hypoxic conditions. This hypoxia gene signature is also enriched in Basal-like cell lines and Basal-like tumors over and above other subtypes. The signature was prognostic in Basal-like Breast cancer patients from two METABRIC cohorts (19,20) as well as the 2017 KMplotter (28) cohort and demonstrated statistically significant differences in survival upon stratification. Of the 42-genes identified, we show that Caspase-14 (CASP14) is a novel hypoxia-regulated gene bound by HIF-1 but not HIF-2. We also show for the first time that Fucosyltranferase 11 (FUT11), Dynein axonemal heavy chain 11 (DNAH11), and TRPM8 channel-associated factor 2 (TCAF2) are induced under hypoxic conditions in a HIF-dependent manner. The 42-gene hypoxia signature is prognostic for breast cancer patient outcome, and may provide a robust set of hypoxia biomarkers for clinical use.
Materials and methods
Cell culture
All cell lines except SUM159 and SUM149 were obtained directly from the ATCC or Asterand (SUM lines). Cells were cultured as described by the ATCC or Asterand and experiments were conducted on early passage cells within 2–3 passages after receipt. The SUM149 and SUM159 cells were gifts from the Sukumar lab and were authenticated by STR sequencing and confirmed to be mycoplasma free. We classified each cell line according to the PAM50 subtype classification as recently published by Marcotte et al. (25). In brief, the author’s (25) utilized a centroid-based classification method. The expression of each gene in the classifier was median-centered across 78 cell lines classified by Marcotte et al. Pearson correlation was used to match each cell line to an intrinsic subtype, defined as the subtype with the highest associated correlation coefficient. We used the reported subtype values for each of the cell lines from their analysis as the subtype calls for the cell lines in our current study. Human telomerase immortalized mammary epithelial cells were not considered in the study above and thus classified in the current study as htert-HME. Hypoxic cells were maintained at 37°C in a modular incubator chamber (Billups–Rothenberg) flushed with a gas mixture containing 1% O2, 5% CO2, and 94% N2 for 24 h.
Reverse transcription (RT) and qPCR
Total RNA was extracted from cells using TRIzol (Invitrogen) and treated with DNase I (Ambion). All samples had a RIN value of >9.0 when measured on an Agilent Bioanalyzer. One microgram of total RNA was used for first-strand DNA synthesis with the iScript cDNA Synthesis system (BioRad). qPCR was performed using human-specific primers and iTaq SYBR Green Universal Master Mix (Bio-Rad). The expression of each target mRNA relative to 18S rRNA was calculated based on the threshold cycle (Ct) as 2−Δ(ΔCt), where ΔCt = Cttarget − Ct18S and Δ(ΔCt) = ΔCttest − ΔCtcontrol. Primer sequences are shown in Supplementary Table S1.
RNA Library Preparation
Libraries for RNA sequencing were prepared with KAPA Stranded RNA-Seq Kit. The workflow consisted of mRNA enrichment, cDNA generation, end repair to generate blunt ends, A-tailing, adaptor ligation and 14 cycles of PCR amplification. Unique adaptors were used for each sample in order to multiplex samples into several lanes. Sequencing was performed on Illumina Hiseq 3000/4000 with a 150bp pair-end run by Quick Biology (Pasadena, Ca). A data quality check was done on Illumina SAV. Demultiplexing was performed with Illumina Bcl2fastq2 v 2.17 program.
RNA sequencing analysis
Transcript level counts for the cell line RNA-seq data were quantified from reads with salmon version 0.8.2 (29) using human genome build h19. Gene-level counts were computed with Tximport version 1.2.0 (30) using Gencode v26 annotations. Normalized and raw data were uploaded to GEO (GSE111653). TCGA level 3 RNA-seq RSEM V2 data for breast cancer tumors were used for analyses, with subtypes defined in the consortium marker paper (21). Normalized gene expression data for genes in the hypoxia signature defined in this paper from both METABRIC cohorts (19,20) were obtained using the CGDS-R package to access data from the cBioPortal database (31).
Differential expression statistics were computed on read counts with DESeq2 version 1.14.1 (32). Heatmaps were generated with ComplexHeatmap version 1.12.0 (33) with default hierarchical clustering on read counts normalized with the rlog function in DESeq2. We perform paired tests that retain cell-line pairing using a multi-factor design. Genes with FDR adjusted p-values below 0.05 and log fold change greater than 1 were called statistically significant. The calculation of the number of genes with fold changes in different ranges were computed based upon differences between hypoxic and non-hypoxic rlog output values and converted from log2 differences to report values as fold changes. Gene set statistics were computed with Hallmark gene sets from MSigDB version 6.0 (34) and HIF gene target sets curated from the literature (35) (Supplementary Table S2) using a one-sided Wilcoxon gene set test in LIMMA (36). Gene sets with FDR adjusted p-values below 0.05 were considered significantly enriched. These analyses were performed in R using scripts for normalization and analysis available as Supplementary File 1 and 2, respectively.
CRISPR Mediated Knock-out of HIF-1α or HIF-2α
LentiCRISPR v2 plasmid used for generating a CRISPR-Cas9 endonuclease was a gift from Feng Zhang (Broad Institute, Massachusetts Institute of Technology, Cambridge, MA, obtained via Addgene (Addgene plasmid #52961)). HIF-1α/2α knockout by CRISPR/Cas9 was performed as previously described with slight modifications (37). Insert oligonucleotides that include a guide RNA sequence were annealed and inserted into the BsmBI cloning site. After bacterial transformation and DNA purification, all plasmid constructs were confirmed by Sanger sequencing. The LentiCRISPR v2 HIF-1α or HIF-2α or a non-targeting gDNA control (NTC) were transfected along with helper vectors into 293T cells using PolyJet™ transfection reagent (SignaGen Laboratories, Rockville, MD) according to the manufacturer’s instructions. Media was refreshed 16–24h following transfection and filtered viral supernatant is collected 24–48h later. Viral supernatant was added to MCF-7 or MDA-MB-231 cells and puromycin (0.5 μg/mL) was added to the medium of cells followed transduction for positive selection.
Immunoblot Assays
Cells were lysed in IGEPAL CA-630 buffer (150mM NaCl, 1% IGEPAL CA-630, 50 mM Tris-HCl, pH 8.0 and protease inhibitors) for 10 min on ice, centrifuged for 10 min at 13,000 rpm at 4°C and the insoluble debris were discarded. Whole cell lysates were fractionated by 12% SDS-PAGE and transferred to a nitrocellulose membrane (Bio-Rad). The membrane was incubated for 1 h with 5% milk in TBS-T (Tris-buffered saline and 0.1% Tween-20) and then incubated overnight with primary antibodies diluted in blocking buffer. Antibodies against the following proteins were used: HIF-1α (BD Biosciences, San Jose, CA), HIF-2α (Novus Biologicals, Littleton, CO), Actin (ProteinTech, Rosemont, IL). The membrane was then washed and incubated with the corresponding HRP-conjugated secondary antibody (Azure Biosystems, Dublin, CA) for 2 h. Chemiluminescence signal was detected on an AZURE C300 (Azure Biosystems, Dublin, CA) using ECL (PerkinElmer, Waltham, MA).
Chromatin Immunoprecipitation (ChIP) assay
BT474 cells were exposed to hypoxia for 4h and immediately cross-linked with formaldehyde, quenched with glycine and lysed with SDS lysis buffer (1% SDS, 10 mM EDTA and 50 mM Tris, pH 8.1). Chromatin was sheared by sonication using a Covaris sonicator (settings: Power (W): 150, Duty Factor: 5%, Cycles: 200 Treatment time: 420 sec (7 min)), and size distribution of DNA fragments ranging from 300–800bp were confirmed by running samples on an agarose gel. Following sonication, lysates were precleared with salmon sperm DNA/protein A-agarose slurry (Millipore) and incubated with antibody against HIF-1α (Santa Cruz Biotechnology), HIF-1β (Novus Biologicals), or HIF-2α (Novus Biologicals), or with IgG (Santa Cruz Biotechnology), as previously described (38). Following elution, DNA enrichment of the CASP14 promoter was determined using primers sequences listed in Supplementary Table S1.
Results
Hypoxic Breast Cancer Gene Signature
We performed an RNA sequencing (RNAseq) analysis of 31 well-characterized breast cancer cell lines or normal mammary epithelial cells exposed to control tissue culture conditions (20% O2) or hypoxic (1% O2) conditions for 24 h (in triplicate). The cell lines in this study (see Supplementary Table S3) include Basal-like, Luminal A, Luminal B, HER2, and Normal-like cells as classified using PAM50 analysis by Marcotte et al. (25). Prior to performing RNAseq, each sample was tested for the induction of three established HIF-1α inducible RNA transcripts using real-time PCR (RT-PCR): prolyl 4-hydroxylase 1 (P4HA1), BCL2/adenovirus E1B 19 kDa protein-interacting protein 3 (BNIP3), and vascular endothelial growth factor A (VEGFA) in order to verify that the cells respond to hypoxia for validation purposes (39–41). The expression of P4HA1, BNIP3, and VEGFA was significantly increased in each of the 31 cell lines analyzed (Fig.1A-C).
Figure 1.
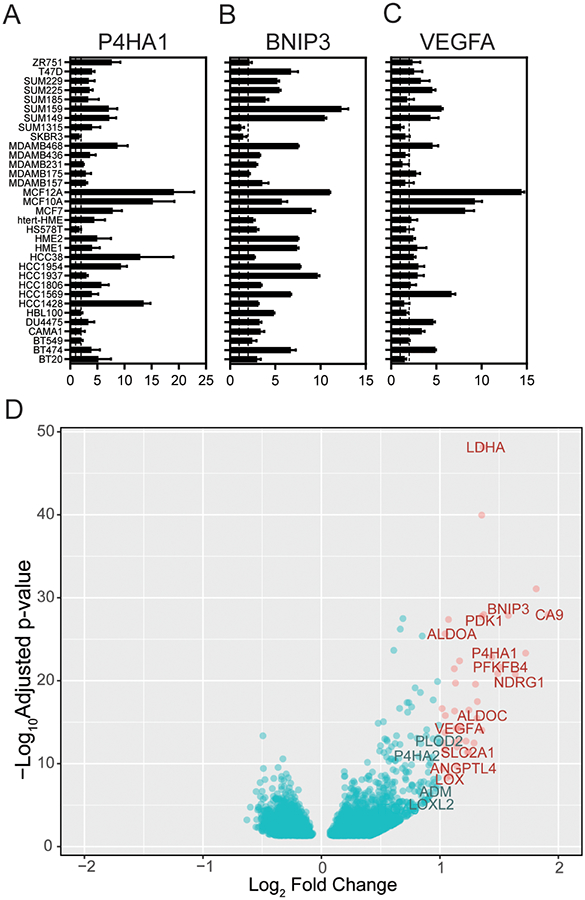
RNA sequencing of 31 cells line exposed to 20% O2 and 1% O2 reveals a conserved set of hypoxia-inducible genes. A-C, qPCR of RNA lysates from 34 breast cancer cells lines to determine the fold change in the induction of P4HA1 (A) BNIP3 (B) and VEGFA (C) upon exposure to 1% compared to 20% O2 conditions (N = 3 biological × 3 technical repeats per cell line). Dash lines mark a fold change equal to 1 (left) or 2 (right). D, Differential expression statistics comparing samples exposed to 20% as compared with 1% O2 were calculated using DESeq2. A volcano plot of the differential expression statistics show genes (in red) with a log-fold change (LFC) greater than 1 and a false-discovery rate (FDR) adjusted p-value less than 0.05. The 42-genes that meet this criteria are listed in Supplementary Table S2.
Following, the experimental verification of hypoxia exposure, RNA libraries were constructed from RNA lysates followed by RNAseq to identify gene expression alterations amongst all cell lines. We performed an unsupervised hierarchical clustering analysis of the 1,000 most variable genes across all samples to delineate the main sources of variability in the whole group of samples (Supplementary Fig. S1). The analysis revealed Luminal A, Luminal B, and HER2 cells clustered together whereas Basal-like cells clustered with cells classified as Normal-like. This is in keeping with the finding that non-cancerous, MCF10A and MCF12A cells, clustered with Basal B in studies by Neve et al. (16). We also found that hTERT-immortalized HMEs clustered with Basal–like cell lines. The analysis demonstrated that hypoxia did not alter clustering based on breast cancer subtype.
We perform differential expression analysis to characterize global differences in RNA transcript levels induced under hypoxic conditions among all cell lines. Specifically, we performed a paired test between hypoxic and normoxic conditions retaining the cell-line pairing using a multi-factor design with DESeq2 (32). Volcano plots highlight genes (in red) with a mean log-fold change across all cell lines (LFC) greater than 1 and a false discovery rate (FDR) adjusted p-value less than 0.05 that are significantly increased in cells in response to hypoxia (Fig. 1D). We identified 42 genes (including non-coding RNAs and pseudogenes) that met these criteria and used them to define the ‘conserved 42-gene hypoxia signature’ (Supplementary Table S4). Interestingly, no genes with FDR adjusted p-value below 0.05 had LFC < −1, suggesting that the conserved response to hypoxia when grouping all cell lines together involves the induction rather than suppression of genes.
The 42-genes that were significantly induced by hypoxia include many previously reported HIF-dependent hypoxia responsive genes including genes encoding proteins with central roles in glucose metabolism (glucose transporter type 1 [SLC2A1], fructose-2,6-bisphosphate synthesis [PFKFB4], lactate dehydrogenase A [LDHA], aldolases [ALDOA, ALDOC]), angiogenesis (angiopoietin-like 4 [ANGPTL4], [VEGFA]), cell proliferation and apoptosis ([BNIP3L, BNIP3], neuregulin 1 [NDRG1]), extracellular matrix synthesis ([P4HA1], lysyl oxidase [LOX]). Four novel genes (CASP14, FUT11, DNAH11, TCAF2) and 5 unreported transcripts coding for long non-coding RNAs or pseudogenes were also identified as part of the 42-gene hypoxia signature (Supplementary Table S4).
Next, we performed a gene set analysis using differential expression statistics with Hallmark gene sets from MSigDB (34). We identified 22 pathways that are up-regulated under hypoxic conditions with an FDR adjusted p-value below 0.05 (Supplementary File 2). Not surprisingly, the top pathway identified was the hypoxia response pathway (p-value < 10−60). In addition, many well-known hypoxia-regulated pathways such as the epithelial-to-mesenchymal transition, glycolysis, TGFβ signaling, and NOTCH signaling pathways were among the top 22 altered pathways.
Heterogeneity in the hypoxic response across cell lines
We clustered gene expression data for each cell line by the normalized RNA gene expression levels of the 42-gene signature and examined the cell line clustering in cells that were not exposed to hypoxia. The analysis revealed that half of the Basal-like cell lines (SUM1315MO, HS578T, BT549, MDA-MB-231, SUM159, SUM149, HBL100, HCC1569, and DU4475) have the highest level of expression of the 42-gene hypoxia signature under normal tissue culture conditions (20% O2) (Fig. 2A). Gene set analysis confirms that the set of 42 genes are significantly differentially expressed between Basal-like cell lines relative to Luminal A (p-value of 7×10⁻⁷) and Basal-like cell lines relative to Luminal B (p-value of 1.0×10⁻⁷), but not between Basal-like and HER2 cells (p-value of 0.45) under non-hypoxic conditions.
Figure 2.
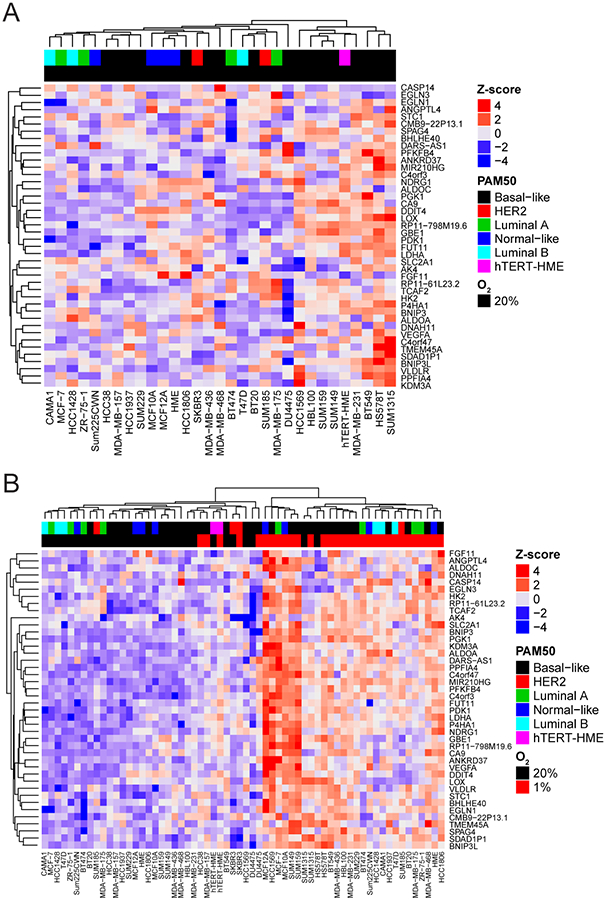
Basal-like breast cancer cells express higher endogenous levels of the 42-gene hypoxia signature. A-B, Heatmap of gene expression values for the 42-gene hypoxia signature identified with CoGAPS analysis of gene expression data from 31 breast cancer cell lines cultured under standard tissue culture conditions (20% O2) (A) or both 20% and 1% O2 (B) Color-coding describes the subtype of the cancer cell line. htert-HME cells were not classified in the Marcotte et al. study. The z-score ranges from low (blue) to high (red).
Next, we compared the level of induction of the 42-gene hypoxia signature after exposure to hypoxia by performing a hierarchical clustering analysis on the fold changes (Supplementary Fig. 2) and gene expression values (Fig 2). Cell lines exposed to hypoxia did not cluster based on PAM50 but rather clustered based on culture conditions (20% O2 versus 1% O2 conditions) (Fig. 2B). MCF12A, MCF10A, SUM149, SUM159, HCC1569, and MCF-7 cells have the greatest induction of the 42-gene signature in response to hypoxia. No obvious commonalities have been identified among these cell lines. For example, the cell lines do not share a similar estrogen receptor (ER), BRCA, p53, or phosphoinositide 3-kinase (PI3K) status suggesting that mechanisms outside of a specific genetic aberration may be involved.
In addition to the 42-gene signature, we also assessed the total number of genes in each cell line by fold change induction or repression between hypoxic and non-hypoxic conditions (Fig. 3A-B, respectively). Each of the cell lines had greater than 1000 (out of 46,680 genes that were detected) genes induced under hypoxic conditions with a fold change of 2 or greater (Fig. 3A). Likewise, over 800 genes were repressed under hypoxic conditions with a fold change of 2 or greater in each of the cell lines analyzed (Fig. 3B).
Figure 3.
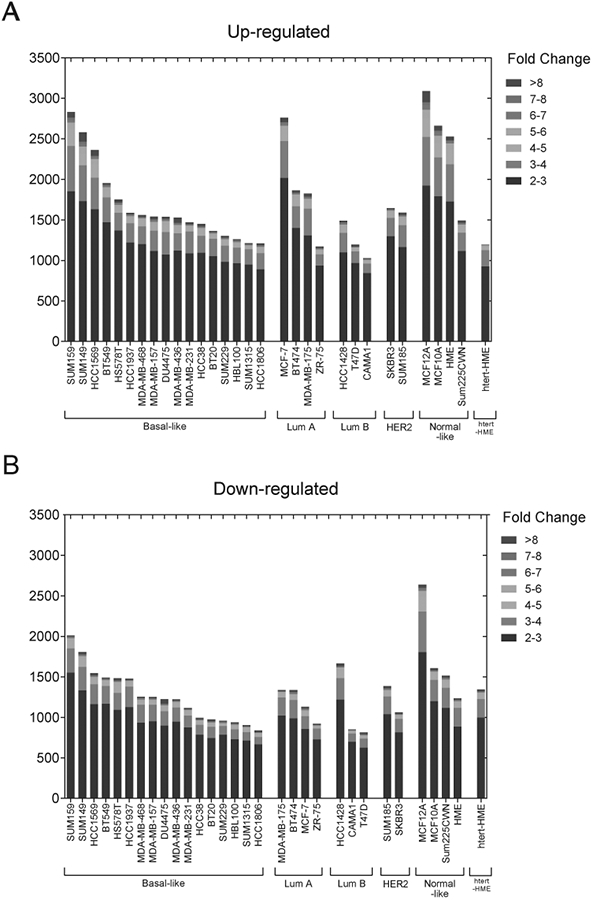
Breast cancer cells display a heterogeneous response to hypoxic conditions. A-B, The number of genes that are upregulated (A) or downregulated (B) in each cell line stratified by fold change after exposure to 1% compared to 20% O2 conditions.
Subtype specific response to hypoxia
Given the heterogeneity in the genes that are induced by hypoxia among the cell lines tested, we sought to determine whether a subset of genes was preferentially expressed based on breast cancer cell subtype. We performed a paired test between hypoxic and non-hypoxic cells of each subtype and generated subtype-specific volcano plots (Fig. 4A-D). According to PAM50 classification, only SKBR3 and SUM185 cells were considered as a HER2 subtype. Differential expression analysis did not reveal differences between HER2 subtyped cells cultured under 20% or 1% O2 conditions. On the other hand, cells classified as Normal-like differentially express 139-genes that are upregulated under hypoxic conditions and 15 genes that are downregulated under hypoxic conditions and that are exclusive to Normal-like cells (Fig. 4E). The Normal-like cell lines also had the highest degree of overlap with other subtypes. Several subtype exclusive genes were also identified.
Figure 4.
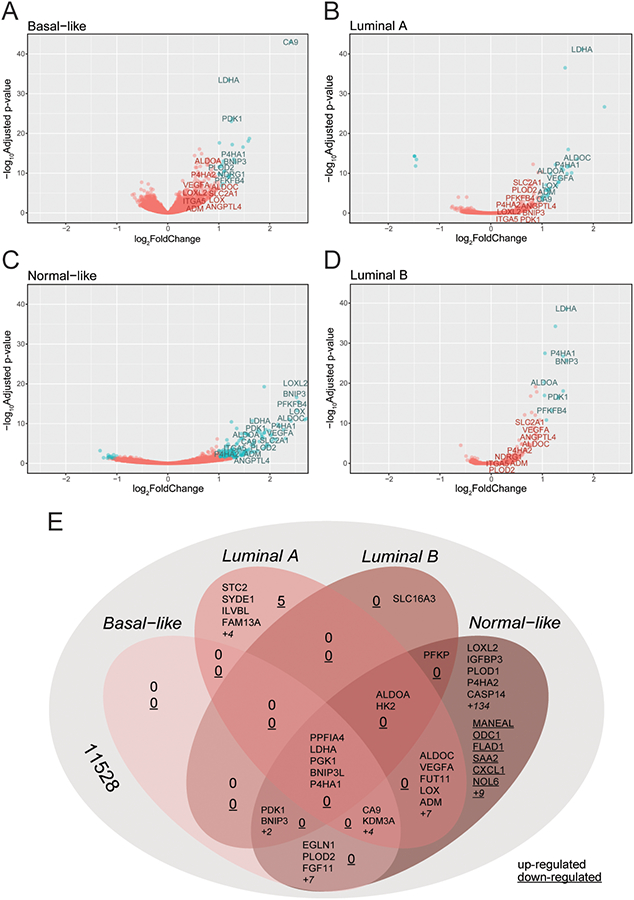
Basal cell lines display the highest number of differentially expressed genes upon exposure to hypoxia. A-D, Differential expression statistics comparing samples exposed to 20% as compared with 1% O2 were calculated using DESeq2 for Basal-like (A), Luminal A (B), Normal-like (C) and Luminal B (D) subtype cell lines. A volcano plot of the differential expression statistics show genes (in red) with a LFC greater than 1 and FDR adjusted p-value less than 0.05. E, VENN diagram displaying the number of genes that overlap or that are exclusive to each subtype.
Patients with Basal-like subtype tumors preferentially express the 42-gene signature
Given that our analysis that many Basal-like cell lines have high expression of the 42-gene signature in the absence of hypoxic conditions, we hypothesized that a similar stratification occurs in patient samples. We performed hierarchical clustering of RNA sequencing data from breast cancer patients in the TCGA database (21) for genes in our hypoxia signature. The analysis revealed subtype-specific clusters within the 42-gene hypoxia-signature (Fig. 5). A one-sided gene set analysis using our hypoxia signature as the gene set performed on differential expression statistics for Basal-like tumors relative to other subtypes confirms that genes in this hypoxia signature are significantly overexpressed in Basal-like tumors relative to tumors of other subtypes (p-value of 0.029).
Figure 5.
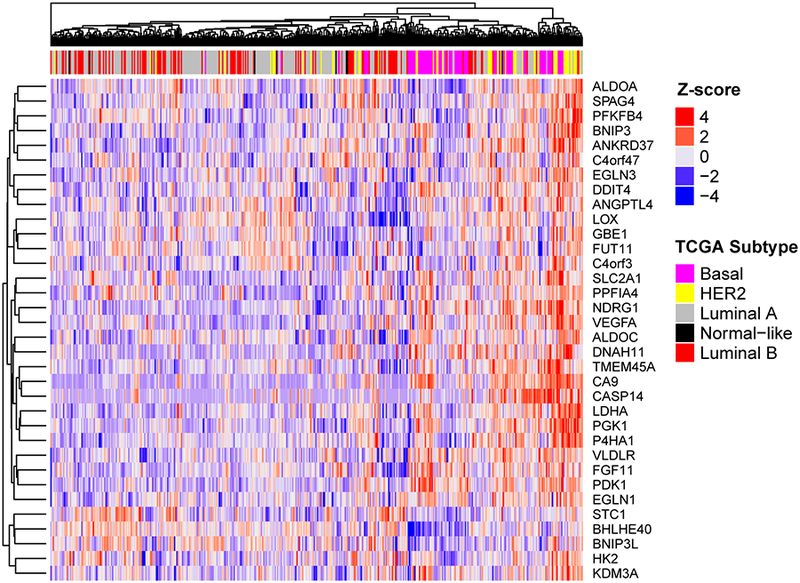
Patients with Basal breast cancer have a higher level of the 42-gene hypoxia signature. Supervised clustering analysis of all breast cancer patients in the TCGA database by the 42-gene hypoxia signature reveals that patients with basal breast cancer have a higher level of expression of hypoxia gene compared to other subtypes.
Given that a subset of the Basal–like cell lines showed high levels of the hypoxia-signature and still had a significant induction under hypoxic conditions, we hypothesized that the hypoxia gene signature could be used to stratify patients based upon survival. We defined clustered gene expression data for Basal-like tumors in the two METABRIC sample cohorts (19,20). Dividing the samples into two clusters identifies sets of Basal-like tumor samples with low expression among genes in the hypoxia signature and Basal-like tumor samples with high expression among genes in the hypoxia signature (Supplemental File 2). In both cohorts, the tumor samples from the basal subgroup with lower expression among genes in the hypoxia signature had significantly better prognosis than those in the higher expression group (p-value of 0.031 for the 2012 cohort and p-value of 0.0037 for the 2016 cohort; Supplemental Fig. S3A and S3B, respectively). Further analysis of Basal tumors from available datasets last updated in 2017 in KMplotter (28) also confirmed that Basal patients that had expression of the 42-gene hypoxia signature lower than median level of expression had a better prognosis than those that had high expression (p-value of 0.022) (Supplementary Fig. S3C).
Role of HIF-1 and HIF-2 in the hypoxic gene signature
Hypoxia stimulates a variety of adaptive responses, many mediated via the hypoxia inducible factors (HIF) family of transcriptional complexes. However, the transcript levels of HIF-1 and HIF-2 are not significantly induced by hypoxic conditions in the cell lines assayed (Supplementary Fig. S4). This is not surprising given that the regulation of HIF-1 and HIF-2 in known to occur at the protein level via oxygen-dependent hydroxylation of proline and asparagine residues followed by ubiquitation and subsequent degradation through the proteasome (42).
HIF-1 and −2 directly up-regulate gene transcription by binding to putative hypoxia response elements [5’-RCGTG-3’] within target genes (35). To determine whether the genes in our signature were likely the result of HIF-1 or HIF-2 activation, we performed a gene set enrichment analysis using HIF gene target sets curated from the literature (35) (Supplementary Table S2) and we demonstrated that these HIF targets are significantly enriched between 1% O2 and 20% O2 conditions (one sided p-value < 1.1 × 10⁻¹⁶) (Supplementary Fig. S5).
To further explore the relationship between hypoxia and HIF expression in our gene signature, we also compared our hypoxia gene list with 3 independent ChIP microarray or sequencing studies (Table 1). Thirty-three of the genes on our list were enriched by ChIP of either HIF-1α, HIF-2α, or both in at least one out of three of the ChIP followed by microarray or DNA sequencing studies. Twenty-five genes on the list were validated in transactivation assays. Twenty-two of the genes were further validated as HIF-1α or HIF-2α target genes in standard DNA-binding assays such as ChIP or EMSA. If only a single assay was performed to implicate a role for HIFs in the induction of the specified gene under hypoxic conditions, we also queried the literature to identify a study using gain-or-loss of function or loss-of-function of HIF-1, HIF-2 or both to assess HIF-dependence. Taken together, 31 of the 42 genes identified in the study were validated as HIF-regulated in two or more independent assays and/or publications, suggesting that HIFs are responsible for the conserved response to hypoxia in breast cancer cells.
Table 1.
Literature survey for evidence of HIF-dependent induction of genes on the 42-gene hypoxia gene list as determined by 1Chromatin Immunoprecipitation followed by Microarray or DNA Sequencing, 2DNA Binding Assay, or 3Transactivation Assay. If only ChIPSeq assays were performed we also searched for publications in which 4Hypoxia Inducible Factor Dependence was determined using loss-of-function or gain-of-function assays for HIF.
| Gene Name | Accession Number | Chromosome | Methods | References |
|---|---|---|---|---|
| EGLN3 | NM_022073 | chr14 | ChIPSeq1, DB2, TA3 | (1–3) |
| ALDOC | NM_005165 | chr17 | ChIPSeq, TA | (1,3,4) |
| SPAG4 | NM_003116 | chr20 | ChIPSeq, DB, TA | (1,3,5) |
| CA9 | NM_001216 | chr9 | ChIPSeq, DB, TA | (1,6,7) |
| GBE1 | NM_000158 | chr3 | ChIPSeq, HD4 | (1,3,7,8) |
| ANKRD37 | NM_181726 | chr4 | ChIPSeq, DB, TA | (1,3,9) |
| HK2 | NM_000189 | chr2 | ChIPSeq, DB, TA | (1,3,7,10) |
| ANGPTL4 | NM_001039667 | chr19 | ChIPSeq, DB, TA | (1,3,11,12) |
| PDK1 | NM_002610 | chr2 | ChIPSeq, DB, TA | (1,3,13,14) |
| KDM3A (JMJD1A) | NM_018433 | chr2 | ChIPSeq, TA | (1,3,7,15) |
| ALDOA | NM_184041 | chr16 | ChIPSeq, DB, TA | (1,3,16,17) |
| DDIT4 | NM_019058 | chr10 | ChIPSeq, DB, TA | (1,3,18,19) |
| TMEM45A | NM_018004 | chr3 | ChIPSeq, HD | (1,3,7,20) |
| CCNG2 | NM_004354 | chr4 | ChIPSeq, HD | (1,3,7,21) |
| SLC2A1 | NM_006516 | chr1 | ChIPSeq, DB, TA | (1,3,7,22,23) |
| BNIP3L | NM_001330491 | chr8 | ChIPSeq, HD | (3,24) |
| P4HA1 | NM_000917 | chr10 | ChIPSeq, DB, TA | (1,3,25) |
| LDHA | NM_005566 | chr11 | ChIPSeq, DB, TA | (1,3,7,26) |
| NDRG1 | NM_006096 | chr8 | ChIPSeq, DB, TA | (1,3,27) |
| DARS | NM_001349 | chr2 | ChIPSeq, HD | (1,7,28) |
| PPP1R3C | NM_005398 | chr10 | ChIPSeq, DB, TA | (1,3,7,29) |
| PFKFB4 | NM_004567 | chr3 | ChIPSeq, TA | (1,3,7,30) |
| PGK1 | NM_000291 | chrX | ChIPSeq, DB, TA | (3,7,16,17,22,31) |
| VEGFA | NM_003376 | chr6 | DB, TA | (32,33) |
| EGLN1 | NM_022051 | chr1 | DB, TA | (34) |
| BNIP3 | NM_004052 | chr10 | ChIPSeq, DB, TA | (3,35) |
| VLDLR | NM_001018056 | chr9 | ChIPSeq, DB, TA | (3,36,37) |
| STC1 | NM_003155 | chr8 | ChIPSeq, DB,TA | (3,38) |
| FGF11 | NM_004112 | chr17 | TA, HD | (39,40) |
| BHLHE40(DEC1) | NM_017418 | chr9 | ChIPSeq, DB, TA | (3,41) |
| PPFIA4 | NM_001304331 | chr1 | ChIPSeq, DB, TA | (3,42) |
| LOX | NM_002317 | chr5 | ChIPSeq, TA | (3,43) |
| C4orf3 | NM_001001701 | chr4 | ChIPSeq | (3) |
| C4orf47 | NM_001114357 | chr4 | ChIPSeq | (3) |
| FUT11 | NM_173540 | chr10 | ChIPSeq | (1,3) |
| DNAH11 | NM_001277115 | chr7 | ChIPSeq | (3) |
| TCAF2 (FAM139A) | NM_001130025 | chr7 | ChIPSeq | (7) |
| CASP14 | NM_012114 | chr19 | ChIPSeq | |
| MIR210HG | lncRNA5 | chr11 | ||
| RP11–798M19.6 | lncRNA | chr4 | ||
| CMB9–22P13.1 | lncRNA | chr11 | ||
| SDAD1P1 | psuedogene | chr8 | ||
| RP11–61L23.2 | pseudogene | chr7 |
Note: lncRNA stands for long non-coding RNA. See Supplemental Table S5 for references.
Novel HIF-regulated genes
Our study revealed CASP14 as a novel hypoxia-regulated gene product involved in anti-apoptotic responses. To confirm this result, we utilized a subset of 12 breast cancer cell lines to confirm the induction of CASP14 expression upon exposure to 24 h of hypoxia (Fig. 6A). We also confirmed the induction of FUT11, DNAH11, and TCAF2 under hypoxic conditions (Fig. 6A). Next, we generated lentiviral vectors expressing CAS9 and a unique gDNA to target HIF-1α or HIF-2α, in MDA-MB-231 and MCF-7 cells, for CAS9-mediated destruction. Western blot analysis demonstrates the suppression of HIF-1α or HIF-2α in the CRISPR-mediated knockout cell lines under hypoxic conditions (Supplementary Fig. 6A-B). RT-PCR of cDNA lysate confirms that blocking HIF-1α inhibits P4HA1 induction as we have previously shown (39) (Supplementary Fig. S6C-D). RT-PCR analyses of the knockout cells demonstrates that FUT11, DNAH11, CASP14, and TCAF2 all require HIF-1α (but not HIF-2α) for induction under hypoxic conditions (Fig. 6B-C).
Figure 6.
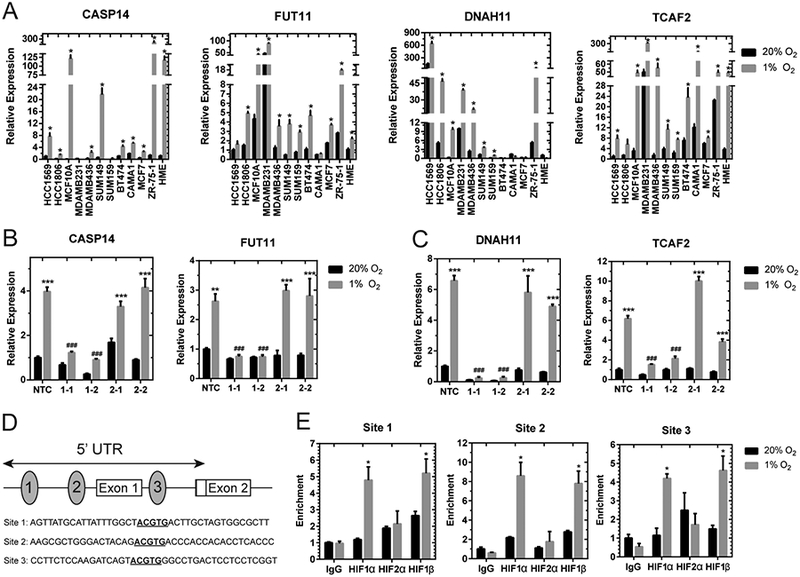
Novel hypoxia regulated identified in the HIF-signature require HIF-1α expression. A, qPCR to determine CASP14, FUT11, DNAH11, and TCAF2 mRNA levels in 12 breast cancer cell lines exposed to 20% O2 or 1% O2 for 24 h, normalized to mean value for HCC1569 cells at 20% O2 (for CASP14, FUT11, and TCAF2) or HME cells at 20% O2 (for DNAH11) (mean ± SEM, n = 3). *, P < 0.05 versus 20% O2 within the same cell line (Student’s t-test). B-C, CASP14 and FUT11 (B) or DNAH11 and TCAF2 (C) mRNA levels were analyzed by qPCR in MCF7 (B) or MDA-MB-231 (C) subclones, which were stably transfected with an non-target control (NTC) CRISPR vector or vectors encoding gDNA sequences that target either HIF-1α (1–1, 1–2) or HIF-2α (2–1, 2–2), and exposed to 20% or 1% O2 for 24 h (mean ± SEM, n = 3–6); **, P < 0.01, ***, P < 0.001 versus NTC at 20% O2 or ###, P < .001 versus NTC at 1% O2 (two-way ANOVA with Bonferroni posttest). D, Candidate HIF-binding sites (ovals) were identified in the 5’-untranslated region of the human CASP14 gene (exons 1 and 2 shown as a rectangles). E, BT474 cells were incubated at 20% or 1% O2 for 4 hours and ChIP assays were performed using IgG or antibodies against HIF-1α, HIF-2α, or HIF-1β. Specific primers flanking candidate HIF-binding sites were used for qPCR (Supplementary Table S1), and values were normalized to IgG expression at 20% O2 (mean ± SEM, n = 3). *, P < 0.05 vs. 20% O2 within the same antibody (Student’s t-test).
In order to determine if CASP14 is directly regulated by HIF-1 binding to the promoter region, the human CASP14 gene sequence was examined for matches to the putative hypoxia response element 5’-(A/G)CGTG-3’. Three candidate sites were identified in the 5’UTR of CASP14 (Fig. 6D). Two binding sites preceded the first non-coding exon and the third was found in intron one. We performed ChIP assays of BT474 cells exposed to 20% or 1% O2 for 4 h to assess potential HIF-binding sites. To validate our samples and ChIP procedures, we tested for enriched binding of HIF-1α and HIF-1β at the previously identified PDK1 HIF binding site (43) under 1% compared to 20% O2 conditions (Supplementary Fig. S6E). We determined that all three candidate binding sites were enriched for HIF-1α and HIF-1β binding under hypoxic conditions whereas HIF-1α and HIF-1β did not bind to RPL13A promoter region (Fig. 6E and Supplementary Fig. S6E). Taken together, the data indicated that HIF-1 activates CASP14 transcription under hypoxic conditions by binding to the CASP14 promoter.
DISCUSSION
Hypoxia signatures: past and present
The prevalence of hypoxia and its contribution to poor prognosis and treatment failure has provided a compelling rationale for clinical-stage drug development, but the recent failure of two major clinical trial efforts (tirapazamine and evofosfamide) calls for reflection (44). Translating these compounds into the clinic has been confounded by the complex biology and heterogeneity of hypoxia and failure to clearly define clinical indications in which hypoxia is treatment-limiting. Patient selection criteria used to select patients that are predicted to benefit from hypoxia-targeted agents is lacking in the design of clinical trials aimed at targeting hypoxic cells. Therefore, there is a need to identify a robust technique that can be used in the clinic to guide treatment decisions for the potential application of this class of drugs. Historically, polarographic oxygen electrodes have been utilized in clinical trials to measure micro-regional pO2 in multiple locations within a tumor. Results from clinical studies in cervix, head and neck, and breast carcinomas indicate that hypoxic tumors have a worse prognosis (45–48). However, the invasive nature of the technique has limited its widespread use. Given the emerging use of microarray technologies and the development of various gene panels that attempt to predict clinical outcome and potentially the response to therapy, an appropriate panel that may serve as a proxy for hypoxia may prove useful. Although there have been many published ‘hypoxia signatures’ that contain genes that have been validated in terms of prognostication in retrospective studies of patient outcome (11), there remains no consensus on the genes that should be included in such a hypoxic signature and no accepted validation procedure for signature development.
Our goal was to provide the first comprehensive study of the transcriptional response of 31 breast cancer cell lines to hypoxia. Our study reveals that although more than 1000 genes may have altered expression patterns under hypoxic conditions in any one breast cancer cell line, less than 50 genes could be considered as having a conserved response to hypoxia. This highlights the complex heterogeneity in the hypoxic response and suggests a need for further studies to identify what leads to these differences. Cells classified as Normal-like had the largest congruence with the transcriptional profile changes of all other subtypes under hypoxia (Fig. 4E), suggesting that as cells undergo transformation, evolve, and acquire unique mutations they become more divergent in their response. We did identify 9 genes with differential expression in Luminal (and ER+) cells compared to other subtypes. Three of the genes (STC2, ILVBL, and FAM13A) contain both estrogen receptor and HIF-binding sites in their promoter, suggesting a potential cross-talk between ER-HIF as a potential mechanism for a unique luminal cancer cell response to hypoxia.
The hypoxic signature and the Basal breast cancer subtype
In 2012, the TCGA project analyzed breast cancer tissue samples with transcriptional profiling (21). The group utilized a PARADIGM analysis to look for pathways that were highly active in Basal compared to Luminal subtype tumors and reported that the HIF-1α/ARNT pathway was preferentially active in samples from patients with Basal breast cancer. Increased HIF-1α pathway activation in this setting could reflect a high level of intratumoral hypoxia in Basal breast tumors compared to other subtypes. However, our results show that the hypoxia gene signature was enhanced in sub-confluent cultures of Basal subtype breast cancer cells without the exposure of the cells to hypoxic conditions. Our findings are corroborated in a study that molecularly profiled a large panel of breast cancer cell lines and identified high HIF pathway activation in triple negative breast cancer cells by gene set enrichment analysis (49). Increased HIF-1α protein levels have also been noted in Basal subtype cell lines compared to luminal cells grown under well-oxygenated conditions (50). We note that we did not see increased HIF1α or HIF2α mRNA levels in Basal compared to Luminal breast cancer cells suggesting a transcription-independent mechanism.
This highlights the need to determine how HIF pathway activation is maintained even in the presence of oxygen. One recent report suggests that TNBC cells have higher endogenous levels of HIF-1α due to a paracrine signaling mechanism that involves glutamate secretion (50). Glutamate production in turn inhibits the glutamate-cystine antiporter, xCT, lowering intracellular cysteine levels. Decreased intracellular cysteine levels inhibit the HIF prolyl-hydroxylases leading to HIF1α stabilization (50). Even though many Basal cell lines do have a high endogenous level of HIF-inducible genes under well oxygenated conditions, it is important to note that the expression of hypoxia inducible genes can be further increased upon exposure to hypoxia. Future studies are warranted to identify whether and how a ‘hypoxic memory’ may be bestowed upon Basal-like cells and whether HIFs are required to maintain the transcriptional profile. Our previously reported data (38,39,51), and data from Figure 6 show that the knockout of HIF-1 causes a reduction in the genes that were studied in unexposed cells, suggesting a role for HIFs in the maintenance of hypoxia-induced transcription patterns.
HIF mediates the conserved response to hypoxia
Although, many HIF-dependent and independent pathways regulate the response to hypoxic conditions, our study suggests that HIFs mediate the most highly conserved response. For example, of the 42 most conserved transcripts identified among the 31 cell lines, 37 have been validated as HIF-1α or HIF-2α-dependent, the remaining 5 transcripts correspond to long-coding RNAs or pseudogenes that have yet to be studied. In addition, we did not find a single gene with a conserved repression upon exposure to hypoxia among the cell lines tested. This is in keeping with two recent genome-wide analyses that have suggested that both HIF-1α and HIF-2α mainly function as transcriptional activators and not as repressors (12,13). Not surprisingly, many of the genes that are induced by hypoxia but that are unique to a handful of cell lines are also controlled by HIF regulation. Any number of mechanisms may alter the specific genes that are regulated by hypoxia in a given cell line. For example, HIFs interact with an extensive list of proteins and their expression level and association with HIFs may impact the level of response of some transcripts. Furthermore, tumor hypoxia also causes DNA hypermethylation. A recent study shows that loss of oxygen-dependent ten-eleven translocation (TET) enzymes increases hypermethylation at gene promoters in vitro (52), suggesting that promoter methylation may likely result in differences in gene expression under hypoxia between cell lines This is consistent with our finding that cells lines classified as Normal-like had the strongest response to hypoxic conditions and the most overlap with each subtype. Additionally, HIF-1α has been reported to alter nucleosome structure in a HIF-dependent manner and this appears to vary by promoter (53). Moreover, expression of genes for histone demethylases, including JMJD1A (KDM3A, demethylase for Lys9 of histone H3 [H3K9]) are induced by HIFs may also dictate cell specific responses to hypoxia.
CASP14, TCAF2, FUT11, and DNAH11 are novel HIF-1α dependent hypoxia inducible genes
Our study revealed four novel HIF-regulated genes: CASP14, TCAF2, FUT11, and DNAH11. We identified three HIF-1α binding sites in the 5’ UTR of the CASP14 gene. Interestingly, CASP14 expression has been associated with triple negative phenotypes and was recently shown to be a breast cancer stem cell marker (54). CASP14 has also been implicated as a gene found in brain-metastatic compared to non-brain metastatic breast cancer (55). FUT11 has been shown to be a potential biomarker of clear cell renal cell carcinoma progression based on meta-analysis of gene expression data (56), which may reflect VHL-dependent HIF activation. Further investigation into the functional consequences of the upregulation of these novel HIF-1 regulated genes may reveal additional insight into the role hypoxia in breast cancer progression and metastasis.
Supplementary Material
Implications.
RNA sequencing of 31 breast cancer cells exposed to control or hypoxic conditions reveals a conserved genomic signature that contains novel HIF-regulated genes and is prognostic for the survival of TNBC patients.
Acknowledgements
The authors would like to thank their funding sources for their support: Work in the Gilkes lab is supported by U54-CA210173, R00-CA181352, V Scholar Foundation, Susan G. Komen Foundation (CCR17483484), The Jayne Koskinas Ted Giovanis Foundation for Health and Policy and the Breast Cancer Research Foundation. Work in the Fertig lab is supported by the Experimental and Computational Genomics Core (ECGC) of the Sidney Kimmel Comprehensive Cancer Center (P30CA006973). We also would like to thank João Brás, Seung Yeon Choi, Grace Kim, Jisu Shin, and Daniel Shade for support in the lab that aided in this project. We thank Dr. Ludmila Danilova for providing the TCGA data for analysis and Dr. Gregg Semenza, MD, PhD, Dr. Ben Ho Park, MD, PhD, and Dr. Sarawati Sukumar for careful reading and suggestions for this manuscript.
Footnotes
The authors declare no conflict of interest.
References
- 1.Dewhirst MW. Intermittent hypoxia furthers the rationale for hypoxia-inducible factor-1 targeting. Cancer Res 2007;67(3):854–5. [DOI] [PubMed] [Google Scholar]
- 2.Brahimi-Horn MC, Chiche J, Pouyssegur J. Hypoxia and cancer. J Mol Med 2007;85(12):1301–7. [DOI] [PubMed] [Google Scholar]
- 3.Semenza GL, Ruvolo PP. Introduction to tumor microenvironment regulation of cancer cell survival, metastasis, inflammation, and immune surveillance. Biochim Biophys Acta 2016;1863(3):379–81. [DOI] [PubMed] [Google Scholar]
- 4.Gillies RJ, Gatenby RA. Hypoxia and adaptive landscapes in the evolution of carcinogenesis. Cancer Metastasis Rev 2007;26(2):311–7. [DOI] [PubMed] [Google Scholar]
- 5.Bos R, van der Groep P, Greijer AE, Shvarts A, Meijer S, Pinedo HM, et al. Levels of hypoxia-inducible factor-1α independently predict prognosis in patients with lymph node negative breast carcinoma. Cancer 2003;97(6):1573–81. [DOI] [PubMed] [Google Scholar]
- 6.Schindl M, Schoppmann SF, Samonigg H, Hausmaninger H, Kwasny W, Gnant M, et al. Overexpression of hypoxia-inducible factor 1α is associated with an unfavorable prognosis in lymph node-positive breast cancer. Clin Cancer Res 2002;8(6):1831–7. [PubMed] [Google Scholar]
- 7.Turashvili G, Brogi E. Tumor Heterogeneity in Breast Cancer. Frontiers in Medicine 2017;4:227. [DOI] [PMC free article] [PubMed] [Google Scholar]
- 8.Gilkes DM. Implications of Hypoxia in Breast Cancer Metastasis to Bone. Int J Mol Sci 2016;17(10). [DOI] [PMC free article] [PubMed] [Google Scholar]
- 9.Wang GL, Jiang BH, Rue EA, Semenza GL. Hypoxia-inducible factor 1 is a basic-helix-loop-helix-PAS heterodimer regulated by cellular O2 tension. Proc Natl Acad Sci U S A 1995;92(12):5510–4. [DOI] [PMC free article] [PubMed] [Google Scholar]
- 10.Tian H, McKnight SL, Russell DW. Endothelial PAS domain protein 1 (EPAS1), a transcription factor selectively expressed in endothelial cells. Genes Dev 1997;11(1):72–82. [DOI] [PubMed] [Google Scholar]
- 11.Harris BH, Barberis A, West CM, Buffa FM. Gene Expression Signatures as Biomarkers of Tumour Hypoxia. Clin Oncol (R Coll Radiol) 2015;27(10):547–60. [DOI] [PubMed] [Google Scholar]
- 12.Schodel J, Oikonomopoulos S, Ragoussis J, Pugh CW, Ratcliffe PJ, Mole DR. High-resolution genome-wide mapping of HIF-binding sites by ChIP-seq. Blood 2011;117(23):e207–17. [DOI] [PMC free article] [PubMed] [Google Scholar]
- 13.Mole DR, Blancher C, Copley RR, Pollard PJ, Gleadle JM, Ragoussis J, et al. Genome-wide Association of Hypoxia-inducible Factor (HIF)-1α and HIF-2α DNA Binding with Expression Profiling of Hypoxia-inducible Transcripts. Journal of Biological Chemistry 2009;284(25):16767–75. [DOI] [PMC free article] [PubMed] [Google Scholar]
- 14.Mimura I, Nangaku M, Kanki Y, Tsutsumi S, Inoue T, Kohro T, et al. Dynamic change of chromatin conformation in response to hypoxia enhances the expression of GLUT3 (SLC2A3) by cooperative interaction of hypoxia-inducible factor 1 and KDM3A. Mol Cell Biol 2012;32(15):3018–32. [DOI] [PMC free article] [PubMed] [Google Scholar]
- 15.Eustace A, Mani N, Span PN, Irlam JJ, Taylor J, Betts GNJ, et al. A 26-Gene Hypoxia Signature Predicts Benefit from Hypoxia-Modifying Therapy in Laryngeal Cancer but Not Bladder Cancer. Clinical Cancer Research 2013;19(17):4879–88. [DOI] [PMC free article] [PubMed] [Google Scholar]
- 16.Neve RM, Chin K, Fridlyand J, Yeh J, Baehner FL, Fevr T, et al. A collection of breast cancer cell lines for the study of functionally distinct cancer subtypes. Cancer Cell 2006;10(6):515–27. [DOI] [PMC free article] [PubMed] [Google Scholar]
- 17.Perou CM, Sorlie T, Eisen MB, van de Rijn M, Jeffrey SS, Rees CA, et al. Molecular portraits of human breast tumours. Nature 2000;406(6797):747–52. [DOI] [PubMed] [Google Scholar]
- 18.Fan C, Oh DS, Wessels L, Weigelt B, Nuyten DS, Nobel AB, et al. Concordance among gene-expression-based predictors for breast cancer. N Engl J Med 2006;355(6):560–9. [DOI] [PubMed] [Google Scholar]
- 19.Curtis C, Shah SP, Chin S-F, Turashvili G, Rueda OM, Dunning MJ, et al. The genomic and transcriptomic architecture of 2,000 breast tumours reveals novel subgroups. Nature 2012;486:346. [DOI] [PMC free article] [PubMed] [Google Scholar]
- 20.Pereira B, Chin S-F, Rueda OM, Vollan H-KM, Provenzano E, Bardwell HA, et al. The somatic mutation profiles of 2,433 breast cancers refine their genomic and transcriptomic landscapes. Nature Communications 2016;7:11479. [DOI] [PMC free article] [PubMed] [Google Scholar]
- 21.The Cancer Genome Atlas N. Comprehensive molecular portraits of human breast tumours. Nature 2012;490:61. [DOI] [PMC free article] [PubMed] [Google Scholar]
- 22.Sorlie T, Perou CM, Tibshirani R, Aas T, Geisler S, Johnsen H, et al. Gene expression patterns of breast carcinomas distinguish tumor subclasses with clinical implications. Proc Natl Acad Sci U S A 2001;98(19):10869–74. [DOI] [PMC free article] [PubMed] [Google Scholar]
- 23.Lehmann BD, Bauer JA, Chen X, Sanders ME, Chakravarthy AB, Shyr Y, et al. Identification of human triple-negative breast cancer subtypes and preclinical models for selection of targeted therapies. The Journal of Clinical Investigation 2011;121(7):2750–67. [DOI] [PMC free article] [PubMed] [Google Scholar]
- 24.Burstein MD, Tsimelzon A, Poage GM, Covington KR, Contreras A, Fuqua SAW, et al. Comprehensive Genomic Analysis Identifies Novel Subtypes and Targets of Triple-Negative Breast Cancer. Clinical Cancer Research 2015;21(7):1688–98. [DOI] [PMC free article] [PubMed] [Google Scholar]
- 25.Marcotte R, Sayad A, Brown Kevin R, Sanchez-Garcia F, Reimand J, Haider M, et al. Functional Genomic Landscape of Human Breast Cancer Drivers, Vulnerabilities, and Resistance. Cell 2016;164(1):293–309. [DOI] [PMC free article] [PubMed] [Google Scholar]
- 26.Parker JS, Mullins M, Cheang MC, Leung S, Voduc D, Vickery T, et al. Supervised risk predictor of breast cancer based on intrinsic subtypes. J Clin Oncol 2009;27(8):1160–7. [DOI] [PMC free article] [PubMed] [Google Scholar]
- 27.Vaupel P, Hockel M, Mayer A. Detection and characterization of tumor hypoxia using pO2 histography. Antioxid Redox Signal 2007;9(8):1221–35. [DOI] [PubMed] [Google Scholar]
- 28.Gyorffy B, Lanczky A, Eklund AC, Denkert C, Budczies J, Li Q, et al. An online survival analysis tool to rapidly assess the effect of 22,277 genes on breast cancer prognosis using microarray data of 1,809 patients. Breast Cancer Res Treat 2010;123(3):725–31. [DOI] [PubMed] [Google Scholar]
- 29.Patro R, Duggal G, Love MI, Irizarry RA, Kingsford C. Salmon provides fast and bias-aware quantification of transcript expression. Nature Methods 2017;14:417. [DOI] [PMC free article] [PubMed] [Google Scholar]
- 30.Soneson C, Love MI, Robinson MD. Differential analyses for RNA-seq: transcript-level estimates improve gene-level inferences. F1000Research 2015;4:1521. [DOI] [PMC free article] [PubMed] [Google Scholar]
- 31.Gao J, Aksoy BA, Dogrusoz U, Dresdner G, Gross B, Sumer SO, et al. Integrative Analysis of Complex Cancer Genomics and Clinical Profiles Using the cBioPortal. Science signaling 2013;6(269):pl1–pl. [DOI] [PMC free article] [PubMed] [Google Scholar]
- 32.Love MI, Huber W, Anders S. Moderated estimation of fold change and dispersion for RNA-seq data with DESeq2. Genome Biology 2014;15(12):550. [DOI] [PMC free article] [PubMed] [Google Scholar]
- 33.Gu Z, Eils R, Schlesner M. Complex heatmaps reveal patterns and correlations in multidimensional genomic data. Bioinformatics 2016;32(18):2847–9. [DOI] [PubMed] [Google Scholar]
- 34.Liberzon A, Birger C, Thorvaldsdottir H, Ghandi M, Mesirov JP, Tamayo P. The Molecular Signatures Database (MSigDB) hallmark gene set collection. Cell systems 2015;1(6):417–25. [DOI] [PMC free article] [PubMed] [Google Scholar]
- 35.Wenger RH, Stiehl DP, Camenisch G. Integration of oxygen signaling at the consensus HRE. Science’s STKE : signal transduction knowledge environment 2005;2005(306):re12. [DOI] [PubMed] [Google Scholar]
- 36.Ritchie ME, Phipson B, Wu D, Hu Y, Law CW, Shi W, et al. limma powers differential expression analyses for RNA-sequencing and microarray studies. Nucleic Acids Research 2015;43(7):e47–e. [DOI] [PMC free article] [PubMed] [Google Scholar]
- 37.Sanjana NE, Shalem O, Zhang F. Improved vectors and genome-wide libraries for CRISPR screening. Nat Methods 2014;11(8):783–4. [DOI] [PMC free article] [PubMed] [Google Scholar]
- 38.Ju JA, Godet I, Ye IC, Byun J, Jayatilaka H, Lee SJ, et al. Hypoxia Selectively Enhances Integrin alpha5beta1 Receptor Expression in Breast Cancer to Promote Metastasis. Mol Cancer Res 2017;15(6):723–34. [DOI] [PMC free article] [PubMed] [Google Scholar]
- 39.Gilkes DM, Chaturvedi P, Bajpai S, Wong CC, Wei H, Pitcairn S, et al. Collagen prolyl hydroxylases are essential for breast cancer metastasis. Cancer research 2013;73(11):3285–96. [DOI] [PMC free article] [PubMed] [Google Scholar]
- 40.Tracy K, Dibling BC, Spike BT, Knabb JR, Schumacker P, Macleod KF. BNIP3 is an RB/E2F target gene required for hypoxia-induced autophagy. Mol Cell Biol 2007;27(17):6229–42. [DOI] [PMC free article] [PubMed] [Google Scholar]
- 41.Semenza GL. Transcriptional regulation by hypoxia-inducible factor 1 molecular mechanisms of oxygen homeostasis. Trends Cardiovasc Med 1996;6(5):151–7. [DOI] [PubMed] [Google Scholar]
- 42.Kaelin WG Jr., Ratcliffe PJ. Oxygen sensing by metazoans: the central role of the HIF hydroxylase pathway. Mol Cell 2008;30(4):393–402. [DOI] [PubMed] [Google Scholar]
- 43.Kim J-w, Tchernyshyov I, Semenza GL, Dang CV. HIF-1-mediated expression of pyruvate dehydrogenase kinase: A metabolic switch required for cellular adaptation to hypoxia. Cell Metabolism 2006;3(3):177–85. [DOI] [PubMed] [Google Scholar]
- 44.Hunter FW, Wouters BG, Wilson WR. Hypoxia-activated prodrugs: paths forward in the era of personalised medicine. British Journal of Cancer 2016;114(10):1071–7. [DOI] [PMC free article] [PubMed] [Google Scholar]
- 45.Vaupel P. Prognostic potential of the pre-therapeutic tumor oxygenation status. Adv Exp Med Biol 2009;645:241–6. [DOI] [PubMed] [Google Scholar]
- 46.Vaupel P. Hypoxia and aggressive tumor phenotype: implications for therapy and prognosis. Oncologist 2008;13 Suppl 3:21–6. [DOI] [PubMed] [Google Scholar]
- 47.Overgaard J, Eriksen JG, Nordsmark M, Alsner J, Horsman MR. Plasma osteopontin, hypoxia, and response to the hypoxia sensitiser nimorazole in radiotherapy of head and neck cancer: results from the DAHANCA 5 randomised double-blind placebo-controlled trial. Lancet Oncol 2005;6. [DOI] [PubMed] [Google Scholar]
- 48.Tatum JL, Kelloff GJ, Gillies RJ, Arbeit JM, Brown JM, Chao KS, et al. Hypoxia: importance in tumor biology, noninvasive measurement by imaging, and value of its measurement in the management of cancer therapy. Int J Radiat Biol 2006;82(10):699–757. [DOI] [PubMed] [Google Scholar]
- 49.Kao J, Salari K, Bocanegra M, Choi Y-L, Girard L, Gandhi J, et al. Molecular Profiling of Breast Cancer Cell Lines Defines Relevant Tumor Models and Provides a Resource for Cancer Gene Discovery. PLoS ONE 2009;4(7):e6146. [DOI] [PMC free article] [PubMed] [Google Scholar]
- 50.Briggs Kimberly J, Koivunen P, Cao S, Backus Keriann M, Olenchock Benjamin A, Patel H, et al. Paracrine Induction of HIF by Glutamate in Breast Cancer: EglN1 Senses Cysteine. Cell 2016;166(1):126–39. [DOI] [PMC free article] [PubMed] [Google Scholar]
- 51.Wong CC, Zhang H, Gilkes DM, Chen J, Wei H, Chaturvedi P, et al. Inhibitors of hypoxia-inducible factor 1 block breast cancer metastatic niche formation and lung metastasis. J Mol Med (Berl) 2012;90(7):803–15. [DOI] [PMC free article] [PubMed] [Google Scholar]
- 52.Thienpont B, Steinbacher J, Zhao H, D’Anna F, Kuchnio A, Ploumakis A, et al. Tumour hypoxia causes DNA hypermethylation by reducing TET activity. Nature 2016;537(7618):63–8. [DOI] [PMC free article] [PubMed] [Google Scholar]
- 53.Tojo Y, Sekine H, Hirano I, Pan X, Souma T, Tsujita T, et al. Hypoxia Signaling Cascade for Erythropoietin Production in Hepatocytes. Mol Cell Biol 2015;35(15):2658–72. [DOI] [PMC free article] [PubMed] [Google Scholar]
- 54.Handa T, Katayama A, Yokobori T, Yamane A, Horiguchi J, Kawabata-Iwakawa R, et al. Caspase14 expression is associated with triple negative phenotypes and cancer stem cell marker expression in breast cancer patients. J Surg Oncol 2017;116(6):706–15. [DOI] [PubMed] [Google Scholar]
- 55.Schulten H-J, Bangash M, Karim S, Dallol A, Hussein D, Merdad A, et al. Comprehensive molecular biomarker identification in breast cancer brain metastases. Journal of Translational Medicine 2017;15:269. [DOI] [PMC free article] [PubMed] [Google Scholar]
- 56.Zodro E, Jaroszewski M, Ida A, Wrzesinski T, Kwias Z, Bluyssen H, et al. FUT11 as a potential biomarker of clear cell renal cell carcinoma progression based on meta-analysis of gene expression data. Tumour Biol 2014;35(3):2607–17. [DOI] [PMC free article] [PubMed] [Google Scholar]
Associated Data
This section collects any data citations, data availability statements, or supplementary materials included in this article.