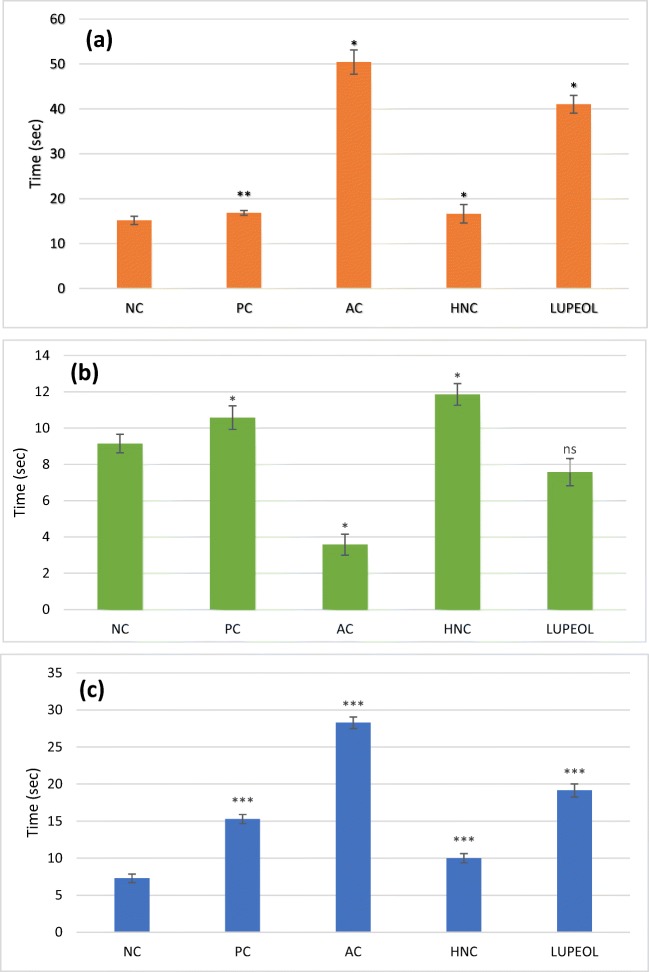
Fig. 5.
Morris Water Maze (MWM) test (a) Time to reach the platform zone (b) Time in the platform quadrant (c) Latency to first entry in the platform quadrant. Where “NC” is normal control, “PC” is positive control (Rivastigmine), “AC” is Alzheimer control and “HNC” is H. nepalensis crude extract. Values are * or ** p < 0.05 and *** p < 0.01 statistically significant as compared to diabetic control group expressed as means ± SEM whereas NS represents non-significant

