Abstract
Background
Myeloid-derived suppressor cells (MDSCs) is a heterogeneous population of immature myeloid cells, inhibiting both the innate and adaptive immunity. Recent studies validated that MDSCs caused immune suppression and promoted cancer progression through various mechanisms. However, the prognostic value of MDSCs in cancer remains controversial.
Methods
Here, we performed this meta-analysis to evaluate the prognostic value of MDSCs in various types of cancer. The electric databases, such as Pubmed, Embase and Web of Science, were searched for relevant publications. Hazards ratios (HRs) with the corresponding 95% confidence intervals (95%CIs) were calculated to evaluate the prognostic role of MDSCs in cancer.
Results
A total of 16 studies with 1864 patients were enrolled in our meta-analysis. Elevated MDSCs frequency was shown to be associated with shorter overall survival (OS) (HR = 2.46, 95%CI: 1.87–3.23), and poor disease-free survival / recurrence-free survival (DFS / RFS) (HR = 3.26, 95%CI: 2.10–5.04) after treatment. Furthermore, similar results were also observed in the stratified subgroup analysis, which included the analysis by region, sample size, cancer type, NOS scores, subtype and cut-off value of MDSCs.
Conclusion
High MDSCs might be related to poor clinical outcomes of patients with cancer, that is, MDSCs might be a potential prognostic biomarker in cancer.
Keywords: Myeloid derived suppressor cells, Meta-analysis, Prognosis
Background
Cancers have become the most frequent cause of death worldwide due to rapid progress, with approximately 1650 Americans per day estimated to die in 2017. Generally, therapies including chemotherapy, radiotherapy, surgical resection and immunotherapy were applied to treat different types of cancers [1], resulting in an overall drop of 25% in cancer death rates over 2 decades. However, the prognosis of most cancers remains poor. Recent findings have validated the importance of immunosuppressive network in the carcinogenesis and progression via suppressing antitumor immune system, thus leading to tumor invasion [2]. And there are rising studies on the clinical significance of immunosuppressive parameters in various cancers.
Myeloid-derived suppressor cells (MDSCs), a heterogeneous population of immature myeloid cells, are well-known to suppress both innate and adaptive immunity. The most common phenotype of MDSCs can be characterized as CD11b+CD33+HLA-DR−/low, which include monocytic CD14+CD15− and granulocytic CD14−CD15+ subtypes [3]. In cancer patients, MDSC expansion inhibits T cell proliferation, decreases cytokines secretion, and recruiting regulatory T cells, etc., thus hampering the host anti-tumor immune response [3–7].
Currently, accumulating studies have investigated the role of MDSCs in both solid tumor and hematologic malignances, and MDSCs was found to be an independent prognostic factor in melanoma [8, 9], gastrointestinal (GI) cancers [10–12], NK/T lymphoma [13], bladder cancer [14] and so on. However, increasing researches referring to MDSCs and cancer questioned the reliability of MDSCs acting as a prognostic biomarker in various malignancies [15, 16]. Here, a meta-analysis was first performed to estimate the correlation between MDSCs and the survival outcomes of cancer patients, providing a basis for the predicting role of MDSCs in the various cancers.
Methods
Search strategy
A systematic search was conducted in 3 electric databases including PubMed (Medline), ISI Web of Science, and Ovid (EMBASE) databases. All relevant publications were picked out until January 2018. The search strategies are as following: “MDSC” (e.g. “Myeloid-derived suppressor cells”), “prognosis” (e.g. “survival” “mortality” “outcome”) and “cancer” (e.g. “tumor” “carcinoma” “neoplasm” “leukemia” “lymphoma” “myeloma”). Furthermore, the reference lists of retrieved studies were also checked to find more studies.
Selection criteria
The inclusion criteria of this meta-analysis were: (1) Patients were histopathologically diagnosed with cancer; (2) Association between the pretreatment MDSCs level and clinicopathological parameters including OS, PFS, etc. was reported; (3) Studies were also allowed if we could reconstruct HRs and 95%CIs from the Kaplan-Meier survival curves or by other methods reported [17]. Exclusion criteria of this meta-analysis were: (1) conference abstracts, case reports, reviews, etc.; (2) publications with insufficient information for meta-analysis; (3) multiple published reports. We enrolled the most recent publication concerning the same cohort in our meta-analysis.
Data extraction
Two reviewers (Shidai Mu and Yadan Wang) independently screened the studies for eligibility. Two reviewers (Lisha Ai and Yu Hu) evaluated the quality, and extracted the data from eligible studies. The Newcastle–Ottawa Quality Assessment Scale (NOS) was applied to assess the quality of the include studies [18]. Studies which got ≥ 7 in the NOS were assigned as high-quality. A predefined table was used to list the following relevant data: (1) characteristics of each study, such as the first author’s name, sample size, the country in which the study was carried out, year of publication, age of patients, gender, and follow-up period; (2) survival data including OS, and DFS/RFS (OS was defined as the length of time from either the date of diagnosis or the start of treatment for a disease until the death of patient or the last follow-up. DFS / RFS was defined as the length of time after primary treatment for a cancer until the patient survived without any signs or symptoms of that cancer); (3) cut-off value defining “elevated MDSCs”.
Statistical analysis
Hazard ratio (HR) and 95% confidence intervals (95%CIs) were mostly extracted from the reports of studies, otherwise we estimates HRs and 95CIs according to the methods published by Parmer et al. [17]. The χ2-based Q test and I2 test were used to check the heterogeneity among included studies [19]. We used the fixed-effect model for analysis if no significant heterogeneity was found between studies (p > 0.10, I2 < 30%). The source of heterogeneity was further explored by subgroup analysis and galbraith plots.
A sensitivity analysis was performed to to determine which parameters have the greatest impact on the overall results. Result was regarded to be significant when p < 5%. The Begg’s funnel plot was used to assess publication bias. And the trim and fill analysis was performed when the possibility of publication bias was significant. All analyses were carried out using STATA statistical software 14.0 (STATA, College Station, TX).
Results
Selection and characteristics of the included studies
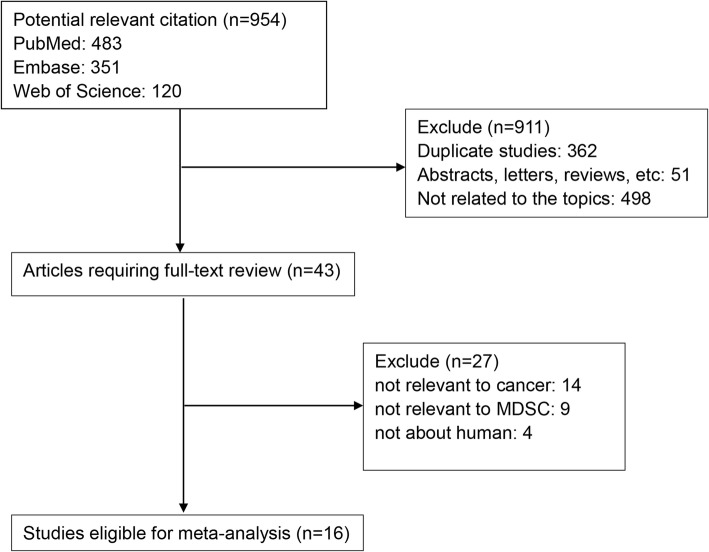
As shown in Fig. 1, a total of 954 studies were retrieved with our search algorithm. After excluding the duplicates (n = 362); abstracts, case reports, reviews, etc. (n = 51); and other unrelated studies (n = 498), the rest studies (n = 43) were then assessed by reading the full text. Additional studies without specific data concerning cancer (n = 14) nor MDSCs (n = 9) or not about human (n = 4) were also excluded,. Therefore, 16 studies between 2011 and 2017 with a total of 1864 cancer patients were enrolled in this meta-analysis.
Fig. 1.
Flow diagram of selecting relevant studies included in the meta-analysis
Table 1 showed the summary on the characteristics of the included studies. Thirteen studies were from the eastern region and six from the western region. Seven studies enrolled < 50 patients, 12 studies had > 50 patients. Nine studies were of high quality because NOS score was above 7. Nineteen studies had data for OS, 3 studies for RFS, and 3 studies for DFS. Additionally, three articles reported the different MDSCs levels in patients before and after therapy.
Table 1.
Characteristics of studies included in the meta-analysis
| Study | Year | Country | Sample size | Cancer types | Phenotype | Cut-off | Age | Follow-up (month) | NOS scores | Survival analysis |
|---|---|---|---|---|---|---|---|---|---|---|
| Zhang, Y | 2017 | China | 76 | rectal carcinoma | HLA-DR−CD33+CD11b+ | 3.68 | NA | NA | 5 | OS |
| Yang, G | 2017 | China | 113 | bladder cancer | HLA-DR−CD33lowCD11b+CD3− | 21 | 66.5 (45–84) | 43 (4–60) | 6 | OS |
| Gao, X.H | 2017 | China | 183 | HCC | HLA-DR-/lowCD14− | 2.31 | NA | 24 (1.3–28.8) | 6 | OS, RFS |
| Wang, D1 | 2016 | China | 92 | HCC | HLA-DR-/lowCD14− | 14.6 | NA | NA | 6 | OS |
| Wang, D2 | 2016 | China | 92 | HCC | HLA-DR-/lowCD14− | 14.6 | NA | NA | 6 | OS |
| Choi, H.S | 2016 | Korea | 28 | GC | HLA-DR−CD11b+CD14+CD45+ | 2.2 | 37–88 | 29 (10–42) | 8 | OS, DFS |
| Zhang, H1 | 2015 | China | 32 | NK/T lymphoma | HLA-DR−CD33+CD11b+ | 1.1 | 40.5 (17–70) | 52 | 7 | OS, DFS |
| Zhang, H2 | 2015 | China | 32 | NK/T lymphoma | HLA-DR−CD33+CD11b+CD14+ | 0.7 | NA | NA | 7 | OS, DFS |
| Yuan, L1 | 2015 | China | 64 | rectal carcinoma | Lin−HLA-DR−CD33+CD11b+ | 3.78 | 62 (38–76) | 72 | 5 | OS |
| Yuan, L2 | 2015 | China | 64 | rectal carcinoma | Lin−HLA-DR−CD33+CD11b+ | 2.11 | NA | NA | 5 | OS |
| Tian, T | 2015 | China | 42 | small-cell lung cancer | HLA-DR-/lowCD14− | 21.7 | 62.4 | 36 | 6 | OS |
| Jiang, H | 2015 | Germany | 51 | advanced melanoma | HLA-DR−CD11b+CD14+CD15− | 2.3 | 61.26 (33–88) | 7 | 8 | OS |
| Huang, H | 2015 | China | 78 | ESCC | HLA-DR-/lowCD14− | 2.38 | 62.4 (46–77) | 42 | 7 | OS |
| Chevolet, I | 2015 | Belgium | 69 | melanoma | Lin−HLA-DR−CD33+CD11b+ | 4.13 | NA | 39 | 7 | OS |
| Weide, B | 2014 | Australia | 94 | advanced melanoma | HLA-DR-/lowCD11b+CD14+ | 11 | NA | 15 | 9 | OS |
| Wang, L | 2013 | Singapore | 40 | GC | Lin−HLA-DR−CD33+ | 4 | NA | NA | 7 | OS |
| Arihara, F1 | 2013 | Japan | 123 | HCC | HLA-DR-/lowCD14− | 22 | NA | NA | 7 | RFS-U |
| Arihara, F2 | 2013 | Japan | 123 | HCC | HLA-DR-/lowCD14− | 22 | NA | NA | 7 | RFS-U, RFS-M |
| Solito, S1 | 2011 | Italy | 25 | colorectal cancer | Lin−HLA-DR−CD33+CD11b+ | 2.54 | NA | NA | 9 | OS |
| Solito, S2 | 2011 | Italy | 26 | bresat cancer | Lin−HLA-DR−CD33+CD11b+ | 3.17 | NA | NA | 9 | OS |
| Gabitass, R.F | 2011 | UK | 256 | pancreatic, esophageal and gastric cancer | Linlow/-HLA-DR−CD33+CD11b+ | 2 | NA | NA | 7 | OS |
HCC hepatocelluar carcinoma, GC gastric cancer, ESCC esophageal squamous cell carcinoma
NA not applicable, NOS the Newcastle–Ottawa Quality Assessment Scale
OS overall survival, DFS disease-free survival, RFS recurrence-free survival, U&M univariate & multivariate survival analysis
Association between MDSCs and survival of cancer patients
Nineteen studies examined the correlation between MDSCs and survival of cancer patients. With significant heterogeneity (χ2 = 46.5, p < 0.01; I2 = 61.3%), the pooled HR 2.46 (95%CI: 1.87–3.23) indicated that cancer patients with higher MDSCs frequency might have shorter OS (Fig. 2). The combined HR was 2.42 (95%CI: 1.42, 4.12) from the results of multivariate analysis, indicating that MDSCs was an independent prognostic factor of OS in cancer patients.
Fig. 2.
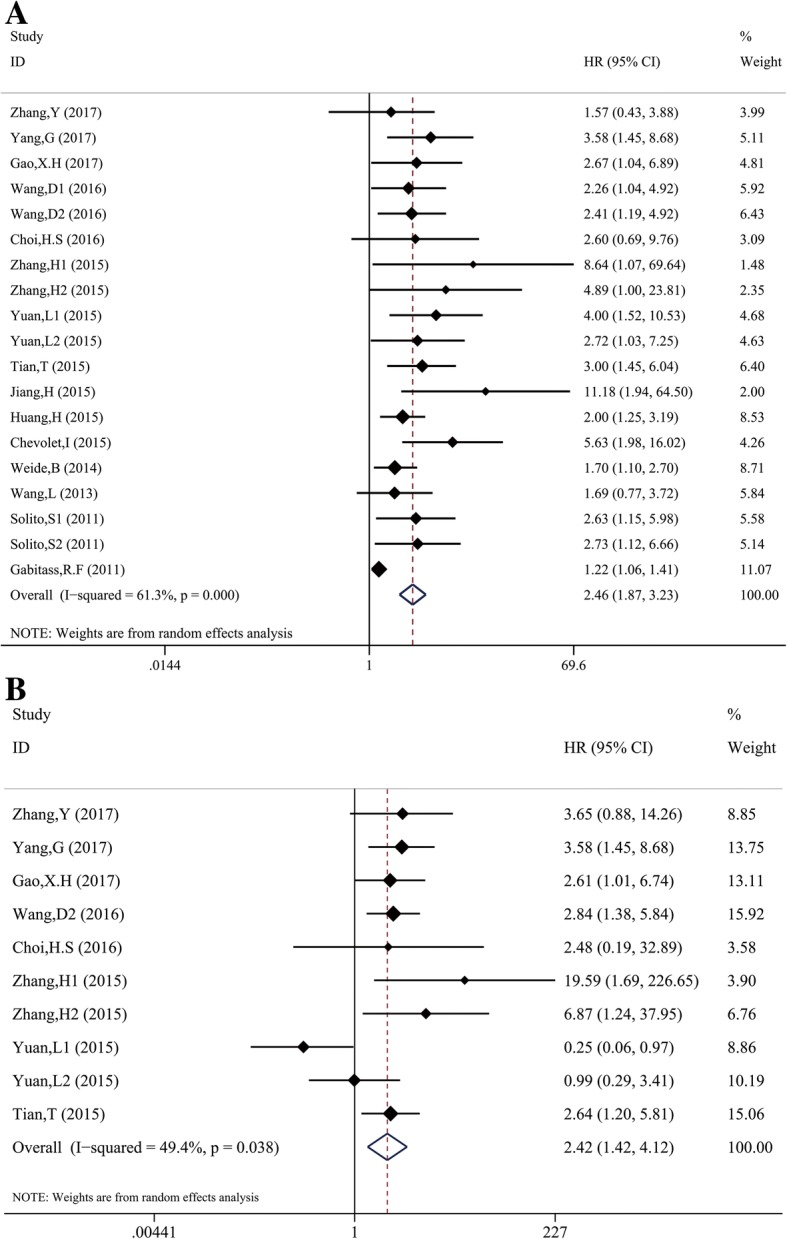
Meta-analysis of the association between elevated MDSC and OS in cancer. a Univariate analysis, b Multivariate analysis
Subgroup analysis was stratified by the region, sample size, cancer types, subtypes of MDSCs, cut-off value defining elevated MDSCs and NOS score, in order to explore the source of heterogeneity. As shown in Table 2, the subgroup analysis did not change the prognostic effects of MDSCs in predicting the OS of cancer patients.
Table 2.
Subgroup analysis for overall survival in cancer patients with higher MDSCs
| Subgroup analysis | No. of studies | No. of patients | Pooled HR(95%CI) | Heterogeneity | ||
|---|---|---|---|---|---|---|
| Fixed | Random | I2 | p-value | |||
| Region | ||||||
| Eastern | 13 | 936 | 2.47 (1.95,3.12) | 2.47 (1.95,3.12) | 0% | 0.892 |
| Western | 6 | 521 | 1.35 (1.18,1.54) | 2.37 (1.41,3.97) | 75.8% | 0.001 |
| Sample size | ||||||
| <50 | 7 | 225 | 2.67 (1.85,3.84) | 2.67 (1.85,3.84) | 0% | 0.786 |
| ≥50, < 100 | 9 | 680 | 2.26 (1.78,2.88) | 2.37 (1.78,3.14) | 18.9% | 0.275 |
| ≥100 | 3 | 552 | 1.27 (1.11,1.46) | 2.04 (0.95,4.37) | 74.5% | 0.020 |
| Cancer types | ||||||
| GI cancers | 8 | 631 | 1.36 (1.20,1.55) | 1.92 (1.36,2.72) | 54.2% | 0.033 |
| HCC | 3 | 367 | 2.41 (1.53,3.82) | 2.41 (1.53,3.82) | 0% | 0.965 |
| NKT | 2 | 64 | 6.02 (1.70,21.28) | 6.02 (1.70,21.28) | 0% | 0.670 |
| Melanoma | 3 | 214 | 2.24(1.50,3.35) | 3.87 (1.24,12.04) | 73.9% | 0.022 |
| Other types | 3 | 181 | 3.07 (1.91,4.92) | 3.07 (1.91,4.92) | 0% | 0.912 |
| Subtypes | ||||||
| Total-MDSCs | 10 | 765 | 1.40 (1.23,1.60) | 2.53 (1.63,3.94) | 68.4% | 0.001 |
| PMN-MDSCs | 5 | 487 | 2.32 (1.73,3.13) | 2.32 (1.73,3.13) | 0% | 0.912 |
| Mo-MDSCs | 4 | 205 | 2.08 (1.40,3.11) | 2.95 (1.34,6.51) | 45.9% | 0.136 |
| Cut-off value | ||||||
| <10 | 14 | 1024 | 1.46 (1.29,1.66) | 2.56 (1.79,3.67) | 64.3% | 0.001 |
| ≥10 | 5 | 433 | 2.23 (1.67,2.98) | 2.23 (1.67,2.98) | 0% | 0.527 |
| NOS score | ||||||
| <7 | 10 | 901 | 2.59 (2.02,3.31) | 2.59 (2.02,3.31) | 0% | 0.770 |
| ≥7 | 9 | 556 | 2.17 (1.45,3.25) | 1.36 (1.19,1.55) | 60.5% | 0.009 |
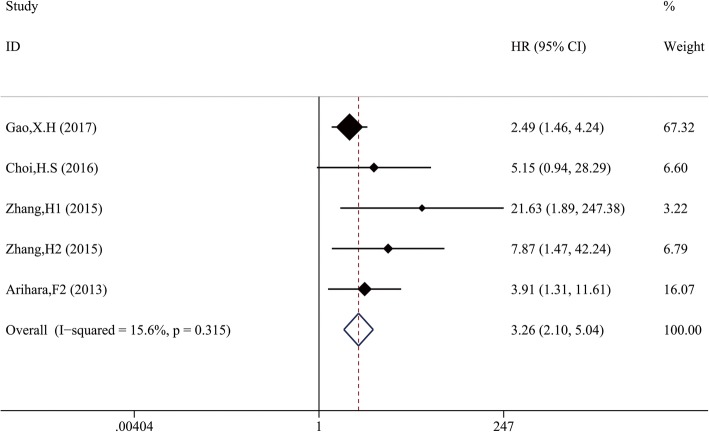
Furthermore, 306 patients from 2 studies reported RFS and 92 patients from 3 studies reported DFS. Significant correlation between high MDSCs and shorter RFS/DFS (HR 3.66, 95%CI: 2.10–6.37) was shown with low heterogeneity (χ2 = 4.74, p = 0.315; I2 = 15.6%) (Fig. 3). Because multivariate survival analysis was applied in these trails above, our combined HR and 95%CIs further validated the independent prognostic role of MDSCs in predicting RFS and DFS.
Fig. 3.
Meta-analysis of the association between elevated MDSCs and DFS/RFS in cancer
Sensitivity analyses
As shown in Fig. 4, one study from Gabitass, R.F et al., 2011 affected the results obviously, which was possibly the main origin of heterogeneity to some extent. After delete this study, the pooled HR was 2.43 (95%CI: 2.01–2.94) for OS with no significant heterogeneity (χ2 = 14.39, p = 0.639; I2 = 0%), indicating the robustness of our results.
Fig. 4.
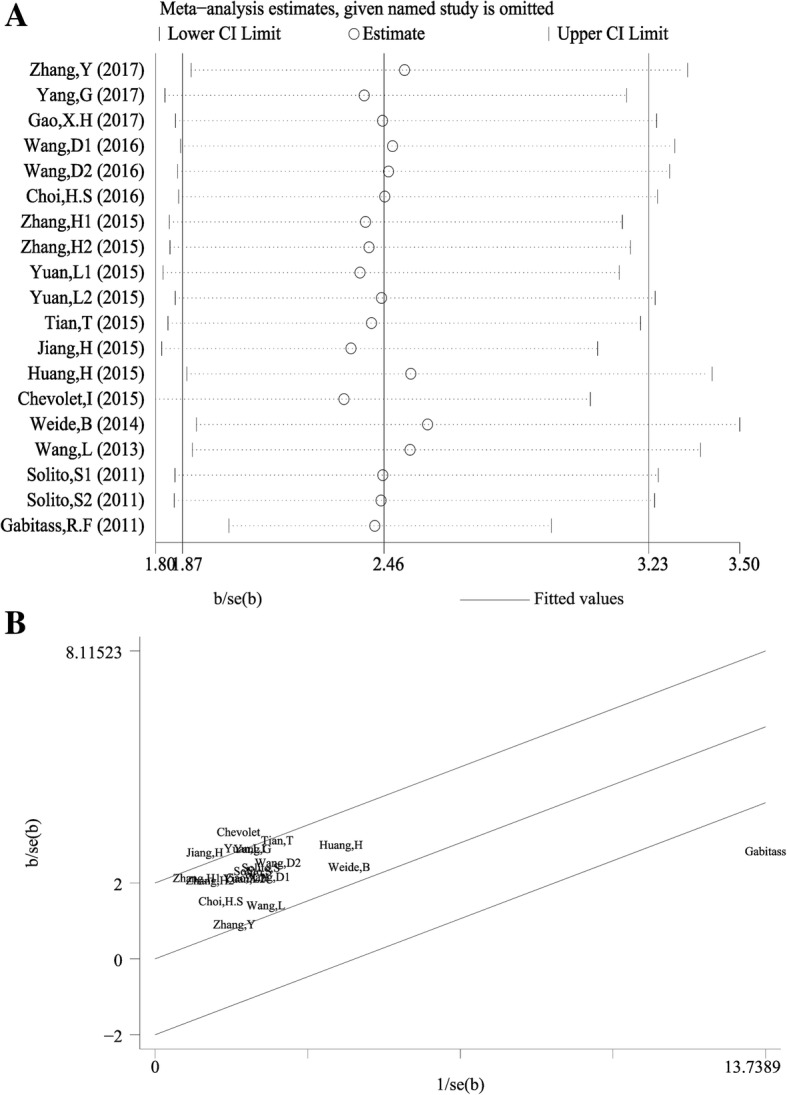
Sensitivity analysis of the enrolled studies. a Influence analysis, b Galbraith plot
Publication bias
Begg’s test was performed to estimate the publication bias of the studies in this meta-analysis. The study of Gabitass, R.F et al., 2011 was excluded based on the results of sensitivity analysis. The asymmetric funnel plot (Fig. 5a) and the result of Begg’s test (p < 0.0001) indicated the possibility of publication bias. Thus, the trim and fill method was performed, and the pooled HR of 2.19 (95%CI: 1.78–2.69) remained statistically significant (Fig. 5b).
Fig. 5.
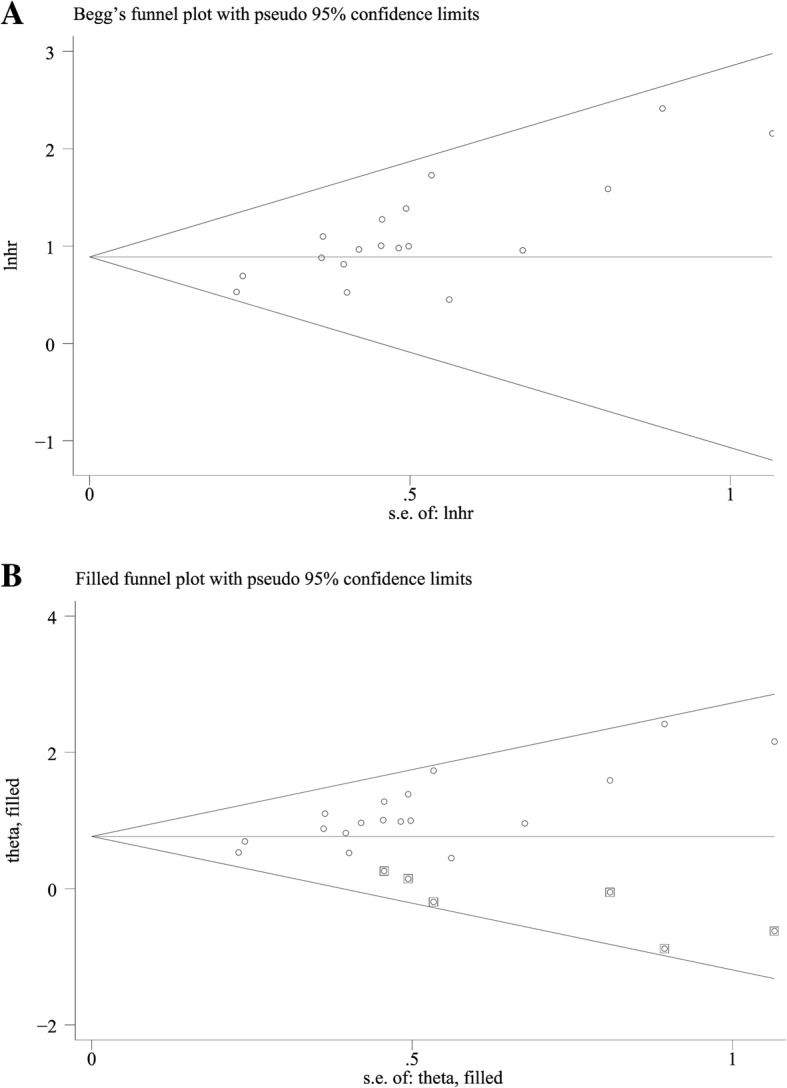
Publication bias of the enrolled studies. a Funnel plot, b Trim and fill method
Discussion
Numerous studies have stressed the biological importance of tumor microenvironment in carcinogenesis and progression. Previous studies have lay solid foundation on the association between increased MDSCs level and poor prognosis in various types of tumor, including melanoma [8, 9], GI cancers [10–12], NK/T lymphoma [13], bladder cancer [14], small cell lung cancer [20], etc. However, results of these studies are not comparable, owing to the different design, patient population, and therapeutic strtegies, and the diversity in cut-off value defining “elevated MDSCs”. Our meta-analysis presented here was the first study assessing the association between elevated MDSCs level and prognosis in cancers, including solid tumors, as well as hematological malignancies. Sixteen trials with a total of 1864 patients were included in this meta-analysis. The combined data indicated that elevated MDSCs level was significantly associated with shorter OS, and poor DFS/RFS of patients with various cancers.
Obvious heterogeneity existed among the included studies in our meta-analysis (I2 = 61.3%, P < 0.01). Subgroup analyses were conducted to find out the source of heterogeneity. The heterogeneity for OS decreased in the subgroup analysis based on cancer types. It implied that cancer types might contribute to heterogeneity to some extent. Moreover, the sensitivity analysis identified the study of Gabitass, R.F et al., 2011 affecting the results obviously. And the heterogeneity decreased after excluding the outlier study.
The complex association between chronic inflammation and tumor development has commenced to be investigated during the last decade [21]. Chronic inflammation is considered to mediate tumor progression via immunosuppression, releasing various cytokines and recruiting several immunosuppressive cells, particularly MDSCs [2, 22]. Recently, several studies have shown that MDSCs are associated with poor progression in solid tumor and hematologic malignancies [8, 11, 23–25]. Mechanically, MDSCs expansion inhibits T cell proliferation, decreasing cytokine secretion, recruiting regulatory T cells, as well as prohibiting natural killer cells (NK cells) activation, thus hampering the host anti-tumor immune response [5, 26, 27]. In addition, MDSCs also exert non-immunological functions by promoting angiogenesis, accelerating tumor invasion, and metastasis [28, 29]. Recently, some studies have explored the direct interaction between MDSCs and tumor cells [7]. Therefore, increased MDSCs frequency might generate a favorable immune microenvironment, contributing to poor prognosis in cancer patients.
It is notable that this meta-analysis has some limitations; therefore cautions are called for interpreting the results. First, only 16 studies were included in this meta-analysis. Besides, the result of Begg’s test indicated the possibility of publication bias. Second, the diversity of cut-off values defining high MDSCs frequency in each study might contribute to heterogeneity among the enrolled studies. Third, some studies did not directly report HR or 95%CI, possibly leading to inaccurate estimation of HR and 95%CI. Forth, differences in paper quality and study design might cause bias to some extent. Fifth, our results might overestimate the prognostic role of MDSCs with positive results from most of the included studies.
Conclusion
Here, several electronic databases, including Pubmed, Embase and Web of Science, were searched for related studies, and 16 studies with 1864 patients were enrolled in the first meta-analysis estimating the association between elevated MDSCs level and survival outcomes of patients with various types of cancers. Taken together, we can draw a conclusion that MDSCs gains a prognostic value for cancer patients. More multi-center prospective cohorts and longer follow-up period are warranted to further validate the prognostic role of the MDSCs in cancer patients.
Acknowledgments
Thanks a lot for the contributions both of the researchers and the study participants.
Funding
Not applicable.
Availability of data and materials
Please contact author for data requests.
Abbreviations
- CI
Confidence interval
- DFS
Disease-free survival
- EFS
Event-free survival
- GI cancers
Gastrointestinal cancers
- HR
Hazards ratios
- MDSCs
Myeloid-derived suppressor cells
- NOS
Newcastle–Ottawa Quality Assessment Scale
- OS
Over survival
- RFS
Recurrence-free survival
Authors’ contributions
SM, and YW collected and analyzed the data; SM, HW, LC and WL analyzed the data and wrote the paper; LA and YH conceived and designed this study, wrote the paper; and all authors reviewed and approved the final manuscript.
Ethics approval and consent to participate
Not applicable.
Consent for publication
Not applicable.
Competing interests
The authors declare that they have no competing interests.
Publisher’s Note
Springer Nature remains neutral with regard to jurisdictional claims in published maps and institutional affiliations.
Contributor Information
Lisha Ai, Email: ailisha@hust.edu.cn.
Shidai Mu, Email: mushidai9247@126.com.
Yadan Wang, Email: hillaryw@163.com.
Huafang Wang, Email: huafang_wang@163.com.
Li Cai, Email: 15927514656@163.com.
Wenzhu Li, Email: liwenzhu_2004@163.com.
Yu Hu, Email: dr_huyu@126.com.
References
- 1.Siegel RL, Miller KD, Jemal A. Cancer statistics, 2017. CA Cancer J Clin. 2017;67(1):7–30. doi: 10.3322/caac.21387. [DOI] [PubMed] [Google Scholar]
- 2.Ostrand-Rosenberg S., Sinha P. Myeloid-Derived Suppressor Cells: Linking Inflammation and Cancer. The Journal of Immunology. 2009;182(8):4499–4506. doi: 10.4049/jimmunol.0802740. [DOI] [PMC free article] [PubMed] [Google Scholar]
- 3.Gabrilovich DI. Myeloid-derived suppressor cells. Cancer Immuno Res. 2017;5(1):3–8. doi: 10.1158/2326-6066.CIR-16-0297. [DOI] [PMC free article] [PubMed] [Google Scholar]
- 4.Pyzer AR, Cole L, Rosenblatt J, Avigan DE. Myeloid-derived suppressor cells as effectors of immune suppression in cancer. Int J Cancer. 2016;139(9):1915–1926. doi: 10.1002/ijc.30232. [DOI] [PubMed] [Google Scholar]
- 5.Lu T, Ramakrishnan R, Altiok S, Youn JI, Cheng P, Celis E, Pisarev V, Sherman S, Sporn MB, Gabrilovich D. Tumor-infiltrating myeloid cells induce tumor cell resistance to cytotoxic T cells in mice. J Clin Invest. 2011;121(10):4015–4029. doi: 10.1172/JCI45862. [DOI] [PMC free article] [PubMed] [Google Scholar]
- 6.Centuori SM, Trad M, LaCasse CJ, Alizadeh D, Larmonier CB, Hanke NT, Kartchner J, Janikashvili N, Bonnotte B, Larmonier N, et al. Myeloid-derived suppressor cells from tumor-bearing mice impair TGF-beta-induced differentiation of CD4+CD25+FoxP3+ Tregs from CD4+CD25-FoxP3- T cells. J Leukoc Biol. 2012;92(5):987–997. doi: 10.1189/jlb.0911465. [DOI] [PMC free article] [PubMed] [Google Scholar]
- 7.Gorgun GT, Whitehill G, Anderson JL, Hideshima T, Maguire C, Laubach J, Raje N, Munshi NC, Richardson PG, Anderson KC. Tumor-promoting immune-suppressive myeloid-derived suppressor cells in the multiple myeloma microenvironment in humans. Blood. 2013;121(15):2975–2987. doi: 10.1182/blood-2012-08-448548. [DOI] [PMC free article] [PubMed] [Google Scholar]
- 8.Weide B, Martens A, Zelba H, Stutz C, Derhovanessian E, Di Giacomo AM, Maio M, Sucker A, Schilling B, Schadendorf D, et al. Myeloid-derived suppressor cells predict survival of patients with advanced melanoma: comparison with regulatory T cells and NY-ESO-1- or melan-A-specific T cells. Clin Cancer Res. 2014;20(6):1601–1609. doi: 10.1158/1078-0432.CCR-13-2508. [DOI] [PubMed] [Google Scholar]
- 9.Jiang H, Gebhardt C, Umansky L, Beckhove P, Schulze TJ, Utikal J, Umansky V. Elevated chronic inflammatory factors and myeloid-derived suppressor cells indicate poor prognosis in advanced melanoma patients. Int J Cancer. 2015;136(10):2352–2360. doi: 10.1002/ijc.29297. [DOI] [PubMed] [Google Scholar]
- 10.Solito S, Falisi E, Diaz-Montero CM, Doni A, Pinton L, Rosato A, Francescato S, Basso G, Zanovello P, Onicescu G, et al. A human promyelocytic-like population is responsible for the immune suppression mediated by myeloid-derived suppressor cells. Blood. 2011;118(8):2254–2265. doi: 10.1182/blood-2010-12-325753. [DOI] [PMC free article] [PubMed] [Google Scholar]
- 11.Wang L., Chang E. W. Y., Wong S. C., Ong S.-M., Chong D. Q. Y., Ling K. L. Increased Myeloid-Derived Suppressor Cells in Gastric Cancer Correlate with Cancer Stage and Plasma S100A8/A9 Proinflammatory Proteins. The Journal of Immunology. 2012;190(2):794–804. doi: 10.4049/jimmunol.1202088. [DOI] [PubMed] [Google Scholar]
- 12.Gao XH, Tian L, Wu J, Ma XL, Zhang CY, Zhou Y, Sun YF, Hu B, Qiu SJ, Zhou J, et al. Circulating CD14+ HLA-DR−/low myeloid-derived suppressor cells predicted early recurrence of hepatocellular carcinoma after surgery. Hepatol Res. 2017;47(10):1061–1071. doi: 10.1111/hepr.12831. [DOI] [PubMed] [Google Scholar]
- 13.Zhang H, Li ZL, Ye SB, Ouyang LY, Chen YS, He J, Huang HQ, Zeng YX, Zhang XS, Li J. Myeloid-derived suppressor cells inhibit T cell proliferation in human extranodal NK/T cell lymphoma: a novel prognostic indicator. Cancer Immunol Immun. 2015;64(12):1587–1599. doi: 10.1007/s00262-015-1765-6. [DOI] [PMC free article] [PubMed] [Google Scholar]
- 14.Yang G, Shen W, Zhang Y, Liu M, Zhang L, Liu Q, Lu HH, Bo J. Accumulation of myeloid-derived suppressor cells (MDSCs) induced by low levels of IL-6 correlates with poor prognosis in bladder cancer. Oncotarget. 2017;8(24):38378–38388. doi: 10.18632/oncotarget.16386. [DOI] [PMC free article] [PubMed] [Google Scholar]
- 15.Wang J, Yang J. Identification of CD4+CD25+CD127- regulatory T cells and CD14+HLA-DR−/low myeloid-derived suppressor cells and their roles in the prognosis of breast cancer. Biomed Rep. 2016;5(2):208–212. doi: 10.3892/br.2016.694. [DOI] [PMC free article] [PubMed] [Google Scholar]
- 16.Yuan L, Yuan P, Du J, Chen G, Wan X, Li Z, Xu B. Relationship of preoperative and postoperative myeloid-derived suppressor cells percentage with the prognosis in rectal cancer patients. Chin J Gastrointest Surg. 2015;18(11):1139–1143. [PubMed] [Google Scholar]
- 17.Parmar M, Torri V, Stewart L. Extracting summary statistics to perform meta-analysis of the published literature for survival endpoints. Stat Med. 2010;23(11):1817. doi: 10.1002/(sici)1097-0258(19981230)17:24<2815::aid-sim110>3.0.co;2-8. [DOI] [PubMed] [Google Scholar]
- 18.Chuling F, Hui H, Zuojun X. The Newcastle-Ottawa scale (NOS) for assessing the quality of nonrandomized studies. PLoS One. 2016. 10.1371/journal.pone.0154716.t002.
- 19.Higgins J. P T. Measuring inconsistency in meta-analyses. BMJ. 2003;327(7414):557–560. doi: 10.1136/bmj.327.7414.557. [DOI] [PMC free article] [PubMed] [Google Scholar]
- 20.Tian T, Gu X, Zhang B, Liu Y, Yuan C, Shao L, Guo Y, Fan K. Increased circulating CD14 (+) HLA-DR−/low myeloid-derived suppressor cells are associated with poor prognosis in patients with small-cell lung cancer. Cancer Biomark. 2015;15(4):425–432. doi: 10.3233/CBM-150473. [DOI] [PubMed] [Google Scholar]
- 21.Landskron G, De la Fuente M, Thuwajit P, Thuwajit C, Hermoso MA. Chronic inflammation and cytokines in the tumor microenvironment. J Immunol Res. 2014;2014:149185. doi: 10.1155/2014/149185. [DOI] [PMC free article] [PubMed] [Google Scholar]
- 22.Wang D, DuBois RN. Immunosuppression associated with chronic inflammation in the tumor microenvironment. Carcinogenesis. 2015;36(10):1085–1093. doi: 10.1093/carcin/bgv123. [DOI] [PMC free article] [PubMed] [Google Scholar]
- 23.Horinaka A, Sakurai D, Ihara F, Makita Y, Kunii N, Motohashi S, Nakayama T, Okamoto Y. Invariant NKT cells are resistant to circulating CD15+ myeloid-derived suppressor cells in patients with head and neck cancer. Cancer Sci. 2016;107(3):207–216. doi: 10.1111/cas.12866. [DOI] [PMC free article] [PubMed] [Google Scholar]
- 24.OuYang LY, Wu XJ, Ye SB, Zhang RX, Li ZL, Liao W, Pan ZZ, Zheng LM, Zhang XS, Wang Z, et al. Tumor-induced myeloid-derived suppressor cells promote tumor progression through oxidative metabolism in human colorectal cancer. J Transl Med. 2015;13:47. doi: 10.1186/s12967-015-0410-7. [DOI] [PMC free article] [PubMed] [Google Scholar]
- 25.Huang A, Zhang B, Wang B, Zhang F, Fan KX, Guo YJ. Increased CD14 (+) HLA-DR (−/low) myeloid-derived suppressor cells correlate with extrathoracic metastasis and poor response to chemotherapy in non-small cell lung cancer patients. Cancer Immunol Immun. 2013;62(9):1439–1451. doi: 10.1007/s00262-013-1450-6. [DOI] [PMC free article] [PubMed] [Google Scholar]
- 26.De Veirman K, Van Valckenborgh E, Lahmar Q, Geeraerts X, De Bruyne E, Menu E, Van Riet I, Vanderkerken K, Van Ginderachter JA. Myeloid-derived suppressor cells as therapeutic target in hematological malignancies. Front Onco. 2014;4:349. doi: 10.3389/fonc.2014.00349. [DOI] [PMC free article] [PubMed] [Google Scholar]
- 27.Gantt S, Gervassi A, Jaspan H, Horton H. The role of myeloid-derived suppressor cells in immune ontogeny. Front Immunol. 2014;5:387. doi: 10.3389/fimmu.2014.00387. [DOI] [PMC free article] [PubMed] [Google Scholar]
- 28.Tadmor T, Attias D, Polliack A. Myeloid-derived suppressor cells--their role in haemato-oncological malignancies and other cancers and possible implications for therapy. Brit J Haematol. 2011;153(5):557–567. doi: 10.1111/j.1365-2141.2011.08678.x. [DOI] [PubMed] [Google Scholar]
- 29.Talmadge JE, Gabrilovich DI. History of myeloid-derived suppressor cells. Nat Rev Cancer. 2013;13(10):739–752. doi: 10.1038/nrc3581. [DOI] [PMC free article] [PubMed] [Google Scholar]
Associated Data
This section collects any data citations, data availability statements, or supplementary materials included in this article.
Data Availability Statement
Please contact author for data requests.


