

Abstract
Aims and Objective:
The aim of this study is to investigate the expression of p53 protein and Ki-67 antigen in normal oral mucosa and oral leukoplakia with different grades of dysplasia using immunohistochemistry and to clarify the correlation of the expression of these cell cycle regulatory proteins.
Materials and Methods:
A total of 20 archival tissue blocks obtained from our department which were diagnosed as mild (n = 5), moderate (n = 5), and severe dysplasia (n = 5) with normal mucosa (n = 5) as a control. Positivity of Ki-67 and p53 was analyzed using Statistical Package for the Social Sciences (IBM Corp. Released 2013. IBM SPSS Statistics for Windows, Version 22.0 Armonk, NY:IBM Corp) software.
Results:
All samples showed positive staining for p53 and Ki-67. Statistically significant difference (P < 0.05) was seen between the frequency of occurrence of p53 and Ki-67 pattern of expression among all the groups. The intensity of staining was mild to intense in basal layer as there was a progression toward the severity of the disease. Almost 81.1% correlation existed between p53 and Ki-67 with high correlation and marked relationship.
Conclusion:
Oral leukoplakia represents the most common oral potentially malignant disorder (OPMD). Molecular biological markers such as p53 and Ki-67 are considered to be of great value in the diagnosis and prognostic evaluation of OPMD. Our results emphasize the potential use of p53 protein and Ki-67 antigen as significant molecular markers for early detection of PMDs and its risk of developing oral squamous cell carcinoma.
KEYWORDS: Epithelial dysplasia, Ki-67 antigen, oral leukoplakia, p53 protein
INTRODUCTION
Oral potentially malignant disorders (OPMDs) include a variety of lesions and conditions of oral epithelium such as leukoplakia, erythroplakia, oral submucous fibrosis, lichen planus, and discoid lupus erythematosus that are characterized by an increased risk for malignant transformation (MT) to oral squamous cell carcinoma (OSCC).[1,2,3,4]
It is generally accepted that the histopathological features of a given lesion, especially the presence and degree of epithelial dysplasia, are currently the most useful indicators of MT risk. However, histopathological assessment alone does not provide an accurate assessment of MT risk, and other features, such as clinical and molecular parameters, must be taken into account.[1]
Oral leukoplakia represents the most common PMD. The percentage of leukoplakia that progresses to invasive OSCC is accepted to be directly related to the severity of dysplastic changes presumably due to the accumulation of genomic and molecular alterations.[5]
Molecular biological markers have been suggested to be of value in the diagnosis and prognostic evaluation of OPMDs. Markers of proliferation, epithelial differentiation, and genomic markers could potentially be good prospective for improving the prognostic evaluation of precursors of oral cancer.[6]
One such marker is the p53 tumor suppressor gene which is a frequent target for mutations in a high percentage of tumors and is regarded as an early event in carcinogenesis.[7] p53 gene is located on the short arm of chromosome 17 at the position 17p13.1.[8] It is involved in cell cycle control, apoptosis, and the preservation of genomic stability. The mutant form of p53 protein has an extended half-life and can be detected by immunohistochemistry[7] frequently found in OSCC and in OPMDs. It is considered to be a good marker to predict MT of oral leukoplakias.[9]
The most common immunohistochemical (IHC) cell proliferation marker is Ki-67 antigen. It is a nuclear protein expressed in the G2- and M-phases of actively dividing cells. Its nuclear expression during a defined period of the cell cycle represents an advantage in its use as a biological marker of mitotic activity. Ki-67 positive cells are often correlated with the clinical course of the disease.[10] It provides significant information about the degree of aggressiveness and prognosis of OSCC.[10,11]
The purpose of this study was to investigate the expression and pattern of intensity of p53 protein and Ki-67 antigen in normal oral mucosa and oral leukoplakia with different grades of dysplasia using immunohistochemistry and to clarify the correlation of the expression of these cell cycle regulatory proteins.
MATERIALS AND METHODS
A total number of 20 archival paraffin-embedded blocks obtained from the Department of Oral Pathology and Microbiology were studied. An Institutional Ethical Committee approval (letter no: 459/BIDSH) was obtained before the start of the study. The sections were stained with H and E for diagnosis and grading. Confirmed cases were stained with markers p53 and Ki-67 (BioGenex polymer – horseradish peroxidase [HRP] IHC detection system) for IHC analysis. Antigen retrieval was done using EZ-Retriever system technique. Assessment of antigen-expressing cells was performed using light microscope (Multi viewing Microscope Model CXR5) at × 400 magnification.
The case details were retrieved which consisted of histopathologically diagnosed cases of mild dysplasia (n = 5), moderate dysplasia (n = 5), severe dysplasia (n = 5), and normal-appearing mucosa (n = 5) were taken as the standard for comparison.
IMMUNOHISTOCHEMICAL PROCEDURE
The tissue sections were cut to 3–4 μ thickness and were taken to coated slides, and the slides were marked
Baking was done at 60°C for 1 h after which it was dipped and deparaffinized in xylene for 10 min (2 changes)
Slides were rehydrated through graded alcohols (3 changes) and running tap water
The slides were not allowed to dry at any point
Antigen retrieval was performed by placing the slides in AR1 – 10 min at 90°C and AR2 – 15 min at 98°C in EZ-Retriever System
Slides were cooled to room temperature
After washing the slides with phosphate buffer solution, peroxide block was applied for 10 min
Hydrophobic barrier was drawn around tissue using PAP pen to avoid spreading of reagents away from the tissue
Power block was applied for 10 min, and primary antibody (monoclonal mouse anti-Ki-67 antibody [MIB-1] for Ki-67 and antihuman p53 protein [DO-7; DAKO] for p53) was added and incubated for 1 h
The slides were washed in buffer for 3 min (3 times), and super enhancer (secondary antibody) was applied for 20 min
Again, the slides were washed in buffer for 3 min (3 times), and poly HRP enzyme polymer reagent was applied for 30 min and washed with buffer
Diacetyl bromoacetic acid was added to the slide for 5 min, and slides were washed in running tap water
The slides were dipped in Mayer's hematoxylin for less than a minute and washed under running tap water
Finally, the slides were dehydrated in ascending grades of alcohol and then to xylene and mounted with diphenylene phthalate xylene.
Interpretation of the p53 and Ki-67
The slides for p53 and Ki-67 were observed under light microscope with a magnification of × 400. The tissue samples were thoroughly examined, and the pattern of expression was analyzed semi-quantitatively by counting the number of positive cells per 100 basal, parabasal, and spinous cells and was recorded as percentage.
Evaluation of staining
The intensity of staining was graded based on the subjective evaluation of color exhibited (brown color) by antigen, antibody, and chromogen complex as mild (+, light brown color), moderate (++, dark brown color), or intense (+++, very dark brown color). The distribution of staining was graded as confined only to basal layer, parabasal layer, and spinous layer of the epithelium. Only nuclear staining of epithelial cells was observed, and the nuclei with clear brown color, regardless of staining intensity, were considered as positive. Known positive immunostaining slides were used as positive controls.
The parameters used to analyze the expression of both p53 protein and Ki-67 antigen was as follows:
Pattern or distribution of expression in the epithelial layers
Intensity of staining in each slide
The percentage of positive cells or labeling index (LI).
STATISTICAL PROCEDURES
Data obtained were compiled on a Microsoft Office Professional Plus 2010, Version 14.0.7128.5000: for windows, One Microsoft Way Redmond, WA 98052 and were subjected to statistical analysis using Statistical Package for the Social Sciences (SPSS v 22.0, IBM). Comparison of differences in means of percentage of positive p53 and Ki-67 cells between all the groups was done using Kruskal–Wallis test, followed by pair-wise comparison using Mann–Whitney U-test.
The pattern of staining of p53 and Ki-67 and intensity was compared with all the groups using Chi-square test.
Correlation between the percentage of positive cells LI of p53 and Ki-67 was also calculated where r value and R2 value were calculated. For all the statistical tests; P < 0.05 was considered to be statistically significant, keeping α error at 5% and β error at 20%, thus giving power to the study as 80%.
RESULTS
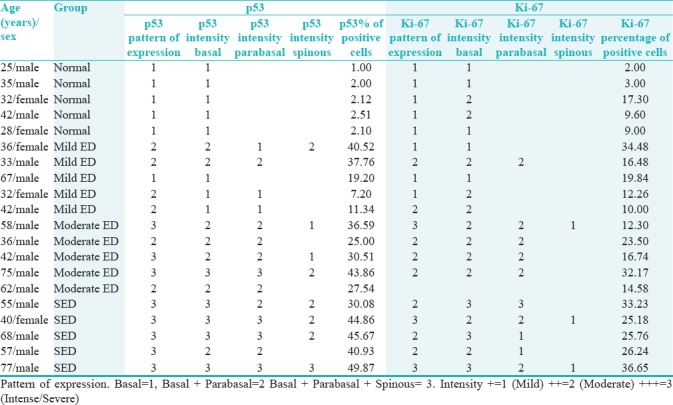
The results of IHC analysis of p53 and Ki-67 expression are summarized in Table 1. The expression of each protein in each group is analyzed and interpreted as follows:
Table 1.
Immunohistochemistry staining details of p53 and Ki-67 in all group
Comparing mean of the percentage of positive p53 cells as per groups showed the statistical significant difference when normal mucosa group was compared with mild, moderate, and severe epithelial dysplasia groups [Table 2 and Figure 1]* = Significant difference (P = 0.003).
Table 2.
Comparing mean of percentage of positive p53 cells as per groups
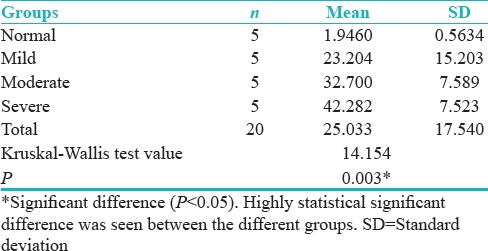
Figure 1.
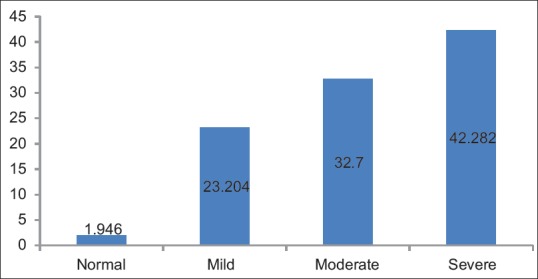
Percentage of positive p53 cells
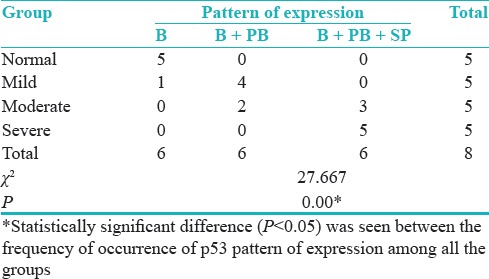
Distribution of cases according to groups and pattern of staining for p53 antibody shows the statistically significant difference between the frequency of occurrence of p53 pattern of expression among all the group overall (P = 0.00) [Table 3].
Table 3.
Distribution of cases according to the groups and pattern of staining for p53 antibody
Groups versus p53 intensity basal layer show the statistically significant difference (P = 0.001) between the frequency of occurrence of p53 pattern of expression in basal layer among the groups overall [Table 4 and Figure 2].
Table 4.
Groups versus p53 intensity basal layer
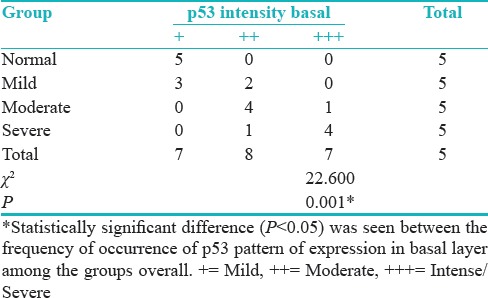
Figure 2.
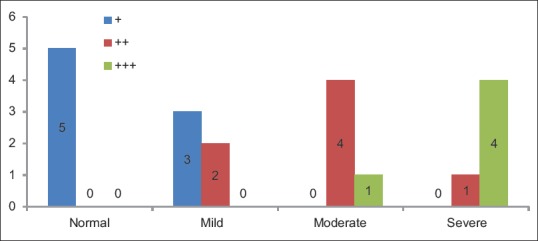
p53 intensity basal layer
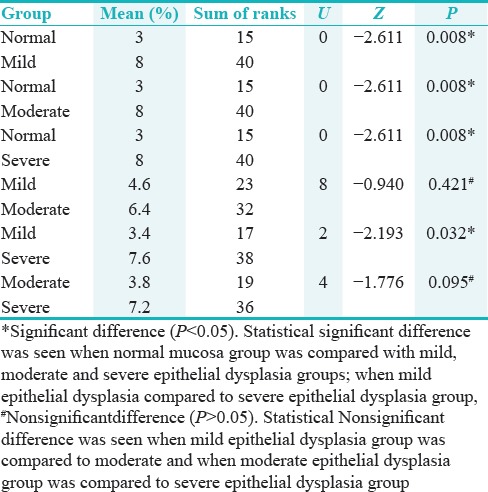
Pair-wise comparison of four groups with respect to LI of p53 by Mann–Whitney U-test showed statistically significant difference when normal mucosa group was compared with other groups; mild epithelial dysplasia group when compared to severe epithelial dysplasia group (P < 0.05), and statistically nonsignificant difference was seen when mild epithelial dysplasia group was compared to moderate epithelial dysplasia group; and moderate epithelial dysplasia group was compared to severe epithelial dysplasia group (P > 0.05) [Table 5].
Table 5.
Pairwise comparison of four groups with respect to labeling index of p53 by Mann-Whitney U-test
Distribution of cases according to groups and LI of p53 shows statistically significant difference (P = 0.008) between the frequency of occurrence of p53 pattern of expression coded as per three groups (6%–25%, 26%–60%, and 61%–99%) [Table 6 and Figure 3].
Table 6.
Distribution of cases according to groups and labeling index of p53
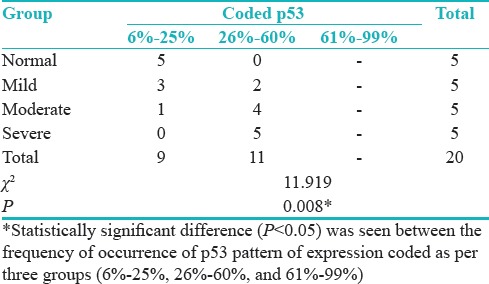
Figure 3.
Distribution of cases according to the groups and labeling index of p53
Comparison of four groups with respect to LI of Ki-67 by Kruskal–Wallis one-way ANOVA test showed the statistical significant difference (P = 0.012) between different groups [Table 7 and Figure 4].
Table 7.
Comparing mean of percentage of positive Ki-67 cells as per groups
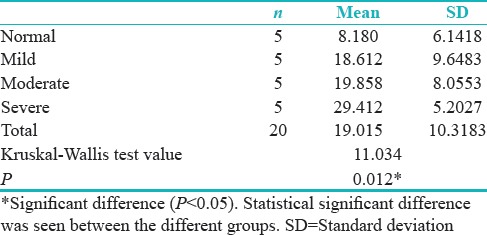
Figure 4.
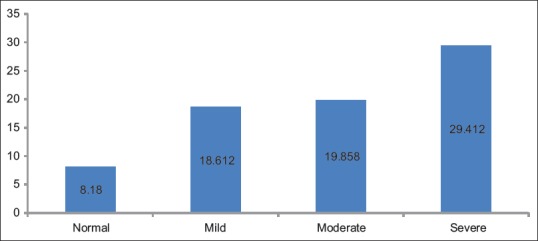
Percentage of positive Ki-67 cells
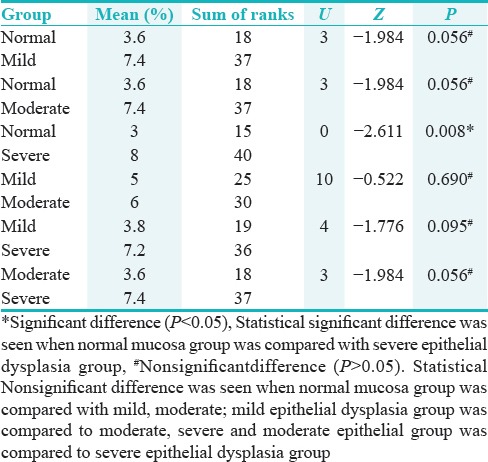
Pair-wise comparison of four groups with respect to LI of Ki-67 by Mann–Whitney U-test showed the statistical significant difference (P = 0.008) when normal mucosa group was compared with severe epithelial dysplasia group [Table 8].
Table 8.
Pairwise comparison of four groups with respect to labeling index of KI-67 by Mann-Whitney U-test
Distribution of cases according to groups and pattern of staining for Ki-67 shows statistically significant difference (P = 0.011) between the frequency of occurrence of Ki-67 pattern of expression among all the groups [Table 9 and Figure 5].
Table 9.
Distribution of cases according to groups and pattern of staining for Ki-67
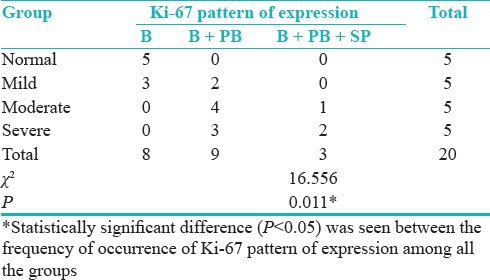
Figure 5.
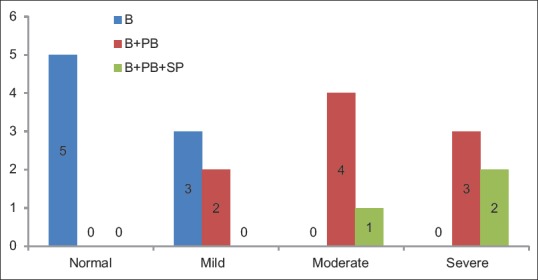
Distribution of cases according to the groups and pattern of staining for Ki-67
Groups versus Ki-67 intensity basal layer showed statistically significant difference (P = 0.012) between the frequency of occurrence of Ki-67 pattern of expression in basal layer among the groups overall [Table 10 and Figure 6].
Table 10.
Groups versus Ki-67 intensity basal layer
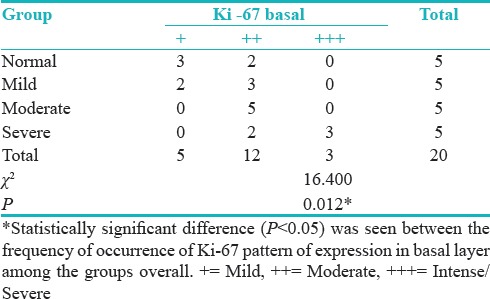
Figure 6.
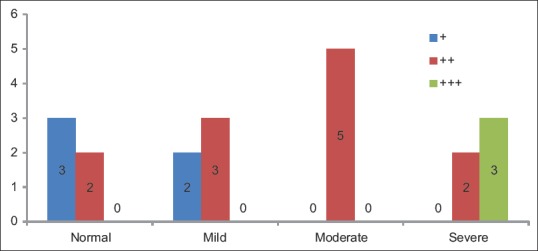
Ki-67 intensity basal layer
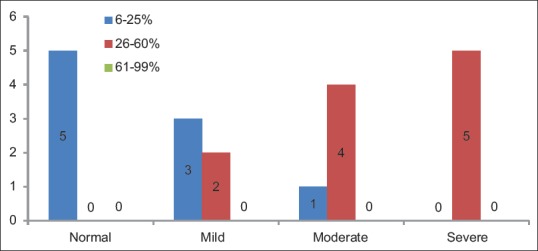
Distribution of cases according to the groups and LI of Ki-67 showed statistically significant difference (P = 0.005) was seen between the frequency of occurrence of Ki-67 pattern of expression coded as per three groups (0%–5%, 6%–25%, and 26%–60%) [Table 11 and Figure 7].
Table 11.
Distribution of cases according to groups and labeling index of Ki-67
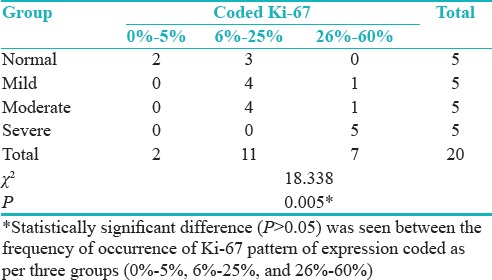
Figure 7.
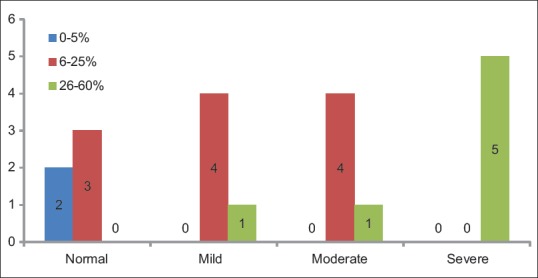
Distribution of cases according to the groups and labeling index of Ki-67
Correlation between p53 and Ki-67 in predicting the disease is 0.811 (81.1%). Table 12 shows regression estimation, i.e., a way to show relationship when one increases what happens to the other variable.
Table 12.
Correlation between percentage of positive cells (labeling index) of p53 and Ki-67
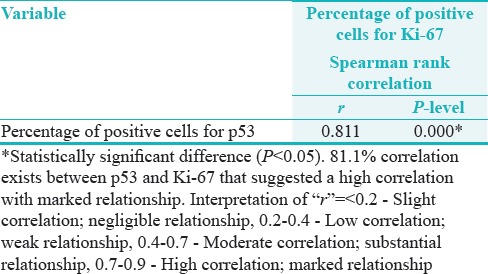
Here, we have got a positive relationship, i.e., positive correlation with, r value as 0.811, P = 0.000* (P < 0.05)*Statistical significant difference suggesting high correlation and marked relationship [Table 12].
DISCUSSION
Epithelial dysplasia is characterized by a number of cells and tissue alterations, visible with a light microscope, which reveal an alteration of the cellular maturation in the epithelium and an increase of the proliferative suprabasal activity.[12] The presence of epithelial dysplasia is gradually accepted as one of the most important predictors of the malignant development in premalignant lesion presumably due to the accumulation of genomic and molecular alterations[13] than those without dysplasia as reported by Pindborg et al. (1997), Burkhardt and Maerker (1978), Kramer et al. (1978), and others. However, epithelial dysplasia will not necessarily develop into cancer and some may even regress as documented in various studies done by Mincer et al. (1972), Silverman et al. (1976), Banoczy and Csiba (1972), and Gupta et al. (1980).
The distribution of p53 is confined to the basal layer only in normal epithelium, but in dysplasia, it may be found in suprabasal layer depending on the severity of molecular damage.[5]
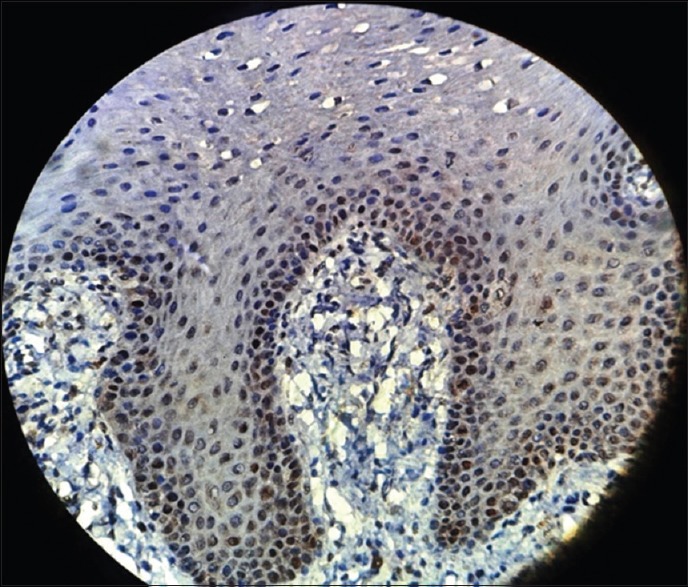
In the present study also, normal oral mucosa exhibited positive p53 expression at the basal cell layer [Figure 8] in agreement with other studies carried out by Patel et al.,[5] Humayun and Prasad,[6]Álvarez et al.,[14] Kurokawa et al.,[15] and Reddy et al.[7] The possible explanation is that, in a normal cell, the p53 protein is kept at a low concentration by rapid degradation, and p53 exists in a latent, inactive form.[6,7,14,15]
Figure 8.
Photomicrograph showing p53 expression in normal oral mucosa seen in basal layer of the epithelium (immunohistochemical stain, ×400)
The Kruskal–Wallis one-way ANOVA test in our study showed that there was a significant difference of mean LI (P = 0.003) between the groups. There was statistically significant difference seen between the LI (% positive p53 cells) among all the groups overall (P < 0.05).
Chi-square test also showed significant staining pattern relationship (P = 0.00). It can be concluded that more basal pattern of expression is seen in normal/controls, and as we move toward severity of the disease, the pattern of expression involves all the three layers.
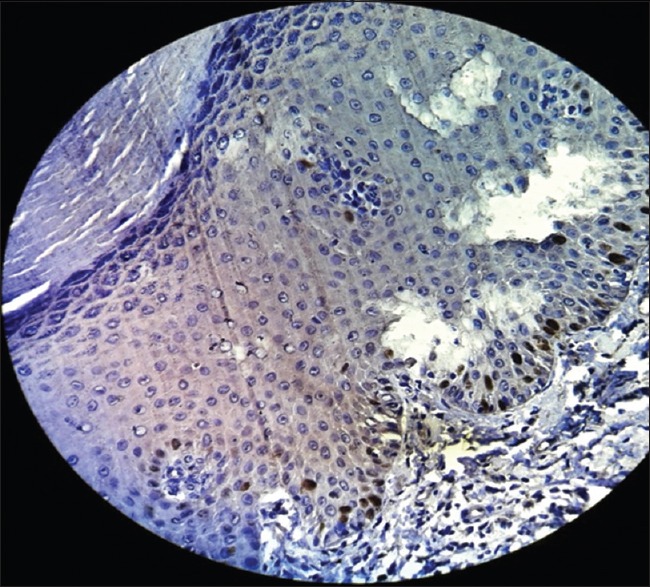
In the present study, expression of p53 above basal cell in mild, moderate, and severe dysplasia [Figures 9–11] indicated that the superficial cells of the epithelium were mitotically active, resulting in an abnormally proliferative state. This is in contrast to normal mucosa, where it is only the basal cells of the epithelium, which proliferate, differentiate, and mature to form keratinized squames. It has also been pointed out that an increase in p53 positive cells in above basal layer of the epithelium in leukoplakia suggests an imminent potential for aggressive behavior.[7] Several researchers have documented that almost 86% of the premalignant lesions that showed p53 expression above the basal layer developed into OSCC, which could be an early event in oral carcinogenesis and an indicator of developing carcinoma.[16] Hence, the expression pattern of p53 is significant in predicting the MT of oral leukoplakia.
Figure 9.
Photomicrograph showing p53 expression in mild epithelial dysplasia seen in basal and parabasal layer of the epithelium (immunohistochemical stain, ×400)
Figure 11.
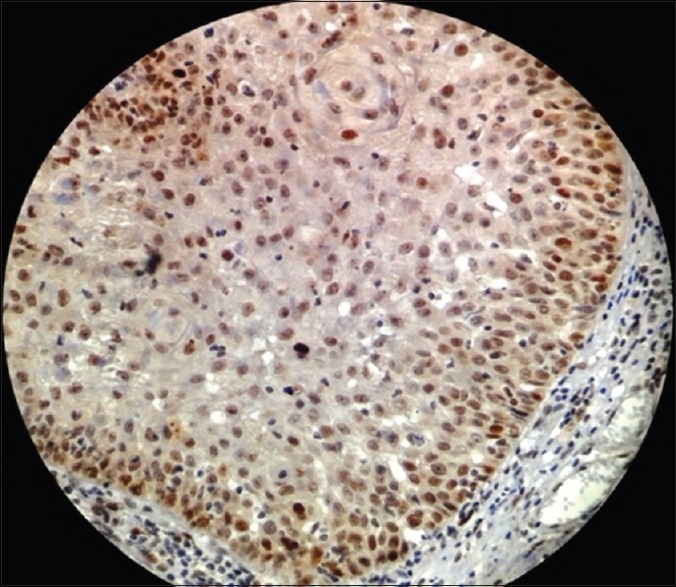
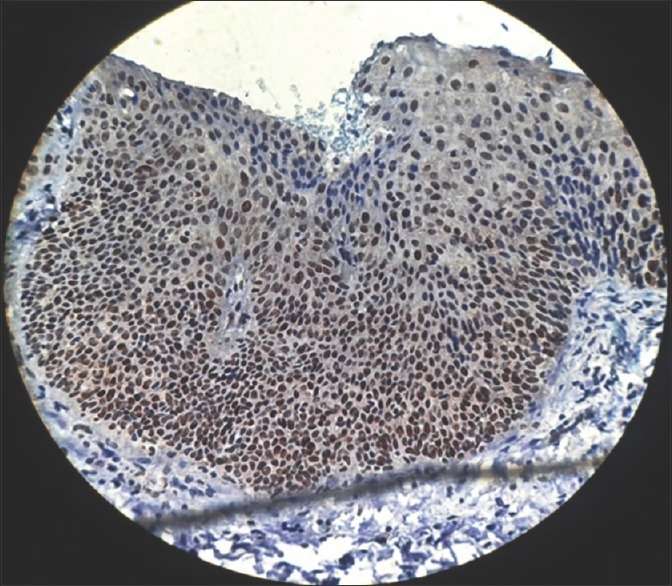
Photomicrograph showing p53 expression in severe epithelial dysplasia seen in basal, parabasal, as well as spinous layer of the epithelium (immunohistochemical stain, ×400)
Figure 10.
Photomicrograph showing p53 expression in moderate epithelial dysplasia seen in basal, parabasal, as well as spinous layer of the epithelium (immunohistochemical stain, ×400)
Comparison of p53 staining intensity revealed that p53 expression in basal layer was weak (+) in normal/control cases compared to mild, moderate, and severe dysplasia which showed moderate (++)-to-intense (+++) staining intensity. To conclude it can be said that intensity of expression in the basal layer is directly proportional to the severity of the condition.
Similar observations have been made by Reddy et al.[7] where they found weak p53 expression in mild dysplasia compared to moderate and severe dysplasia which showed stronger staining intensity.[7]
Above report and the present study suggested that increased staining intensity related to severity of dysplasia may be directly related to the activity of p53 which may be increased during the early stages of tumor progression.[10]
Hyperproliferation is thought to be an early marker of disorderly growth. It is generally accepted that increased proliferation is associated with more advanced lesions and that the distribution of proliferating cell in tissue may reveal more about the regulatory mechanism that becomes dysfunctional during the multistep process of carcinogenesis.[17,18] Many studies have reported that abnormal cell proliferation appears to be a precursor and may be a predictor of tumorigenesis.[10]
The present study focuses on Ki-67, stained by MIB-1 as it is easy to interpret because there is low background staining. It is also believed to be a reliable marker of cell proliferation because this nonhistone protein can be expressed at all stages of cell cycle except G0.[17]
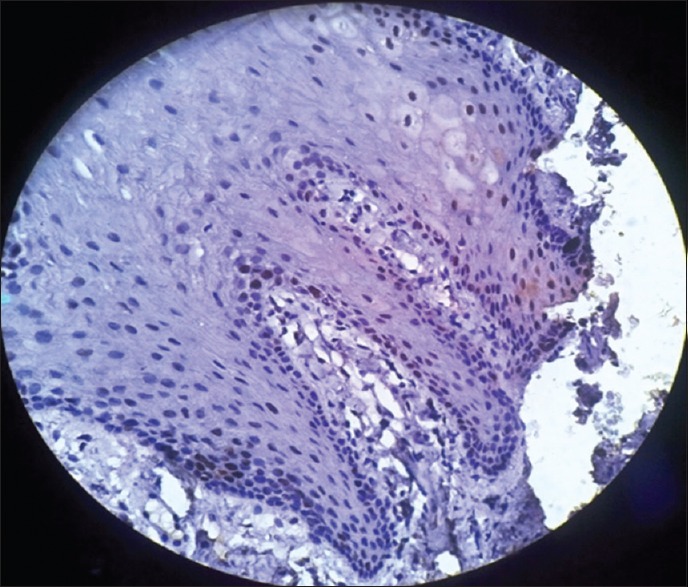
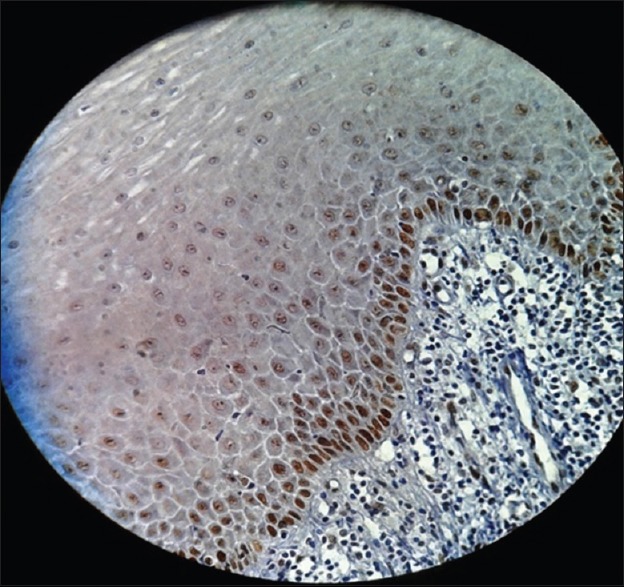
In normal mucosa, Ki-67 remained confined to isolated cells/occasional cells in the basal layer or in parabasal layer with no positivity in the superficial layer.[17] In present study also, all the samples of normal mucosa showed positive staining with Ki-67 in the basal layer of epithelium [Figure 12] similar to p53; this could be due to the physiological proliferative activity in the basal cell layer.
Figure 12.
Photomicrograph showing Ki-67 expression in normal oral mucosa seen in the basal layer of the epithelium (immunohistochemical stain, ×400)
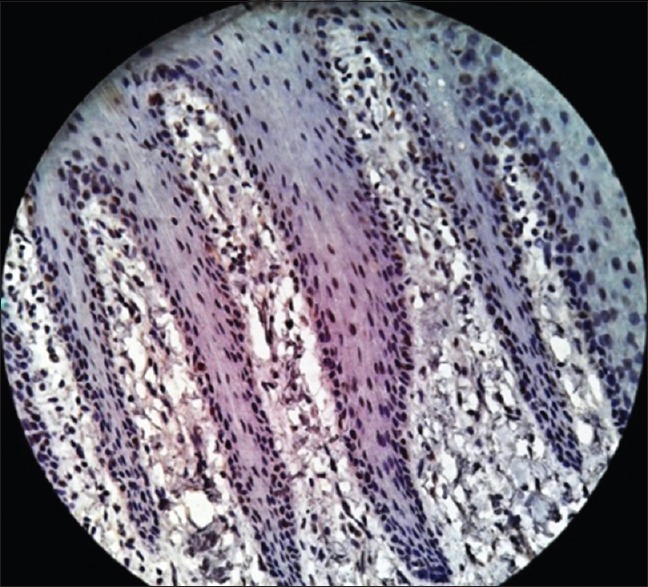
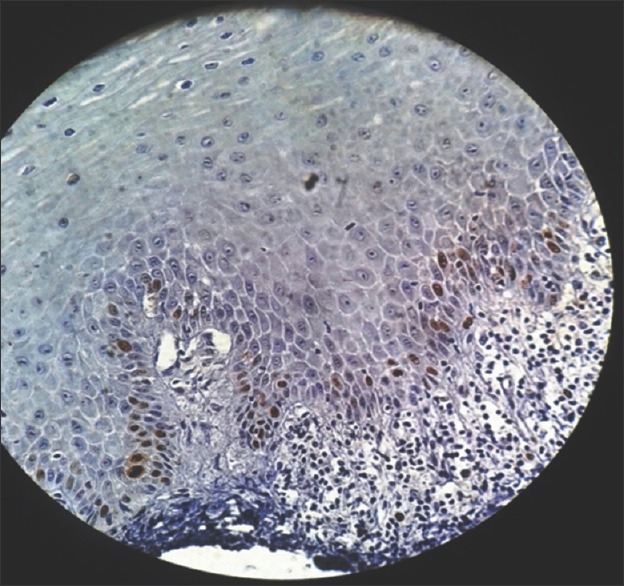
Ki-67 was initially included as a guide to determine the level of proliferation. Increased cell proliferation has been reported to be characteristic in malignant progression and to have predictive and prognostic significance.[13] The present study showed proliferative cells at abnormal sites within the dysplastic epithelium [Figures 13–15]. These findings supported those of Liu et al., who found that the basal and superficial layers showed the clearest differences between normal and abnormal tissues.[18]
Figure 13.
Photomicrograph showing Ki-67expression in mild epithelial dysplasia seen in basal and parabasal layer of the epithelium (immunohistochemical stain, ×400)
Figure 15.
Photomicrograph showing Ki-67 expression in severe epithelial dysplasia seen in basal, parabasal and spinous layer of the epithelium (immunohistochemical stain, ×400)
Figure 14.
Photomicrograph showing Ki-67 expression in moderate epithelial dysplasia seen in basal and parabasal layer of the epithelium (immunohistochemical stain, ×400)
According to Dwivedi et al.[19]; Expression of Ki-67 LI increased in basal and suprabasal layers following the degree of dysplasia from non-dysplastic to dysplasia group. According to Takeda et al.[20]; Ki-67 LI in the basal and suprabasal layers of epithelial dysplasias increased according to the grade of dysplasia. These finding is in correlation with our study where the pattern of expression gave a conclusive result (P = 0.011) regarding the progression toward severity also pattern of staining in overall groups and intensity of staining of basal layer in Pearson's Chi-square test has shown statistically significant difference (P = 0.012). Hence, it can be concluded that the pattern and intensity of staining are increased as we move toward moderate and even severe epithelial dysplasia.
Kumar Priya et al. (2012) found the expression of p53 correlated significantly with Ki-67 similar to the present study where Spearman rank co-relationship has shown 81.1% correlation between p53 and Ki-67. The regression curve estimation has shown even a positive correlation with R2= 0.634, R = 0.796, and P = 0.001* which is a high correlation and marked relationship.
Under normal circumstances, p53 regulates the cell cycle by inducing G1 arrest or apoptosis in cells that are genetically damaged by ultraviolet light or chemical carcinogens. Mutations of p53 lead to uncontrolled cell growth. Thus, the significant correlation between p53 and Ki-67 in our study indicated that alterations in p53 may lead to increased cellular proliferation in oral epithelial dysplasia.
LIMITATIONS AND STRENGTHS
Our study was performed involving only 20 sample size to which two common markers’ expressions have been documented, which accounts our biggest limitation. Hence, our study provides a template for future researches with a larger sample size to be conducted on various other IHC markers to achieve a more reliable and authentic data.
CONCLUSION
We hypothesize that the combined IHC expression of p53 and Ki-67 proteins could aid in early detection of PMDs at risk of developing OSCC. Expression and pattern of intensity of both p53 and Ki-67 were found to be increased in epithelial dysplasia as compared to normal mucosa. These findings were significantly correlated with progression from normal to neoplasia, and increased expression and pattern of intensity of these antigens suggested that they may be useful indicators of MT in dysplastic lesions.
The present study reveals that the intensity in the basal layer is directly proportional to the severity of the disease and is associated with the activity of p53 and Ki-67. Our study showed a correlation of 81.1% between p53 and Ki-67 and suggested that altered p53 gene product promoted cellular proliferation. However, further studies with larger sample size using a panel of related molecules are necessary to establish the full potential of p53 and Ki-67 as a prognostic and proliferative marker in oral leukoplakias.
FINANCIAL SUPPORT AND SPONSORSHIP
Nil.
CONFLICTS OF INTEREST
There are no conflicts of interest.
REFERENCES
- 1.Farah CS, Woo SB, Zain RB, Sklavounou A, McCullough MJ, Lingen M, et al. Oral cancer and oral potentially malignant disorders. Int J Dent 2014. 2014:853479. doi: 10.1155/2014/853479. [DOI] [PMC free article] [PubMed] [Google Scholar]
- 2.Gadiwan M, Madhushankari G, Mandana D, Praveen S, Selvamani M, Pradeep D, et al. Nuclear features in different grades of epithelial dysplasia in leukoplakia: A computer assisted microscopic study. J Oral Maxillofac Pathol. 2014;18:194–200. doi: 10.4103/0973-029X.140747. [DOI] [PMC free article] [PubMed] [Google Scholar]
- 3.van der Waal I. Potentially malignant disorders of the oral and oropharyngeal mucosa; terminology, classification and present concepts of management. Oral Oncol. 2009;45:317–23. doi: 10.1016/j.oraloncology.2008.05.016. [DOI] [PubMed] [Google Scholar]
- 4.Souza C, Pawar U, Chaturvedi P. Precancerous lesions of oral cavity. Otorhinolaryngol Clin. 2009;1:7–14. [Google Scholar]
- 5.Patel SM, Patel KA, Patel PR, Gamit B, Hathila RN, Gupta S. Expression of p53 and Ki-67 in oral dysplasia and squamous cell carcinoma: An immunohistochemical study. Int J Med Sci Public Health. 2014;3:1201–4. [Google Scholar]
- 6.Humayun S, Prasad VR. Expression of p53 protein and ki-67 antigen in oral premalignant lesions and oral squamous cell carcinomas: An immunohistochemical study. Natl J Maxillofac Surg. 2011;2:38–46. doi: 10.4103/0975-5950.85852. [DOI] [PMC free article] [PubMed] [Google Scholar]
- 7.Reddy VM, Kamath A, Radhakrishnan RA. P53 immunoprofiling of potentially malignant oral disorders: A case series analysis. Indian J Cancer. 2012;49:27–32. doi: 10.4103/0019-509X.98913. [DOI] [PubMed] [Google Scholar]
- 8.Chandra P, Agnihotri PG, Nagarathna S. Expression of p53 protein in premalignancies and squamous cell carcinoma of the oral cavity. J Indian Acad Oral Med Radiol. 2012;24:300–5. [Google Scholar]
- 9.Gissi DB, Gabusi A, Servidio D, Cervellati F, Montebugnoli L. Predictive role of p53 protein as a single marker or associated with ki67 antigen in oral leukoplakia: A Retrospective longitudinal study. Open Dent J. 2015;9:41–5. doi: 10.2174/1874210601509010041. [DOI] [PMC free article] [PubMed] [Google Scholar]
- 10.Birajdar SS, Radhika M, Paremala K, Sudhakara M, Soumya M, Gadivan M, et al. Expression of ki-67 in normal oral epithelium, leukoplakic oral epithelium and oral squamous cell carcinoma. J Oral Maxillofac Pathol. 2014;18:169–76. doi: 10.4103/0973-029X.140729. [DOI] [PMC free article] [PubMed] [Google Scholar]
- 11.Ara N, Atique M, Bukhari SG, Akhter F, Jamal S. Immunohistochemical expression of protein p53 in oral epithelial dysplasia and oral squamous cell carcinoma. Oral Pathol. 2011;31:296–9. [Google Scholar]
- 12.Gonzalez-Moles MA, Ruiz- Avila I, Rodriguez-Archilla A, Martinez-Lara I. Suprabasal Expression of Ki-67 Antigen as a marker for the presence and severity of Oral Epithelial Dysplasia. Granada, Spain Head and Neck. 2000;22:658–61. doi: 10.1002/1097-0347(200010)22:7<658::aid-hed3>3.0.co;2-a. [DOI] [PubMed] [Google Scholar]
- 13.Nasser W, Flechtenmacher C, Holzinger D, Hofele C, Bosch FX. Aberrant expression of p53, p16INK4a and ki-67 as basic biomarker for malignant progression of oral leukoplakias. J Oral Pathol Med. 2011;40:629–35. doi: 10.1111/j.1600-0714.2011.01026.x. [DOI] [PubMed] [Google Scholar]
- 14.Álvarez ME, Jiménez-Gómez R, Ardila MC. Immunoexpression of p53 in oral squamous cell carcinoma and oral dysplastic lesions in patients with the habit of reverse smoke. Int J Odontostomat. 2013;7:185–91. [Google Scholar]
- 15.Kurokawa H, Matsumoto S, Murata T, Yamashita Y, Tomoyose T, Zhang M, et al. Immunohistochemical study of syndecan-1 down-regulation and the expression of p53 protein or ki-67 antigen in oral leukoplakia with or without epithelial dysplasia. J Oral Pathol Med. 2003;32:513–21. doi: 10.1034/j.1600-0714.2003.00117.x. [DOI] [PubMed] [Google Scholar]
- 16.Bhattacharya I, Dawson L, Sharma S. Prognostic significance of p53, Ki-67 and Bcl-2 in leukoplakia and squamous cell carcinoma of the oral cavity. Natl J Lab Med. 2017;6:PO16–21. [Google Scholar]
- 17.Maheshwari V, Sharma SC, Narula V, Verma S, Jain A, Alam K. Prognostic and predictive impact of Ki-67 in premalignant and malignant squamous cell lesions of oral cavity. Int J Head Neck Surg. 2013;4:61–5. [Google Scholar]
- 18.Liu SC, Sauter ER, Clapper ML, Feldman RS, Levin L, Chen SY, et al. Markers of cell proliferation in normal epithelia and dysplastic leukoplakias of the oral cavity. Cancer Epidemiol Biomarkers Prev. 1998;7:597–603. [PubMed] [Google Scholar]
- 19.Dwivedi N, Chandra S, Kashyap B, Raj V, Agarwal A. Suprabasal expression of ki-67 as a marker for the severity of oral epithelial dysplasia and oral squamous cell carcinoma. Contemp Clin Dent. 2013;4:7–12. doi: 10.4103/0976-237X.111586. [DOI] [PMC free article] [PubMed] [Google Scholar]
- 20.Takeda T, Sugihara K, Hirayama Y, Hirano M, Tanuma JI, Semba I. Immunohistological evaluation of Ki-67, p63, CK19 and p53 expression in oral epithelial dysplasias. J Oral Pathol Med. 2006;35:369–75. doi: 10.1111/j.1600-0714.2006.00444.x. [DOI] [PubMed] [Google Scholar]