

Abstract
Cerebrospinal fluid (CSF) levels of amyloid-β 42 (Aβ42) and tau have been evaluated as endophenotypes in Alzheimer’s disease (AD) genetic studies. Although there are sex differences in AD risk, sex differences have not been evaluated in genetic studies of AD endophenotypes. We performed sex-stratified and sex interaction genetic analyses of CSF biomarkers to identify sex-specific associations. Data came from a previous genome-wide association study (GWAS) of CSF Aβ42 and tau (1527 males, 1509 females). We evaluated sex interactions at previous loci, performed sex-stratified GWAS to identify sex-specific associations, and evaluated sex interactions at sex-specific GWAS loci. We then evaluated sex-specific associations between prefrontal cortex (PFC) gene expression at relevant loci and autopsy measures of plaques and tangles using data from the Religious Orders Study and Rush Memory and Aging Project. In Aβ42, we observed sex interactions at one previous and one novel locus: rs316341 within SERPINB1 (p=0.04) and rs13115400 near LINC00290 (p=0.002). These loci showed stronger associations among females (β=−0.03, p=4.25×10⁻⁸; β=0.03, p=3.97×10⁻⁸) than males (β=−0.02, p=0. 009; β=0.01, p=0.20). Higher levels of expression of SERPINB1, SERPINB6, and SERPINB9 in PFC was associated with higher levels of amyloidosis among females (corrected p-values<0.02) but not males (p>0.38). In total tau, we observed a sex interaction at a previous locus, rs1393060 proximal to GMNC (p=0.004), driven by a stronger association among females (β=0.05, p=4.57×10⁻¹⁰) compared to males (β=0.02, p=0.03). There was also a sex-specific association between rs1393060 and tangle density at autopsy (pfemale=0.047; pmale=0.96), and higher levels of expression of two genes within this locus were associated with lower tangle density among females (OSTN p=0.006; CLDN16 p=0.002) but not males (p≥0.32). Results suggest a female-specific role for SERPINB1 in amyloidosis and for OSTN and CLDN16 in tau pathology. Sex-specific genetic analyses may improve understanding of AD’s genetic architecture.
Keywords: Alzheimer disease, cerebrospinal fluid biomarkers, neuropathology, sex difference, APOE, amyloid, tau
Introduction
Two-thirds of all prevalent Alzheimer’ disease (AD) cases are female [37, 38], and emerging evidence has highlighted striking sex differences in the genetic drivers [19], clinical severity [25], and neuropathological presentation of AD [2, 4, 28]. The Lancet Neurology Commission thus asserted that a focus on sex differences in AD is essential to advance the field [37]. The identification of sex-specific AD genetic drivers could transform the way treatments are developed and administered and be a critical step towards personalized interventions for AD.
AD is characterized by plaques consisting of aggregated amyloid β (Aβ) and neurofibrillary tangles composed of phosphorylated tau protein [47]. Cerebrospinal fluid (CSF) Aβ42 is a biomarker for brain amyloidosis, while total tau (t-tau) reflects the intensity of neurodegeneration and phosphorylated tau (p-tau) relates to tau pathology [7]. Alterations in both of these proteins are measurable in cerebrospinal fluid (CSF) years prior to the clinical onset of disease [31, 32], and have become a focus of the preclinical characterization of AD [30]. Work over the past five years has sought to elucidate the genetic architecture of CSF amyloid and tau through genome-wide association studies (GWAS) [11, 12, 15]. APOE has a strong association with both CSF amyloid and tau. Recent work from our group [26] and others [1] suggests that the APOE association with t-tau and p-tau is stronger among females compared to males, but there is no sex difference in associations between APOE and amyloidosis. There have been two additional loci identified in relation to amyloidosis, and four related to CSF tau [15]. Yet, sex differences have not been integrated into GWAS studies of CSF AD biomarkers.
This manuscript provides a comprehensive characterization of sex-specific genetic predictors of CSF amyloid and tau. The use of quantitative traits (in this case continuous measures of CSF Aβ42, t-tau, and p-tau) provides additional statistical power and outcome metrics that are more proximal to genetic function. We perform a sex-stratified GWAS of CSF amyloid and tau to identify loci that show disparate associations between males and females. For all sex-specific genome-wide associations, we formally assess whether the association differs by sex. Finally, we leverage transcriptomic data from human prefrontal cortex (PFC) tissue to test whether we observe sex-specific associations between gene expression at the relevant loci and levels of AD neuropathology at autopsy. This work highlights sex-specific markers of amyloid and tau and clarifies the degree to which known loci act in a sex-specific manner.
Methods
Data used here were previously described [15]. Data were acquired from seven studies of cognitive aging, all of which included lumbar puncture and clinical assessments. The quantification of CSF biomarker levels and clinical assessments were completed by each site independently. The Alzheimer Disease Neuroimaging Initiative (ADNI) is a longitudinal, multi-site observational study including AD, mild cognitive impairment (MCI), and elderly cognitively normal controls [42, 46]. The Alzheimer’s Disease Genetics Consortium (ADGC) was formed as a collaboration to utilize the collective resources of the AD research community to conduct GWAS to identify genes associated with late-onset AD risk; data were obtained from the Mayo Clinic (MAYO), University of Pennsylvania (UPENN), and BIOCARD as part of this collaboration [40]. Data from AD cohorts in Sweden were obtained from a multi-center study designed to determine diagnostic accuracy of CSF Aβ42, t-tau, and p-tau [36]. The University of Washington (UW) provided data from a CSF AD biomarker study [33]. Detailed information about the design of each study has been described previously by the ADGC [40], the ADNI [42, 46], Knight ADRC [17], UW [33], or Mattsson et al [36]. Clinical and demographic characteristics of the sample are presented by cohort in suppl. table 1 (Online Resource 2).
Ethics Statement
The Institutional Review Boards of all participating institutions approved the study and research was carried out in accordance with the approved protocols. Written informed consent was obtained from participants or their family members. Secondary analyses of all data were approved by the Vanderbilt University Medical Center IRB.
Genotyping and QC
As previously reported [15], genotyping was completed by each study and imputed using 1000 Genomes Project Phase 3 data. Prior to imputation, all genotype data were processed through the same quality control (QC) protocol, including removing single nucleotide polymorphisms (SNPs) with a poor call rate (<98%) or outside of Hardy-Weinberg equilibrium (p<1×10⁻⁶). Samples were excluded for sex inconsistency (genetically observed compared to self-reported sex) or cryptic relatedness (Pihat≥0.25). APOE was directly genotyped using a Taqman assay [15]. Imputation was completed using IMPUTE2 (version 2.3.2) and genotyping calls were used for all genotypes with a probability of ≥90%. Imputed genotypes were excluded with minor allele frequency (MAF) <2% or information score<0.30. Principal component analyses were conducted and, based on visual inspection of principal component graphs, only individuals that clustered with the European ancestry population from the 1000 Genomes Project were included in the study.
Quantification of Biomarker Outcomes
Harmonization procedures for the CSF analyses have been described [15]. Briefly, raw values were log-transformed within each study and centered using the study mean. This normalization approach has been leveraged previously [15] and is an effective approach to minimize the influence of study differences in assays used to measure the CSF analytes. For the present analyses we excluded one small dataset from the original analysis, the Saarland University sample from Hamburg (HB), which did not include Clinical Dementia Rating (CDR) or diagnosis and did not include all CSF measures. Our decision to drop HB (n=105) was primarily driven by visual inspection of outcome distributions that revealed an inequivalent variance structure in HB relative to the other datasets. Secondary analyses were performed that check for study specific effects including meta-analysis and the comparison of regression coefficients across datasets.
Autopsy Measures of Gene Expression and Neuropathology
We leveraged data from the Religious Orders Study/Memory and Aging Project (ROS/MAP) through the Accelerating Medicines Partnership AD project (https://www.synapse.org/#!Synapse:syn2580853/wiki/). ROS began in 1994 and involves older Catholic nuns, priests, and brothers recruited from across the US. MAP began in 1997 and involves older lay persons recruited from retirement communities, subsidized housing facilities, and social service agencies in the Chicago metropolitan area. Participants in ROS/MAP enrolled without dementia and agreed to annual clinical evaluations and organ donation [5, 6]. RNA expression levels were obtained from frozen sections of the dorsolateral prefrontal cortex (PFC) that were manually dissected from postmortem brain tissue. Details of RNA extraction, processing, QC, and normalization have been published [34]. RNA was isolated using the RNeasy lipid tissue kit (Qiagen, Valencia, CA) and was reverse transcribed and biotin-UTP labeled using the llumina® TotalPrep™ RNA Amplification Kit from Ambion (Illumina, San Diego, CA). Expression signals were generated using the Beadstudio software suite (Illumina, San Diego, CA). Standard control and normalization methods were employed to account for technical variability due to differences in hybridization dates. For the present analyses, low abundance genes (expressed in <10% of the cohort) were filtered out from analyses to reduce confounding due to floor effects.
Amyloid-β load and tau tangles were measured using immunohistochemistry and quantified by image analysis and stereology [5, 6]. For amyloid-β load, we used levels of Aβ measured in 8 cortical regions of the brain [5, 6]. For tangle density, we used levels of abnormally phosphorylated tau measured with AT8 antibody across 8 brain regions [5, 6]. 362 males and 704 females had both neuropathology and SNP data available for analysis, and 207 males and 374 females had both neuropathology and gene expression data available.
Posthoc Analyses of Memory Performance, Executive Function Performance, and Hippocampal Volume
Genome-wide associated SNPs were further evaluated for associations with memory, executive function, and hippocampal volume using ADNI data. Composite measures of memory and executive function have been quantified previously [10, 22], and hippocampal volumes were quantified using FreeSurfer [13, 20, 21] as previously described [39]. ICV-adjusted hippocampal volumes were generated from residuals of a linear regression between raw volumes and ICV among cognitively normal participants at baseline [50].
Statistical Analyses
Statistical analyses were completed using PLINK (Version 1.9, https://www.cog-genomics.org/plink/1.9) and RStudio (Version 1.0.136; https://www.rstudio.com/). Additive genetic coding was used for all analyses, and all analyses included covariates for age (at CSF acquisition), cohort, and the first two population principal components. Sex-specific analyses were then evaluated using the same covariates stratifying by males and females. For sex-interaction analyses a sex x SNP interaction term was included in the original statistical model.
To identify sex differences at known loci, we re-evaluated the most significant single-SNP associations from seven genome-wide significant loci for Aβ42, t-tau, and p-tau (p-tau181 specifically) that had been published [15]. We noted any loci with a significant sex-interaction effect (nominal p<0.05) on the published outcome and corrected for the seven SNPs evaluated. Next, to identify novel sex-specific loci, we assessed all GWAS markers for associations within one sex using the established GWAS threshold for statistical significance (α=5×10⁻⁸). All significant sex-stratified effects were also assessed for sex interactions to test whether the coefficients differed by sex. Sex-stratified Miami plots were generated using EasyStrata (version 16.0) [51]. Genomic inflation factors for the genome-wide association analyses ranged from λ=1.00–1.03 (suppl. figure 1 [Online Resource 1]).
Sex-specific loci identified in candidate and genome-wide analyses were further evaluated for functional significance. Expression quantitative trait loci (eQTL) analyses were completed using published gene expression data from Braineac (http://www.braineac.org/) and the Genotype-Tissue Expression project (GTEx; www.gtexportal.org) [23, 24, 35]. For eQTL association analyses, we corrected for the total number of tissue-gene combinations using the false discovery rate (FDR) procedure.
Additional analyses were completed using the measures outlined above. We evaluated SNP associations with the relevant neuropathology covarying for age at death and education. Next, we tested sex-stratified and sex interaction associations between PFC expression of genes implicated in eQTL analyses and the neuropathology of interest, correcting for multiple comparisons using the FDR procedure. If Braineac and GTEx did not provide strong eQTL evidence at a given locus, we evaluated all genes within the cis region of the locus (i.e., 1 MB upstream and downstream of the SNP) and corrected for multiple comparisons using the FDR procedure.
To explore if genome-wide associated SNPs were correlated with biomarkers of AD risk and progression, we tested for associations with adjusted hippocampal volume, episodic memory performance, and executive function performance in ADNI participants at baseline and over time. Linear regression covarying for age at baseline was used for cross-sectional analyses. Mixed-effects linear regression was used for longitudinal analyses. Fixed effects included age at baseline, SNP, interval (modeled as time in years from baseline), and a SNP x interval interaction term. Random effects included the intercept and time interval. All analyses were run in the entire ADNI cohort (males and females), in males only, in females only, and in the entire cohort including a SNP x sex interaction. Additionally, sex-stratified and sex interaction results were also calculated from a recently published age-of-onset analysis of AD [29]. Raw genotype data were only available from GERAD and ADGC, so we restricted analyses to these two groups. Survival analysis followed the original procedures first stratified by males and females and second testing SNP x sex interactions.
Role of the Funding Source
The funders of the study had no role in the collection, analysis, or interpretation of data; in the writing of the report; or in the decision to submit the paper for publication. The corresponding author had full access to all the data in the study and had final responsibility for the decision to submit for publication.
Results
Clinical and demographic characteristics of the sample are presented by sex in Table 1 and by cohort in suppl. table 1 (Online Resource 2). In the combined sample across cohorts, females were younger (p<0.001), had lower levels of CSF amyloid than males (p=0.01), and were less likely to have a diagnosis of AD (p<0.001) compared to males. Males and females did not differ in levels of normalized CSF t-tau, normalized CSF p-tau, or APOE ε4 carrier status (p-values>0.10), but did differ on CSF Aβ42 (p=0.01). Given the difference in age, secondary analyses were performed matching for age and stratifying by diagnosis. The sex difference in CSF Aβ42 was not present in the age-matched subgroup (p=0.18). Methodology, participant characteristics, and detailed results for age-matched analyses are presented in suppl. methods (Online Resource 1) and suppl. tables 2–11 (Online Resource 2).
Table 1.
Participant Characteristics
| Males | Females | P | |
|---|---|---|---|
| Sample Size (n) | 1527 | 1509 | -- |
| Age (years) | 73.06 ± 10.66 | 70.85 ± 10.93 | <0.001 |
| % APOE ε4 | 43% | 45% | 0.15 |
| % CDR > 0 | 51% | 44% | <0.001 |
| Normalized CSF Aβ42 (pg/mL)* | −0.03 ± 0.17 | −0.02 ± 0.16 | 0.01 |
| Normalized CSF Total Tau (pg/mL)* | −0.05 ± 0.23 | −0.05 ± 0.24 | 0.67 |
| Normalized CSF Phosphorylated Tau (pg/mL)* | −0.04 ± 0.20 | −0.04 ± 0.21 | 0.82 |
CSF levels of tau, ptau, and Aβ42 were log10-transformed and the mean from each data set was standardized to zero to account for the different platforms used by different studies to measure protein levels.
CDR=Clinical Dementia Rating
Sex Differences for the Top SNP at Previously Published Loci
Sex interaction and sex-stratified results for the SNPs with the strongest reported associations at published GWAS loci are presented in Table 2. For Aβ42 analyses, we observed a significant interaction between sex and rs316341 on chromosome 6 (p=0.04, corrected p=0.28), whereby the association was genome-wide among females (p=4.25×10⁻⁸, corrected-p<0.001) compared to a nominal association among males (p=0.009, corrected-p=0.06). The association between rs316341 and Aβ42 was observed in age-matched cognitively normal controls (females: n=615, β=−0.04, p=0.0002; males: n=615, β=−0.03, p=0.001) but did not reach statistical significance in cases (females: n=613, p=0.14; males: n=613, p=0.42). In t-tau analyses, the previously identified locus on chromosome 3 (rs35055419) showed a genome-wide association among females (p=2.57×10⁻⁸, corrected-p<0.001) but a nominal association among males (p=0.0003, corrected-p=0.002). However, the sex x SNP interaction did not reach statistical significance (p=0.17, corrected-p=1). Nominal association between rs35055419 and t-tau was observed in age-matched controls (females β=0.04, p=3.75×10⁻⁴; males β=0.03, p=0.02) and cases (females β=0.03, p=0.04; males β=0.04, p=0.003).
Table 2.
Sex-Specific Effects of Previously Reported Loci
| SNP | Chr | Gene+ | Function | CSF Aβ42 | |||||||
|---|---|---|---|---|---|---|---|---|---|---|---|
| Original β (SE) |
Original P | Male β (SE) |
Male P | Female β (SE) |
Female P | Interaction β (SE) |
Interaction P | ||||
| rs185031519 | 1 | GLIS1 | Intergenic | −0.06 (0.01) |
2.08×10⁻⁸ | −0.06 (0.01) |
1.06×10⁻⁴ | −0.06 (0.02) |
7.92×10⁻⁵ | −0.003 (0.02) |
0.90 |
| rs316341 | 6 | SERPINB1 | Intronic | −0.025 (0.004) |
1.72×10⁻⁸ | −0.02 (0.01) |
0.009 | −0.03 (0.01) |
4.25×10⁻⁸ | −0.02 (0.01) |
0.04* |
| rs769449 | 19 | APOE | Intronic | −0.10 (0.005) |
4.78×10−94 | −0.11 (0.01) |
3.29×10−53. | −0.09 (0.01) |
6.76×10−43 | 0.01 (0.01) |
0.31 |
| SNP | Chr | Gene+ | Function | CSF Total Tau | |||||||
|
Original β (SE) |
Original P |
Male β (SE) |
Male P |
Female β (SE) |
Female P |
Interaction β (SE) |
Interaction P | ||||
| rs35055419 | 3 | GMNC | Intergenic |
0.04 (0.01) |
3.07×10⁻¹¹ | 0.03 (0.01) |
0.0003 |
0.05 (0.01) |
2.57×10⁻⁸ | 0.02 (0.01) |
0.17 |
| rs769449 | 19 | APOE | Intronic |
0.08 (0.01) |
4.05×10⁻²⁹ |
0.07 (0.01) |
4.41×10⁻¹² |
0.09 (0.01) |
5.58×10⁻²⁰ | 0.02 (0.01) |
0.10 |
| SNP | Chr | Gene+ | Function | CSF Phosphorylated Tau | |||||||
|
Original β (SE) |
Original P |
Male β (SE) |
Male P |
Female β (SE) |
Female P |
Interaction β (SE) |
Interaction P | ||||
| rs9527039 | 13 | PCDH8 | Intergenic | −0.06 (0.01) |
5.95×10⁻⁹ | −0.05 (0.01) |
0.002 | −0.08 (0.02) |
5.64×10⁻⁷ | −0.03 (0.02) |
0.15 |
| rs12961169 | 18 | CTDP1 | Intergenic |
0.05 (0.01) |
5.12×10⁻¹⁰ | 0.05 (0.01) |
1.16×10⁻⁵ | 0.05 (0.01) |
3.58×10⁻⁵ | −0.004 (0.02) |
0.81 |
| rs35055419 | 3 | GMNC | Intergenic |
0.04 (0.01) |
7.62×10⁻¹⁰ | 0.03 (0.01) |
0.0002 | 0.04 (0.01) |
1.48×10⁻⁶ | 0.01 (0.01) |
0.45 |
| rs514716 | 9 | GLIS3 | Intronic | −0.05 (0.01) |
2.94×10⁻⁸ | −0.04 (0.01) |
0.0004 | −0.05 (0.01) |
3.45×10⁻⁵ | −0.01 (0.02) |
0.51 |
| rs769449 | 19 | APOE | Intronic |
0.08 (0.01) |
5.30×10⁻³³ |
0.07 (0.01) |
5.83×10⁻¹⁴ |
0.09 (0.01) |
4.31×10⁻²² | 0.02 (0.01) |
0.10 |
Boldface font signifies genome-wide significant association
indicates interaction p<0.05.
Gene listed is the closest gene and may not be the functional gene.
We did not observe a significant sex interaction between SNPs in the APOE locus and any of the CSF biomarkers (p>0.10, suppl. table 12 [Online Resource 2]). We have previously published a sex x APOE-ε4 interaction on CSF t-tau and p-tau levels [26], and when meta-analyzing across cohorts here we also observed a sex difference in the association between APOE-ε4 and t-tau (p=0.008). Further, when meta-analyzing across the datasets included here (evaluating the APOE locus determined by Taqman genotyping of rs7412 and rs429358) and the non-overlapping datasets previously published, we confirmed a sex x APOE-ε4 interaction on both t-tau (β=0.21, p=0.00002) and p-tau (β=0.13, p=0.01). In eight out of the nine datasets analyzed across the two studies, the point estimate for the APOE-ε4 association with CSF t-tau was larger among females compared to males (suppl. figure 2 [Online Resource 1]).
Genome-Wide Sex-Specific Associations
Significant sex-stratified GWAS loci (outside APOE) are presented in Table 3. In CSF Aβ42 analyses (Figure 1; suppl. tables 6 and 7 [Online Resource 2]) rs13115400 on chromosome 4 was significant among females (p=4.61×10⁻⁸, corrected-p=0.046), but not among males (p=0.19, interaction p=0.003, corrected-p-values=1.0). As highlighted above, one previous SNP on chromosome 6, rs316341, also showed a genome wide significant association with CSF Aβ42 among females but not males. In CSF t-tau analyses (Figure 2; suppl. tables 8 and 9 [Online Resource 2]), a SNP within the same chromosome 3 locus previously identified by Deming et al. [15] (near GMNC) was associated among females (rs1393060, p=8.27×10⁻¹⁰, corrected-p=0.0008), with only a nominal association among males (p=0.03, interaction p=0.004, corrected-p-values=1). The female-specific association was also present when evaluating age-matched controls (females β=0.04, p=0.0008; males β=0.01, p=0.26), but was more comparable among age-matched cases (females β=0.04, p=0.0004; males β=0.03, p=0.04). Locus zoom plots for CSF Aβ42 and t-tau are presented in suppl. figures 3 and 4 (Online Resource 1). There were no sex-specific associations with p-tau that met genome-wide significance (p<5×10⁻⁸) with the exception of the APOE locus (suppl. figure 5 [Online Resource 1], suppl. tables 10 and 11 [Online Resource 2]).
Table 3.
Genome-Wide Sex-Specific Effects
| SNP | Chr | Gene+ | Function | CSF Aβ42 | |||||
|---|---|---|---|---|---|---|---|---|---|
| Male β (SE) |
Male P | Female β (SE) |
Female P | Interaction β (SE) |
Interaction P | ||||
| rs13115400 | 4 | LINC00290 | Intergenic | 0.01 (0.01) |
0.20 |
0.03 (0.01) |
3.97×10⁻⁸ | 0.03 (0.01) |
0.002* |
| rs316341 | 6 | SERPINB1 | Intronic | −0.02 (0.01) |
0.009 | −0.03 (0.01) |
4.25×10⁻⁸ | −0.02 (0.01) |
0.04* |
| SNP | Chr | Gene+ | Function | CSF Total Tau | |||||
|
Male β (SE) |
Male P |
Female β (SE) |
Female P |
Interaction β (SE) |
Interaction P | ||||
| rs1393060 | 3 | GMNC | Intergenic | 0.02 (0.01) |
0.03 |
0.05 (0.01) |
4.57×10⁻¹⁰ | 0.03 (0.01) |
0.004* |
Boldface font signifies genome-wide significant association
indicates interaction p<0.05.
Gene listed is the closest gene and may not be the functional gene.
Fig. 1. Sex-Stratified Genome-Wide Association Results for CSF Aβ42.
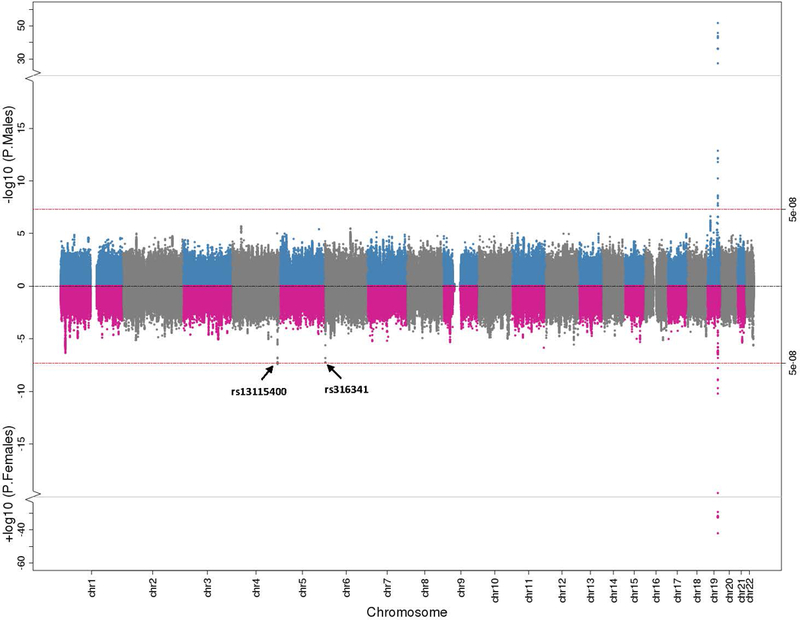
Miami plot illustrating CSF Aβ42 genome-wide association results stratified by males and females. Male findings are plotted in blue and grey on the top and female results are plotted in pink and grey at the bottom. The red lines at the top and bottom represent the genome-wide threshold for statistical significance (p<5×10⁻⁸).
Fig. 2. Sex-Stratified Genome-Wide Association Results for CSF Tau.
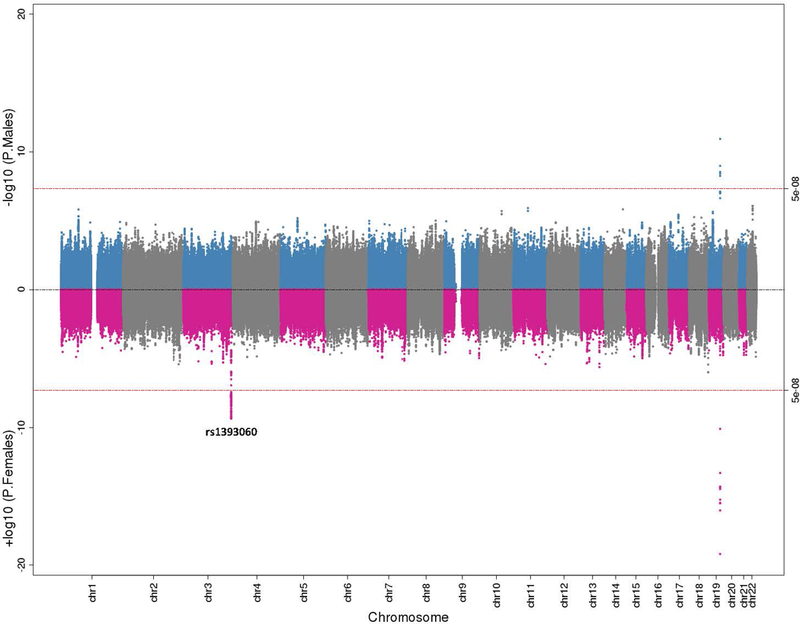
Miami plot illustrating CSF total tau genome-wide association results stratified by males and females. Male findings are plotted in blue and grey on the top and female results are plotted in pink and grey at the bottom. The red lines at the top and bottom represent the genome-wide threshold for statistical significance (p<5×10⁻⁸).
We also analyzed each dataset separately and performed meta-analyses for the three loci identified in candidate and GWAS analyses. The directions of effect for all three identified SNPs were consistent within sex and across studies analyzed separately. Results from meta-analyses were consistent with the joint analysis (suppl. figures 6–8 [Online Resource 1]). Age-matched results are presented in suppl. tables 6–11 (Online Resource 2), and estimates for GWAS SNPs remain consistent, suggesting observed associations are not driven by age differences.
eQTL Results for Sex-Specific Associations
For Aβ42, one previously identified SNP (rs316341) and one novel SNP (rs13115400) showed sex-specific associations and were further evaluated for eQTL associations. For rs316341, significant eQTL associations across all 10 brain tissues in Braineac were seen with SERPINB1, SERPINB6, and SERPINB9 (aveALL p-values<0.0012, FDR-corrected aveALL p-values=0.047; suppl. table 13 [Online Resource 2]). This eQTL signal appears to be driven by gene expression in the hippocampus (p=4.3×10⁻⁵, corrected-p[all tissue gene combinations]=0.13; 6.5×10⁻⁵, corrected-p=0.20 for SERPINB1 and SERPINB9, respectively). Similarly in GTEx, significant eQTL associations were observed with SERPINB1 expression in brain cerebellar hemisphere (p=4.9×10⁻⁶, corrected-p=0.013) and transformed fibroblasts (p=1×10⁻⁵, corrected-p=0.013) and with SERPINB9 pseudogene 1 (RP11–420G6.4) expression in the cortex of the brain (p=1.4×10⁻⁶, corrected-p=0.005; suppl. table 14 [Online Resource 2]). No significant eQTL associations for rs13115400 were observed in Braineac (suppl. table 15 [Online Resource 2]) or GTEx.
For t-tau, the top female-specific association within the chr. 3 locus was rs1393060 and was further evaluated for eQTL associations. In Braineac, we did not observe any eQTL association that survived correction for multiple comparisons. However, the strongest observed association was between rs1393060 and osteocrin (OSTN) expression in the frontal cortex (p=0.00057, corrected-p=0.86; suppl. table 16 [Online Resource 2]). No significant eQTL associations were observed in tissues within the GTEx database.
Autopsy Validation and Extension of Sex-Specific Effects
The three identified SNPs with potential sex-specific effects on CSF biomarker levels (rs1393060, rs13115400, and rs316341) were tested for sex differences in AD neuropathology. None of the three SNPs had a significant sex interaction (Table 4), but rs1393060 did show evidence of an association with tau density at autopsy among females (p=0.047, corrected-p=0.14) but not males (p=0.96, corrected-p=1; Table 4).
Table 4.
Replication of Sex-Specific Effects in Autopsy Samples from ROS/MAP
| SNP | Chr | Gene+ | Function | Amyloid Burden | |||||
|---|---|---|---|---|---|---|---|---|---|
| Male β (SE) |
Male P | Female β (SE) |
Female P | Interaction β (SE) |
Interaction P | ||||
| rs316341 | 6 | SERPINB1 | Intronic | 0.19 (0.10) |
0.06 | −0.001 (0.07) |
0.99 | −0.18 (0.12) |
0.14 |
| rs13115400 | 4 | LINC00290 | Intergenic | 0.02 (0.09) |
0.79 | 0.07 (0.06) |
0.24 | 0.06 (0.11) |
0.59 |
| SNP | Chr | Gene+ | Function | Neuronal Neurofibrillary Tangles | |||||
|
Male β (SE) |
Male P |
Female β (SE) |
Female P |
Interaction β (SE) |
Interaction P | ||||
| rs1393060 | 3 | GMNC | Intergenic | −0.01 (0.10) |
0.93 |
0.14 (0.07) |
0.047 | 0.16 (0.12) |
0.18 |
Boldface font signifies p<0.05.
Gene listed is the closest gene and may not be the functional gene.
Given the strong eQTL evidence for rs316341 on SERPINB1, SERPINB6, and SERPINB9, PFC expression of these three genes was further assessed for sex-specific associations with amyloid burden (suppl. table 17 [Online Resource 2]). Consistent with SNP results, we observed associations between expression levels of SERPINB1 (β[SE]=0.08[0.03], p=0.010, corrected-p=0.011), SERPINB6 (β=0.02[0.004], p=0.0002, corrected-p=0.0004; Figure 3) and SERPINB9 (β[SE]=0.17[0.07], p=0.011, corrected-p=0.011) with amyloid-β load among females that were not observed among males (p-values>0.43). Sex interactions were not statistically significant.
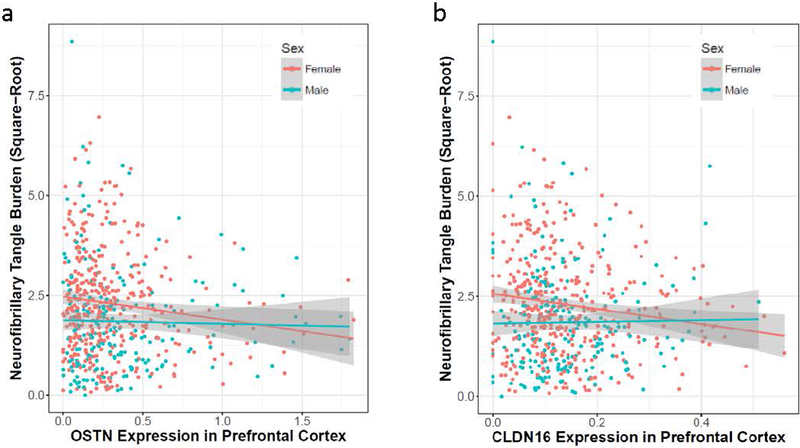
Fig. 3. Significant Sex-Specific Gene Expression Associations with Tangle Pathology Among Genes in the rs1393060 Locus.

(a) OSTN and (b) CLDN16 expression in the prefrontal cortex are presented on the X-axis, square-root transformed neurofibrillary tangle burden (measured with immunohistochemistry) is presented on the Y-axis. Females are presented in red and males are presented in blue.
There was not strong eQTL evidence at the rs1393060 locus, so we evaluated all 18 genes in cis that were measured in ROS/MAP autopsy samples. Of these 18 genes, four genes showed an association with tangle density across sexes, including RP11–1976K.1, CLDN16, GMNC, and OSTN (suppl. table 18 [Online Resource 2]). Interestingly, both CLDN16 and OSTN showed a significant association among females (corrected-p-values=0.040), but not among males (p-values≥0.32). As displayed in Figure 4, higher levels of both OSTN and CLDN16 were associated with lower tangle density among females.
Fig. 4. Significant Sex-Specific Gene Expression Association Between SERPINB6 Expression in the Prefrontal Cortex and Amyloid Burden.
SERPINB6 expression in the prefrontal cortex are presented on the X-axis, square-root transformed amyloid burden (measured with immunohistochemistry) is presented on the Y-axis. Females are presented in red and males are presented in blue. Individuals with an amyloid burden value of 0 in the figure did not show IHC evidence of amyloidosis at autopsy.
We did not observe strong eQTL evidence at the rs13115400 locus, so we evaluated all five cis genes available for analysis (suppl. table 19 [Online Resource 2]). Three genes showed significant associations, two of which were associated just in females (AC108142.1 and TENM3, corrected-p≤0.0018) and one just in males (RP11–433O3.1, corrected-p=0.0074). There were no significant sex-interactions.
Results from the posthoc analyses of hippocampal volume, memory, and executive function are presented in suppl. table 20 (Online Resource 2). In both males and females combined, we observed an association between rs1393060 and both memory (β=−0.08, p=0.045) and executive function (β=−0.12, p=0.011) performance but did not observe any sex-specific associations. Results from posthoc survival analyses using age-of-onset data from IGAP are presented in suppl. table 21 (Online Resource 2). In the ADGC, rs1393060 and rs316341 were significantly associated among females (p<0.01), but not males (p>0.1). A significant sex interaction was observed for rs316341 (p=0.009). No associations were observed in the GERAD dataset.
Discussion
We evaluated sex specific genetic associations with biomarkers of AD neuropathology measured in CSF. We observed female-specific associations with amyloid levels in one previously identified locus on chromosome 6 and one novel locus on chromosome 4, both of which did not show an association among males. For t-tau, we confirmed that the APOE association is stronger among females compared to males [26] and provide new evidence that the previously observed t-tau association on chromosome 3 is driven by females. Finally, we provide functional evidence that the sex-specific association on chromosome 6 is driven by a female-specific effect of SERPINB1 gene expression levels on amyloidosis, and that the sex-specific association at chromosome 3 may be driven by a female-specific association between OSTN or CLDN16 expression on t-tau levels. Together, our results highlight the importance of sex considerations in models of AD risk, suggesting potential candidate pathways that may differentially drive AD neuropathology among males and females.
We provide evidence that genetic variation within Serpin Family B Member 1 (SERPINB1) is related to amyloidosis, particularly among females. A similar sex-specific association was also observed in posthoc age-of-onset analyses, in which the minor allele of rs316341 was associated with an earlier age-of-onset among females, but not males. Our eQTL and PFC expression results provide support for SERPINB1’s potential role in amyloidosis, particularly among females. Serpins are a family of protease inhibitors that are expressed ubiquitously including all cell types of the brain. Serpins have been implicated as potential inhibitors of Aβ toxicity [48], likely through a role in regulating neutrophil infiltration [18] in response to amyloidosis [15]. Neutrophil response is sex dimorphic and modulated by sex hormones in rats [14], and there is evidence that estrogen has direct effects on neutrophil infiltration and clearance [43]. In total, our results suggest that SERPINB1 may be associated with amyloidosis in a sex-specific manner, with evidence suggesting it is a particularly relevant predictor among females. The previous work on SERPINB1 and neutrophil signaling highlights the need to better understand how gonadal hormonal changes in late life may impact the innate immune response to amyloidosis.
For t-tau, our results suggest a fundamental shift in the interpretation of GMNC region. Our results suggest the association at this locus is notably stronger in females than in males, with a similar female-specific association observed in relation to age-of-onset in posthoc survival analyses. Further, our eQTL and gene expression results highlight comparable sex-specific effects in the associations between two genes in this locus and brain tau levels, suggesting the SNP association may be partially driven by OSTN or CLDN16 rather than GMNC. OSTN expression levels are down-regulated in human neurons that are grafted into the brain of an AD mouse model [16], suggesting OSTN may be modulated by the presence of amyloidosis. It is also notable that OSTN is regulated by neuronal activity, but only in the primate brain, suggesting involvement in higher-order brain functions that are specific to primates [3]. OSTN is highly expressed in the neocortex of primates, and regulates dendritic growth [3]. Outside of the brain, the primary role of OSTN is in bone development, and OSTN responds to low-dose estradiol treatment in vitro [8], leaving open the possibility that OSTN function in brain may act in a hormone-dependent manner. Another candidate gene in this region was claudin 16 (CLDN16). CLDN16 is a tight junction protein with a role in renal magnesium processing [27]. Other claudins have been implicated in AD previously [44, 49], and claudins 1, 11, and 16 are differentially expressed in the kidney of male compared to female rats [45]. Together with our results, these previous findings highlight CLDN16 and OSTN as strong candidate genes that may have a sex-specific association with CSF t-tau.
One novel association locus on chromosome 4 was identified in amyloid analyses and showed a stronger association among females compared to males. The signal was proximal to a non-protein coding RNA LINC00290, but we did not observe any eQTL associations in the region. In gene expression analyses, we observed some evidence of a comparable female-specific association between gene expression and amyloidosis for one gene in this locus, teneurin transmembrane protein 3 (TENM3). TENM3 is involved in neuronal development, axon guidance, and retinal mapping, and mutations in the gene cause the eye disorder microphthalmia [9]. TENM3 has not been implicated in AD previously, but represents an interesting candidate gene for follow-up.
It is notable that the sex-specific associations observed in relation to amyloid and tau appeared to be driven by differences among the cognitively normal individuals in age-matched stratified analyses. However, the interpretation of results is challenging given the small sample size of the analyzed sub-groups. One possibility is that the observed sex-specific genetic effects are associated with deposition that occurs in the preclinical stage of disease, but larger datasets will be needed to fully explore the complex interplay between sex-specific genetic risk, age, and clinical status.
We also confirmed the sex difference in the association between APOE and CSF tau levels whereby females show a stronger association than males. We previously published this sex difference in a subset of the datasets here, and two additional datasets not included in this analysis (which lacked GWAS data) [26]. Across all the non-overlapping studies, the estimate of the sex interaction is strong. Only the Mayo dataset (see Table 1) showed an inverse direction of effect whereby the association between APOE and CSF total tau was slightly and non-significantly stronger in males compared to females. The Mayo dataset included the lowest percentages of females and APOE carriers and included older individuals on average, which may contribute to the divergent signal. Additional work is needed, particularly focusing on how selection criteria that emphasize memory impairment and a family history of AD could contribute to the observed sex difference in APOE associations with tau. Currently, the preponderance of data support a stronger association between APOE and tau among females.
The present study has multiple strengths, including the large sample size, clinical characterization in most datasets, inclusion of comprehensive eQTL analyses, and autopsy follow-up analyses that identified functional candidate genes that had sex-specific associations with AD neuropathology. Our results highlight the value of sex-specific analytical models for genetic association studies.
Our study has limitations. Our sample size did not provide adequate power to complete a full genome-wide interaction analysis that may highlight gene signals in opposite directions. The samples analyzed come from cohort studies that are highly educated and primarily White, limiting generalizability. Although we covaried for age and evaluated both age-matched and diagnosis stratified models, the sex differences in age and diagnosis are notable. A more carefully matched sample will be needed to better understand how sex differences in genetic risk for AD neuropathology change over the course of aging and disease. It is notable that the sex difference in the association between APOE and AD varies by age [41], suggesting that larger samples will be needed to better model genetic interactions with age on AD biomarker levels. Our gene expression results from ROS/MAP were measured from prefrontal cortex tissue, which was previously selected for measurement due to its relevance to human cognition and AD. However, RNA was not available from other brain regions for analysis, limiting our ability to evaluate differential associations across brain regions, particularly highly relevant regions like the hippocampus. Measurement in additional regions is ongoing, and future work delineating sex difference in gene expression associations across the brain are warranted.
In conclusion, our work has highlighted sex differences in the genetic predictors of AD biomarkers, including stronger associations between Serpin genes and amyloidosis among females. Modeling sex differences in GWAS analyses provides insights into novel genetic signals associated with disease, and provides a helpful framework for prioritizing and evaluating functional candidate genes.
Supplementary Material
Acknowledgements
We thank all the participants and their families, as well as the many institutions and their staff that provided support for all studies involved in this collaboration. We thank the study participants and staff of the Rush Alzheimer’s Disease Center and of the Kaiser Permanente (formerly Group Health)/ University of Washington Adult Changes in Thought study. We also thank the Alzheimer Disease Genetic Consortium (ADGC) for genotyping and providing data for the BIOCARD, UPENN, and MAYO cohorts.
ADNI
Data collection and sharing for this project was funded by the Alzheimer’s Disease Neuroimaging Initiative (ADNI) (National Institutes of Health Grant U01 AG024904) and DOD ADNI (Department of Defense award number W81XWH-12–2-0012). ADNI is funded by the National Institute on Aging, the National Institute of Biomedical Imaging and Bioengineering, and through generous contributions from the following: AbbVie, Alzheimer’s Association; Alzheimer’s Drug Discovery Foundation; Araclon Biotech; BioClinica, Inc.; Biogen; Bristol-Myers Squibb Company; CereSpir, Inc.; Cogstate; Eisai Inc.; Elan Pharmaceuticals, Inc.; Eli Lilly and Company; EuroImmun; F. Hoffmann-La Roche Ltd and its affiliated company Genentech, Inc.; Fujirebio; GE Healthcare; IXICO Ltd.; Janssen Alzheimer Immunotherapy Research & Development, LLC.; Johnson & Johnson Pharmaceutical Research & Development LLC.; Lumosity; Lundbeck; Merck & Co., Inc.; Meso Scale Diagnostics, LLC.; NeuroRx Research; Neurotrack Technologies; Novartis Pharmaceuticals Corporation; Pfizer Inc.; Piramal Imaging; Servier; Takeda Pharmaceutical Company; and Transition Therapeutics. The Canadian Institutes of Health Research is providing funds to support ADNI clinical sites in Canada. Private sector contributions are facilitated by the Foundation for the National Institutes of Health (www.fnih.org). The grantee organization is the Northern California Institute for Research and Education, and the study is coordinated by the Alzheimer’s Therapeutic Research Institute at the University of Southern California. ADNI data are disseminated by the Laboratory for Neuro Imaging at the University of Southern California.
Funding
This research was supported in part by K01 AG049164, K12 HD043483, K24 AG046373, HHSN311201600276P, S10 OD023680, R01 AG034962, R01 HL111516, R01 NS100980, R01 AG056534, P30 AG10161, RF1 AG15819, R01 AG17917, R01 AG30146, R01 AG019085, R01 AG15819, R01 AG30146, R01 AG027161, R01 AG021155, R01 AG037639, U01 AG46152, U01 AG006781, U01 AG032984, U01 HG004610, U01 HG006375, U24 AG021886, U24 AG041689, R01 AG044546, P01 AG003991, RF1 AG053303, R01 AG035083, R01 NS085419, and the Alzheimer’s Association (NIRG-11–200110), further supported in part by the Intramural Research Program, NIA, NIH and the Vanderbilt Memory & Alzheimer’s Center. YD is supported by an NIMH training grant (T32MH014877). Support for PDJ was provided by R01 AG048015. SK received support from NIA R03 AG050856, Alzheimer’s Association, Michael J Fox Foundation, and ARUK Biomarkers Across Neurodegenerative Diseases (BAND). MR received support from the German Federal Ministry of Education and Research (BMBF) National Genome Research Network (NGFN) Grant No. 01GS08125 and through the Helmholtz Alliance for Mental Health in an Aging Society (HELMA) Grant No. Ha-15. HZ is a Wallenberg Academy Fellow and is further supported but the Swedish and European Research Councils and the UK Dementia Research Institute. KB holds the Torsten Söderberg professorship at the Royal Swedish Academy of Sciences.
The NACC database is funded by NIA/NIH Grant U01 AG016976. NACC data are contributed by the NIA-funded ADCs: P30 AG019610 (PI Eric Reiman, MD), P30 AG013846 (PI Neil Kowall, MD), P50 AG008702 (PI Scott Small, MD), P50 AG025688 (PI Allan Levey, MD, PhD), P30 AG010133 (PI Andrew Saykin, PsyD), P50 AG005146 (PI Marilyn Albert, PhD), P50 AG005134 (PI Bradley Hyman, MD, PhD), P50 AG016574 (PI Ronald Petersen, MD, PhD), P50 AG005138 (PI Mary Sano, PhD), P30 AG008051 (PI Steven Ferris, PhD), P30 AG013854 (PI M. Marsel Mesulam, MD), P30 AG008017 (PI Jeffrey Kaye, MD), P30 AG010161 (PI David Bennett, MD), P30 AG010129 (PI Charles DeCarli, MD), P50 AG016573 (PI Frank LaFerla, PhD), P50 AG016570 (PI David Teplow, PhD), P50 AG005131 (PI Douglas Galasko, MD), P50 AG023501 (PI Bruce Miller, MD), P30 AG035982 (PI Russell Swerdlow, MD), P30 AG028383 (PI Linda Van Eldik, PhD), P30 AG010124 (PI John Trojanowski, MD, PhD), P50 AG005133 (PI Oscar Lopez, MD), P50 AG005142 (PI Helena Chui, MD), P30 AG012300 (PI Roger Rosenberg, MD), P50 AG005136 (PI Thomas Grabowski, MD, PhD), P50 AG033514 (PI Sanjay Asthana, MD, FRCP), and P50 AG005681 (PI John Morris, MD).
Samples from the National Cell Repository for Alzheimer’s Disease (NCRAD), which receives government support under a cooperative agreement grant (U24 AG21886) awarded by the National Institute on Aging (NIA), were used in this study. We thank contributors who collected samples used in this study, as well as patients and their families, whose help and participation made this work possible; Data for this study were prepared, archived, and distributed by the National Institute on Aging Alzheimer’s Disease Data Storage Site (NIAGADS) at the University of Pennsylvania (U24-AG041689–01).
The funders had no role in study design, data collection and analysis, decision to publish, or preparation of the manuscript.
Dr. Larson reports royalties from UpToDate. Dr. Schneider reports personal fees from Avid Radiopharmaceuticals, personal fees from Navidea Biopharmaceuticals, outside the submitted work. Dr. Zetterberg has served at advisory boards of Eli Lilly, Roche Diagnostics and Pharmasum Therapeutics and is one of the founders of Brain Biomarker Solutions in Gothenburg AB, a GU Ventures-based platform company at the University of Gothenburg. Dr. Blennow has served at advisory boards of Alzheon, BioArctic, Eli Lilly, IBL International, Fujirebio, Merck, and Roche Diagnostics and is one of the founders of Brain Biomarker Solutions in Gothenburg AB, a GU Ventures-based platform company at the University of Gothenburg.
Footnotes
Competing Financial Interests
References
- 1.Altmann A, Tian L, Henderson VW, Greicius MD, Alzheimer’s Disease Neuroimaging Initiative I (2014) Sex modifies the APOE-related risk of developing Alzheimer disease. Ann Neurol 75: 563–573 10.1002/ana.24135 [DOI] [PMC free article] [PubMed] [Google Scholar]
- 2.Apostolova LG, Dinov ID, Dutton RA, Hayashi KM, Toga AW, Cummings JL, Thompson PM (2006) 3D comparison of hippocampal atrophy in amnestic mild cognitive impairment and Alzheimer’s disease. Brain 129: 2867–2873 10.1093/brain/awl274 [DOI] [PubMed] [Google Scholar]
- 3.Ataman B, Boulting GL, Harmin DA, Yang MG, Baker-Salisbury M, Yap EL, Malik AN, Mei K, Rubin AA, Spiegel I et al. (2016) Evolution of Osteocrin as an activity-regulated factor in the primate brain. Nature 539: 242–247 10.1038/nature20111 [DOI] [PMC free article] [PubMed] [Google Scholar]
- 4.Barnes LL, Wilson RS, Bienias JL, Schneider JA, Evans DA, Bennett DA (2005) Sex differences in the clinical manifestations of Alzheimer disease pathology. Arch Gen Psychiatry 62: 685–691 10.1001/archpsyc.62.6.685 [DOI] [PubMed] [Google Scholar]
- 5.Bennett DA, Schneider JA, Arvanitakis Z, Wilson RS (2012) Overview and findings from the religious orders study. Curr Alzheimer Res 9: 628–645 [DOI] [PMC free article] [PubMed] [Google Scholar]
- 6.Bennett DA, Schneider JA, Buchman AS, Barnes LL, Boyle PA, Wilson RS (2012) Overview and findings from the rush Memory and Aging Project. Curr Alzheimer Res 9: 646–663 [DOI] [PMC free article] [PubMed] [Google Scholar]
- 7.Blennow K, Hampel H, Weiner M, Zetterberg H (2010) Cerebrospinal fluid and plasma biomarkers in Alzheimer disease. Nat Rev Neurol 6: 131–144 10.1038/nrneurol.2010.4 [DOI] [PubMed] [Google Scholar]
- 8.Bord S, Ireland DC, Moffatt P, Thomas GP, Compston JE (2005) Characterization of osteocrin expression in human bone. J Histochem Cytochem 53: 1181–1187 10.1369/jhc.4C6561.2005 [DOI] [PubMed] [Google Scholar]
- 9.Chassaing N, Ragge N, Plaisancie J, Patat O, Genevieve D, Rivier F, Malrieu-Eliaou C, Hamel C, Kaplan J, Calvas P (2016) Confirmation of TENM3 involvement in autosomal recessive colobomatous microphthalmia. Am J Med Genet A 170: 1895–1898 10.1002/ajmg.a.37667 [DOI] [PubMed] [Google Scholar]
- 10.Crane PK, Carle A, Gibbons LE, Insel P, Mackin RS, Gross A, Jones RN, Mukherjee S, Curtis SM, Harvey D et al. (2012) Development and assessment of a composite score for memory in the Alzheimer’s Disease Neuroimaging Initiative (ADNI). Brain Imaging Behav 6: 502–516 10.1007/s11682-012-9186-z [DOI] [PMC free article] [PubMed] [Google Scholar]
- 11.Cruchaga C, Kauwe JS, Harari O, Jin SC, Cai Y, Karch CM, Benitez BA, Jeng AT, Skorupa T, Carrell D et al. (2013) GWAS of cerebrospinal fluid tau levels identifies risk variants for Alzheimer’s disease. Neuron 78: 256–268 10.1016/j.neuron.2013.02.026 [DOI] [PMC free article] [PubMed] [Google Scholar]
- 12.Cruchaga C, Kauwe JS, Mayo K, Spiegel N, Bertelsen S, Nowotny P, Shah AR, Abraham R, Hollingworth P, Harold D et al. (2010) SNPs associated with cerebrospinal fluid phospho-tau levels influence rate of decline in Alzheimer’s disease. Plos Genet 6: e1001101 10.1371/journal.pgen.1001101 [DOI] [PMC free article] [PubMed] [Google Scholar]
- 13.Dale AM, Fischl B, Sereno MI (1999) Cortical surface-based analysis. I. Segmentation and surface reconstruction. Neuroimage 9: 179–194 10.1006/nimg.1998.0395 [DOI] [PubMed] [Google Scholar]
- 14.Deitch EA, Ananthakrishnan P, Cohen DB, Xu DZ, Feketeova E, Hauser CJ (2006) Neutrophil activation is modulated by sex hormones after trauma-hemorrhagic shock and burn injuries. Am J Physiol Heart Circ Physiol 291: H1456–1465 10.1152/ajpheart.00694.2005 [DOI] [PubMed] [Google Scholar]
- 15.Deming Y, Li Z, Kapoor M, Harari O, Del-Aguila JL, Black K, Carrell D, Cai Y, Fernandez MV, Budde J et al. (2017) Genome-wide association study identifies four novel loci associated with Alzheimer’s endophenotypes and disease modifiers. Acta Neuropathol 133: 839–856 10.1007/s00401-017-1685-y [DOI] [PMC free article] [PubMed] [Google Scholar]
- 16.Espuny-Camacho I, Arranz AM, Fiers M, Snellinx A, Ando K, Munck S, Bonnefont J, Lambot L, Corthout N, Omodho L et al. (2017) Hallmarks of Alzheimer’s Disease in Stem-Cell-Derived Human Neurons Transplanted into Mouse Brain. Neuron 93: 1066–1081 10.1016/j.neuron.2017.02.001 [DOI] [PubMed] [Google Scholar]
- 17.Fagan AM, Mintun MA, Mach RH, Lee SY, Dence CS, Shah AR, LaRossa GN, Spinner ML, Klunk WE, Mathis CA et al. (2006) Inverse relation between in vivo amyloid imaging load and cerebrospinal fluid Abeta42 in humans. Ann Neurol 59: 512–519 10.1002/ana.20730 [DOI] [PubMed] [Google Scholar]
- 18.Farley K, Stolley JM, Zhao P, Cooley J, Remold-O’Donnell E (2012) A serpinB1 regulatory mechanism is essential for restricting neutrophil extracellular trap generation. J Immunol 189: 4574–4581 10.4049/jimmunol.1201167 [DOI] [PMC free article] [PubMed] [Google Scholar]
- 19.Farrer LA, Cupples L, Haines JL, et al. (1997) Effects of age, sex, and ethnicity on the association between apolipoprotein e genotype and alzheimer disease: A meta-analysis. JAMA 278: 1349–1356 10.1001/jama.1997.03550160069041 [PubMed] [Google Scholar]
- 20.Fischl B, Sereno MI, Dale AM (1999) Cortical surface-based analysis. II: Inflation, flattening, and a surface-based coordinate system. Neuroimage 9: 195–207 10.1006/nimg.1998.0396 [DOI] [PubMed] [Google Scholar]
- 21.Fischl B, Sereno MI, Tootell RB, Dale AM (1999) High-resolution intersubject averaging and a coordinate system for the cortical surface. Hum Brain Mapp 8: 272–284 [DOI] [PMC free article] [PubMed] [Google Scholar]
- 22.Gibbons LE, Carle AC, Mackin RS, Harvey D, Mukherjee S, Insel P, Curtis SM, Mungas D, Crane PK, Alzheimer’s Disease Neuroimaging I (2012) A composite score for executive functioning, validated in Alzheimer’s Disease Neuroimaging Initiative (ADNI) participants with baseline mild cognitive impairment. Brain Imaging Behav 6: 517–527 10.1007/s11682-012-9176-1 [DOI] [PMC free article] [PubMed] [Google Scholar]
- 23.GTEx Consortium (2017) Genetic effects on gene expression across human tissues. Nature 550: 204–213 10.1038/nature24277 [DOI] [PMC free article] [PubMed] [Google Scholar]
- 24.GTEx Consortium (2015) Human genomics. The Genotype-Tissue Expression (GTEx) pilot analysis: multitissue gene regulation in humans. Science 348: 648–660 10.1126/science.1262110 [DOI] [PMC free article] [PubMed] [Google Scholar]
- 25.Henderson VW, Buckwalter JG (1994) Cognitive deficits of men and women with Alzheimer’s disease. Neurology 44: 90–96 [DOI] [PubMed] [Google Scholar]
- 26.Hohman TJ, Dumitrescu L, Barnes LL, Thambisetty M, Beecham G, Kunkle B, Gifford KA, Bush WS, Chibnik LB, Mukherjee S et al. (2018) Sex-Specific Association of Apolipoprotein E With Cerebrospinal Fluid Levels of Tau. JAMA Neurol: 10.1001/jamaneurol.2018.0821 [DOI] [PMC free article] [PubMed]
- 27.Hou J, Goodenough DA (2010) Claudin-16 and claudin-19 function in the thick ascending limb. Curr Opin Nephrol Hypertens 19: 483–488 10.1097/MNH.0b013e32833b7125 [DOI] [PMC free article] [PubMed] [Google Scholar]
- 28.Hua X, Hibar DP, Lee S, Toga AW, Jack CR Jr., Weiner MW, Thompson PM, Alzheimer’s Disease Neuroimaging I (2010) Sex and age differences in atrophic rates: an ADNI study with n=1368 MRI scans. Neurobiol Aging 31: 1463–1480 10.1016/j.neurobiolaging.2010.04.033 [DOI] [PMC free article] [PubMed] [Google Scholar]
- 29.Huang KL, Marcora E, Pimenova AA, Di Narzo AF, Kapoor M, Jin SC, Harari O, Bertelsen S, Fairfax BP, Czajkowski J et al. (2017) A common haplotype lowers PU.1 expression in myeloid cells and delays onset of Alzheimer’s disease. Nat Neurosci 20: 1052–1061 10.1038/nn.4587 [DOI] [PMC free article] [PubMed] [Google Scholar]
- 30.Jack CR Jr., Bennett DA, Blennow K, Carrillo MC, Feldman HH, Frisoni GB, Hampel H, Jagust WJ, Johnson KA, Knopman DS et al. (2016) A/T/N: An unbiased descriptive classification scheme for Alzheimer disease biomarkers. Neurology 87: 539–547 10.1212/WNL.0000000000002923 [DOI] [PMC free article] [PubMed] [Google Scholar]
- 31.Jack CR Jr., Knopman DS, Jagust WJ, Petersen RC, Weiner MW, Aisen PS, Shaw LM, Vemuri P, Wiste HJ, Weigand SD et al. (2013) Tracking pathophysiological processes in Alzheimer’s disease: an updated hypothetical model of dynamic biomarkers. Lancet Neurol 12: 207–216 10.1016/S1474-4422(12)70291-0 [DOI] [PMC free article] [PubMed] [Google Scholar]
- 32.Jack CR, Knopman DS, Jagust WJ, Shaw LM, Aisen PS, Weiner MW, Petersen RC, Trojanowski JQ (2010) Hypothetical model of dynamic biomarkers of the Alzheimer’s pathological cascade. Lancet Neurology 9: 119–128 [DOI] [PMC free article] [PubMed] [Google Scholar]
- 33.Li G, Millard SP, Peskind ER, Zhang J, Yu CE, Leverenz JB, Mayer C, Shofer JS, Raskind MA, Quinn JF et al. (2014) Cross-sectional and longitudinal relationships between cerebrospinal fluid biomarkers and cognitive function in people without cognitive impairment from across the adult life span. JAMA Neurol 71: 742–751 10.1001/jamaneurol.2014.445 [DOI] [PMC free article] [PubMed] [Google Scholar]
- 34.Lim AS, Srivastava GP, Yu L, Chibnik LB, Xu J, Buchman AS, Schneider JA, Myers AJ, Bennett DA, De Jager PL (2014) 24-hour rhythms of DNA methylation and their relation with rhythms of RNA expression in the human dorsolateral prefrontal cortex. Plos Genet 10: e1004792 10.1371/journal.pgen.1004792 [DOI] [PMC free article] [PubMed] [Google Scholar] [Retracted]
- 35.Lonsdale J, Thomas J, Salvatore M, Phillips R, Lo E, Shad S, Hasz R, Walters G, Garcia F, Young N et al. (2013) The Genotype-Tissue Expression (GTEx) project. Nat Genet 45: 580 Doi 10.1038/ng.265310.1038/ng.2653https://www.nature.com/articles/ng.2653#supplementary-informationhttps://www.nature.com/articles/ng.2653#supplementary-information [DOI] [PMC free article] [PubMed] [Google Scholar]
- 36.Mattsson N, Zetterberg H, Hansson O, Andreasen N, Parnetti L, Jonsson M, Herukka SK, van der Flier WM, Blankenstein MA, Ewers M et al. (2009) CSF biomarkers and incipient Alzheimer disease in patients with mild cognitive impairment. JAMA 302: 385–393 10.1001/jama.2009.1064 [DOI] [PubMed] [Google Scholar]
- 37.Mazure CM, Swendsen J (2016) Sex differences in Alzheimer’s disease and other dementias. Lancet Neurol 15: 451–452 10.1016/S1474-4422(16)00067-3 [DOI] [PMC free article] [PubMed] [Google Scholar]
- 38.Mielke MM, Vemuri P, Rocca WA (2014) Clinical epidemiology of Alzheimer’s disease: assessing sex and gender differences. Clin Epidemiol 6: 37–48 10.2147/CLEP.S37929 [DOI] [PMC free article] [PubMed] [Google Scholar]
- 39.Mormino EC, Kluth JT, Madison CM, Rabinovici GD, Baker SL, Miller BL, Koeppe RA, Mathis CA, Weiner MW, Jagust WJ et al. (2009) Episodic memory loss is related to hippocampal-mediated beta-amyloid deposition in elderly subjects. Brain 132: 1310–1323 10.1093/brain/awn320 [DOI] [PMC free article] [PubMed] [Google Scholar]
- 40.Naj AC, Jun G, Beecham GW, Wang LS, Vardarajan BN, Buros J, Gallins PJ, Buxbaum JD, Jarvik GP, Crane PK et al. (2011) Common variants at MS4A4/MS4A6E, CD2AP, CD33 and EPHA1 are associated with late-onset Alzheimer’s disease. Nat Genet 43: 436–441 10.1038/ng.801 [DOI] [PMC free article] [PubMed] [Google Scholar]
- 41.Neu SC, Pa J, Kukull W, Beekly D, Kuzma A, Gangadharan P, Wang LS, Romero K, Arneric SP, Redolfi A et al. (2017) Apolipoprotein E Genotype and Sex Risk Factors for Alzheimer Disease: A Meta-analysis. JAMA Neurol 74: 1178–1189 10.1001/jamaneurol.2017.2188 [DOI] [PMC free article] [PubMed] [Google Scholar]
- 42.Petersen RC, Aisen PS, Beckett LA, Donohue MC, Gamst AC, Harvey DJ, Jack CR, Jagust WJ, Shaw LM, Toga AW et al. (2010) Alzheimer’s Disease Neuroimaging Initiative (ADNI) Clinical characterization. Neurology 74: 201–209 [DOI] [PMC free article] [PubMed] [Google Scholar]
- 43.Petrone AB, Simpkins JW, Barr TL (2014) 17beta-estradiol and inflammation: implications for ischemic stroke. Aging Dis 5: 340–345 10.14336/AD.2014.0500340 [DOI] [PMC free article] [PubMed] [Google Scholar]
- 44.Romanitan MO, Popescu BO, Spulber S, Bajenaru O, Popescu LM, Winblad B, Bogdanovic N (2010) Altered expression of claudin family proteins in Alzheimer’s disease and vascular dementia brains. J Cell Mol Med 14: 1088–1100 10.1111/j.1582-4934.2009.00999.x [DOI] [PMC free article] [PubMed] [Google Scholar]
- 45.Sabolic I, Asif AR, Budach WE, Wanke C, Bahn A, Burckhardt G (2007) Gender differences in kidney function. Pflugers Arch 455: 397–429 10.1007/s00424-007-0308-1 [DOI] [PubMed] [Google Scholar]
- 46.Saykin AJ, Shen L, Foroud TM, Potkin SG, Swaminathan S, Kim S, Risacher SL, Nho K, Huentelman MJ, Craig DW et al. (2010) Alzheimer’s Disease Neuroimaging Initiative biomarkers as quantitative phenotypes: Genetics core aims, progress, and plans. Alzheimers & Dementia 6: 265–273 10.1016/j.jalz.2010.03.013 [DOI] [PMC free article] [PubMed] [Google Scholar]
- 47.Scheltens P, Blennow K, Breteler MM, de Strooper B, Frisoni GB, Salloway S, Van der Flier WM (2016) Alzheimer’s disease. Lancet 388: 505–517 10.1016/S0140-6736(15)01124-1 [DOI] [PubMed] [Google Scholar]
- 48.Schubert D (1997) Serpins inhibit the toxicity of amyloid peptides. Eur J Neurosci 9: 770–777 [DOI] [PubMed] [Google Scholar]
- 49.Spulber S, Bogdanovic N, Romanitan MO, Bajenaru OA, Popescu BO (2012) Claudin expression profile separates Alzheimer’s disease cases from normal aging and from vascular dementia cases. J Neurol Sci 322: 184–186 10.1016/j.jns.2012.05.031 [DOI] [PubMed] [Google Scholar]
- 50.Voevodskaya O, Simmons A, Nordenskjold R, Kullberg J, Ahlstrom H, Lind L, Wahlund LO, Larsson EM, Westman E, Alzheimer’s Disease Neuroimaging I (2014) The effects of intracranial volume adjustment approaches on multiple regional MRI volumes in healthy aging and Alzheimer’s disease. Front Aging Neurosci 6: 264 10.3389/fnagi.2014.00264 [DOI] [PMC free article] [PubMed] [Google Scholar]
- 51.Winkler TW, Kutalik Z, Gorski M, Lottaz C, Kronenberg F, Heid IM (2015) EasyStrata: evaluation and visualization of stratified genome-wide association meta-analysis data. Bioinformatics 31: 259–261 10.1093/bioinformatics/btu621 [DOI] [PMC free article] [PubMed] [Google Scholar]
Associated Data
This section collects any data citations, data availability statements, or supplementary materials included in this article.