Abstract
Exposure to p,p′-DDE (DDE), the main bioaccumulative metabolite of the organochlorine insecticide p,p′-DDT, is associated with a higher prevalence of obesity, dyslipidemia, insulin resistance, metabolic syndrome, and immunomodulation. The present study was carried out to determine whether DDE perturbs adipose tissue homeostasis through modulation of macrophage function. Treatment with DDE or a cyclooxygenase-2 inhibitor prior to lipopolysaccharide exposure significantly decreased production of prostaglandins (PG) from J774a.1 macrophages in vitro. Similarly, J774A.1 cell lysates incubated with DDE or a specific cyclooxygenase-2 inhibitor (NS-398) produced significantly less PGE2 and PGF2α. Macrophage polarization studies revealed a pattern of DDE effects that were not fully consistent with a purely pro- or purely anti- M1 or M2 effect. However, DDE suppressed expression of two M1 markers (induced by an M1 stimulus) and enhanced expression of an M2 marker (induced by an M2 stimulus). Further studies including assessment of macrophage function are needed to fully characterize the effects of DDE on macrophage polarization. Obesity is characterized by an increase in the number of resident adipose tissue macrophages. To assess monocyte/macrophage recruitment to the adipose tissue in vivo, male C57Bl/6H mice were treated with 2 mg/kg DDE or corn oil vehicle for 5 days by gavage. Epididymal fat pads were digested and macrophage populations were analyzed by flow cytometry. In DDE-treated animals, there was a significant increase (37%) in F4/80+CD11b+ macrophages/g of epididymal adipose over vehicle (P < .05). Together, these results suggest a role for DDE in the enhancement of adipose tissue macrophage recruitment and/or proliferation, as well as modulation of immune cell function that may contribute to the etiology of metabolic diseases associated with organochlorine exposure.
Keywords: macrophage; p,p′-DDE; adipose; immunomodulation; organochlorine; prostaglandin
A number of cross-sectional epidemiological studies have linked exposure to p,p′-DDE (DDE) with metabolic syndrome (Lim et al., 2010), type 2 diabetes (T2D) and obesity (Lee et al., 2011). DDE, the primary bioaccumulative metabolite of the insecticide, p,p′-DDT, is a persistent lipophilic environmental contaminant that has been detected in the serum and fatty tissues of humans and animals across the globe. DDE is more prevalent environmentally, more lipophilic and less acutely toxic than DDT. Though use of DDT was banned in the United States in 1972, DDE can still be detected in food supplies and human populations in most regions of the world. Recent human cohort studies have established an increased relative risk of developing T2D in individuals with the highest exposure levels (Lee et al., 2011). Additionally, several in vivo studies indicate that rodents fed a high fat diet containing persistent organic pollutants develop several metabolic abnormalities, including increased visceral adiposity and increased macrophage infiltration to adipose tissue, and DDE induces fasting hyperglycemia (Howell III et al., 2014; Ibrahim et al., 2011). DDE has been described as having immunomodulatory effects; the parent compound, p,p′-DDT, was recently found to influence the activation state and activity of macrophages during an inflammatory challenge in vivo, altering hepatic inflammation following lipopolysaccharide (LPS) stimulus (Shimada et al., 2015). Prostaglandin G/H synthase 2, better known as cyclooxygenase-2 (COX-2), and COX-2-derived prostaglandins (PGs), such as PGE2, exert both proinflammatory and anti-inflammatory effects on immune cells, including, but not limited to, macrophages and activated monocytes. For instance, PGE2 induces local inflammation, but also decreases release of inflammatory cytokines from recruited immune cells, limiting the nonspecific immune response to prevent tissue damage (Kalinski, 2012). DDE has been shown to modulate COX-2 mRNA synthesis in smooth muscle cells as well as induce a concentration-dependent decrease in lipid mediator production in activated platelets (Lundholm et al., 1991; Wrobel et al., 2012), and to increase the production of TNF-α, IL-6, IL-1β as well as activate the caspase cascade in peripheral blood mononuclear cells (Alegria-Torres et al., 2009; Wrobel et al., 2012). COX-2 inhibition has been shown to perturb the polarization process, resulting in an altered inflammatory phenotype that may contribute to the development of chronic inflammation. This effect is potentially mediated through the loss of PG signaling downstream of COX-2 inhibition. Resident and recruited macrophages in adipose tissue play an important role in maintaining lipid homeostasis through control of local inflammation. Adipose tissue macrophages (ATM) receive signals from adipocytes and other immune cells that direct their polarization state toward an M1 (inflammatory) or M2 (immunosuppressive) phenotype; however, the extent of polarization and the inherent plasticity of the ATM population is currently unknown.
Increased adiposity, macrophage infiltration into the visceral adipose tissue, and a shift toward chronic low-grade inflammation are hallmarks of the metabolic syndrome and it is possible that the apparent association between DDE exposure and metabolic pathologies may result, in part, from a perturbation in the COX-2 regulatory pathways. Although numerous studies have shown an increase in the number of resident adipose tissue macrophages in obesity, the origin of these cells from either infiltration of monocytes or proliferation of resident cells and their relative contribution to the local adipose microenvironment, and their overall plasticity remain largely undefined. DDE accumulates in the adipose tissue, partitioning into the fat at a rate of approximately 160:1 compared with circulating levels (López-Carrillo et al., 1999). Resident adipose tissue macrophages would presumably encounter high levels of the contaminant (due to the lipophilicity of DDE and its tendency to accumulate in adipose tissue) and would likely be susceptible to any immunotoxic effects it may exert.
In this study, the ability of DDE to perturb macrophage reactivity was tested in vitro using murine J774A.1 macrophages. It was found that DDE or COX-2 inhibitor treated macrophages exhibited perturbed prostaglandin biosynthesis following inflammatory challenge. In addition, our data showed that exposure to DDE altered the expression of two key markers of murine M1 and M2 macrophage polarization, nitric oxide synthase (Nos2) and Arginase-1 (Arg1), respectively. This is the first report indicating DDE can alter expression of macrophage markers of polarization. Furthermore, we showed, for the first time, that exposure to the lipophilic organochlorine insecticide metabolite, DDE, in the absence of inflammatory stimuli such as LPS exposure or high fat feeding, can cause an increase in the number of cells expressing two murine macrophage surface markers, F4/80 and CD11b, in the stromal vascular fraction (SVF) of adipose tissue of C57Bl/6H male mice. Our data indicate that DDE is capable of perturbing inflammatory mediator production, potentially through a cyclooxygenase-dependent mechanism, indicating a possible mechanism for the metabolic disturbances associated with exposure to DDE.
MATERIALS AND METHODS
Chemicals. Molecular biology grade ethanol and Escherichia coli lipopolysaccharide (LPS) were purchased from Sigma-Aldrich. DDE was purchased from Chem Service, Inc (West Chester, PA). Arachidonic acid (AA), prostaglandin PGE2, PGF2α, [2H4]-8-iso-PGF2a, and N-[2-(cyclohexyloxy)-4-nitrophenyl] methanesulfonamide (NS-398) were from Cayman Chemical (Ann Arbor, MI). Fatty acid free, low-endotoxin bovine serum albumin was from Gemini Biologicals (West Sacramento, CA). Collagenase type IV was purchased from Worthington (Lakewood, NJ). CD45-APC (Clone: 30-F11) and F4/80-PE-Cy7 (Clone: BM8) antibodies and recombinant murine IFN-γ and IL-4 were from Biolegend. CD11b-PE (Clone: M1/70) was purchased from Thermo Scientific. Fixable viability stain eFluor 780 was purchased from eBioscience. Fc Block and Pharm Lyse were purchased from BD Bioscience. EDTA and DNase 1 were purchased from Sigma (St. Louis, MO).
Animals. Male C57BL/6H mice were obtained from Harlan Laboratories at 6 weeks of age. All mice were chow fed and housed under a 12-h light-dark cycle and allowed free access to food and water. The mice were single-housed in an AAALAC-accredited facility under standard conditions, and both husbandry and experimental protocols were approved by the Institutional Animal Care and Use Committee and were consistent with the NIH Guide for the Care and Use of Laboratory Animals.
Macrophage cell culture. Murine macrophage cell line J774A.1 (ATCC® TIB-67™) was purchased from American Type Culture Collection (Manassas, VA). Cells were cultured in growth medium composed of Dulbecco’s Modified Eagle’s Medium with 10% certified fetal bovine serum (Life Technologies, Grand Island, NY) and 100 IU/ml penicillin and 100 µg/ml streptomycin in a humidified incubator at 37°C with 5% CO2 atmosphere in 75-cm2 tissue-culture-treated flasks. Medium was exchanged every 2-3 days. Cells were subcultured at a ratio of 1:4 before reaching approximately 70% confluence.
Inflammatory challenge. J774A.1 macrophage cells were seeded onto 12-well plates, grown to 80% confluence and pretreated for 2 h with ethanol vehicle (0.05% vol/vol), 2.5, 10, or 20 μM DDE, or 10μM NS-398, followed by an inflammatory challenge with LPS (250 ng/ml) in serum-free medium. Cell culture supernatant was collected 4 h after the inflammatory challenge and subsequently analyzed for prostaglandin content by ultra-performance liquid chromatography (UPLC)-electrospray ionization (ESI)-tandem mass spectrometry (MS/MS).
Cell lysate assay. J774A.1 macrophages were grown to 80% confluence in 75-cm2 flasks, then stimulated with 1 µg/ml LPS for 2 h. Cells were scraped in HBSS (Life Technologies) containing protease inhibitors (Thermo) and sonicated on ice to create a single stock homogenate (2 mg/ml protein). Cell lysate (50 µl) was added to 1 ml Tris-HCl (0.05 M) containing 0.05% vol/vol ethanol (vehicle), 2.5, 10, or 20 μM DDE, or 10 µM NS-398 then incubated in a shaking water bath for 15 min at 37°C. Following incubation, 10 µM AA was added to each tube. Samples were vortexed vigorously and incubated for an additional 30 min at 37°C. Tubes were placed on ice then centrifuged at 500 × g at 4°C to pellet cellular debris. Supernatant was transferred to a new glass tube, extracted, and analyzed for prostaglandin production.
Lipid mediator analysis. Prostaglandin levels in cell culture supernatant or from cell-free supernatants were measured by UPLC-ESI-MS/MS. Samples were mixed 1:2 in ethyl acetate containing 0.1% vol/vol acetic acid and 3 µl of 2.5 mM [2H4]-8-iso-PGF2α, centrifuged at 500 × g for 3 min at room temperature (RT), and the resulting organic layer removed and dried under nitrogen. Samples were resuspended in 1:1 vol/vol water:methanol and transferred to a glass vial with a conical insert for analysis. PGE2 and PGF2α were quantified using a Waters Acquity Ultra Performance Liquid Chromatograph coupled to a Thermo Scientific TSQ Quantum Access MAX triple quadrupole mass spectrometer (Masoodi et al., 2006). Chromatography was performed on a Waters BEH C18 2.1 × 50 mm column with water/methanol + 0.1% acetic acid as the mobile phase (Xie et al., 2010). UPLC/ESI-MS/MS analysis of PGE2 and PGF2α by single reaction monitoring was accomplished by monitoring the transitions m/z 351→271 and m/z 353→193, respectively. The internal standard [2H4]-8-iso-PGF2α was monitored by the transition m/z 357→197.
Macrophage polarization. J774A.1 macrophage cells were seeded in 24-well plates and grown to approximately 60% confluence. Cells were treated for 2 h with 2.5 or 10 μM DDE, 10 µM NS-398, or 0.05% ethanol vehicle before the addition of an M1 (20 ng/ml IFN-γ + 100 ng/ml LPS) or M2 (20 ng/ml IL-4) polarization stimulus for an additional 24 h. After polarization, tissue culture medium was collected, centrifuged at 500 × g for 5 min to pellet cells, and the supernatant was frozen at −80°C before analysis for prostaglandin content by ESI-UPLC-MS/MS as described above. Polarized J774A.1 cells were harvested in lysis buffer and RNA was isolated using Qiagen (Valencia, CA) RNeasy Mini Plus kit. Expression of Arg1, Nos2, and Prostaglandin G/H synthase 2 (Ptgs2) was analyzed for each treatment and normalized to β-actin (Actb). The primers used for each of the genes are shown in Table 1.
TABLE 1.
Primer Sequences
| Gene name | Gene symbol | Primer sequence (5′–3′) | Polarization |
|---|---|---|---|
| β-Actin | Actb | F: GTCGAGTCGCGTCCACC | Housekeeping |
| R: GTCATCCATGGCGAACTGGT | |||
| Arginase 1 (Arg1) | Arg1 | F: TTTTAGGGTTACGGCCGGTG | M2 |
| R: CCTCGAGGCTGTCCTTTTGA | |||
| CD206 | CD206 | F: TTGCACTTTGAGGGAAGCG | M2 |
| R: CCTTGCCTGATGCCAGGTTA | |||
| Inducible nitric oxide synthase | Nos2 | F: TGGGTCTTGTTCACTCCACG | M1 |
| R: GGAACATTCTGTGCTGTCCC | |||
| Toll-like receptor 4 | Tlr4 | F: TGGTTGCAGAAAATGCCAGG | M1 |
| R: AGGAACTACCTCTATGCAGGG | |||
| Cyclooxygenase 2 | Ptgs2 | F: GGGCCATGGAGTGGACTTAAA | M1 |
| R: ACTCTGTTGTGCTCCCGAAG |
Flow cytometry analysis. Male C57BL/6H mice were obtained from Harlan Laboratories at 6 weeks of age. After reaching 8 weeks of age, mice were administered either 2 mg/kg DDE or corn oil vehicle by oral gavage for 5 days. Although serum DDE concentrations were not measured in this study, in prior studies with mice in our laboratories, a 2 mg/kg dosing regimen for 5 days led to 839.3 ± 113.2 ng/ml serum (approximately 150 ng/g lipid) 7 days following the 5-day dosing regimen used in the current study. The DDE exposure level employed in this study is below the mean human exposure levels (313.1 ± 459.9 ng/g lipid) based on recent studies in our laboratory (Eden et al., 2014). It should be noted that as DDE is a metabolite, there is no established LD50 for this compound; however, no overt signs of toxicity were observed in our prior studies (Howell III et al., 2014). Animals were sacrificed 12 h after the last dose and adipose tissue was harvested and collagenase digested. The SVF was then stained for analysis by flow cytometry as previously described (Cho et al., 2014). Cells were treated with eFluor 780 fixable viability stain and macrophage/monocyte populations were identified using CD45-APC (Biolegend; 30-F11), CD11b-PE (ThermoScientific; M1/70), and F4/80-PE-Cy7 (Biolegend; BM8). Adipose tissue macrophage content was calculated as previously described by Cho et al. (2014) (%ATM × total SVF/fat pad weight [g]).
qRT-PCR analysis. In flow cytometry experiments, following surface staining, samples were resuspended in sterile, RNase-free fluorescence activated cell sorter (FACS)-PBS containing DNase I. Then, 20 000 CD11b+F4/80+ events were sorted into 500 µl Buffer RLT plus (Qiagen) (Tighe, 2015). After sorting, the final volume was adjusted to bring the total volume of lysis buffer to 350 µl for every 100 µl of FACS sample volume, and 250 µl of 100% ethanol was added for every 450 µl of RLT/FACS mixture. RNA was immediately extracted using a Qiagen RNeasy Mini Plus extraction kit. cDNA was generated using a Maxima First Strand cDNA synthesis kit (Life Technologies) and expression of Arg1, macrophage mannose receptor 1 (Mrc1), Toll-like receptor 4 (Tlr4), and Nos2 was measured by two-step quantitative real-time polymerase chain reaction (RT-qPCR), performed on a Stratagene MX3005p using Taqman-based Luminaris Higreen low ROX quantitative real time (qRT)-PCR reagents. Fold change in gene expression was estimated using the ΔΔCt method and statistical significance was determined as previously described (Livak et al., 2001; Schmittgen et al., 2008).
RESULTS
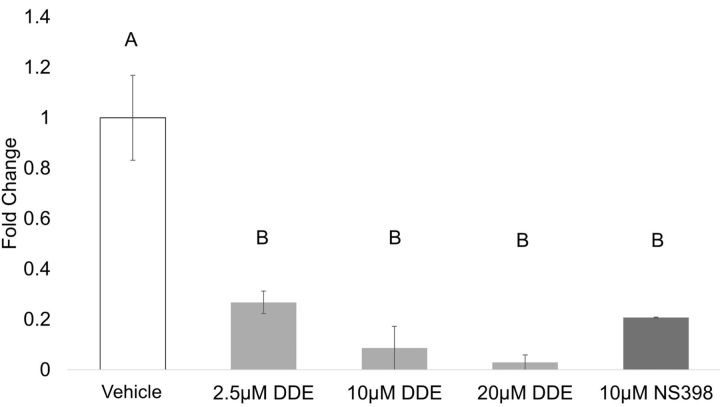
Prostaglandin production from J774A.1 macrophages. Inflammatory substances such as LPS induce phospholipase A2 and COX-2 activity in macrophage cells, resulting in increased production and secretion of lipid mediators, such as PGE2. J774A.1 cells were treated for 2 h with DDE or NS-398 before exposure to LPS (250 ng/ml) for 4 h to stimulate an inflammatory response. Cell culture supernatant was collected and prostaglandin levels were assessed. All DDE concentrations and NS-398 significantly decreased PGE2 compared with vehicle control (Figure 1).There was no significant difference detected between DDE- and NS-398-treated groups. Although PGF2α was detectable in the stimulated vehicle, levels were below the limit of detection for all DDE- and NS-398-treated samples.
FIG. 1.
Prostaglandin production by J774A.1 macrophages. Prostaglandin production from J774A.1 cells was measured by UPLC-ESI-MS/MS, and total area ratios were estimated for each sample. Data are expressed as fold change from vehicle (0.05% EtOH). Statistically significant differences were determined with one-way ANOVA with Duncan’s Studentized range test for multiple comparisons. Data represent the mean ± SEM of three experiments. Treatment groups with the same letter are not significantly different (P < .05). Abbreviations: UPLC, ultra-performance liquid chromatography; MS/MS, tandem mass spectrometry.
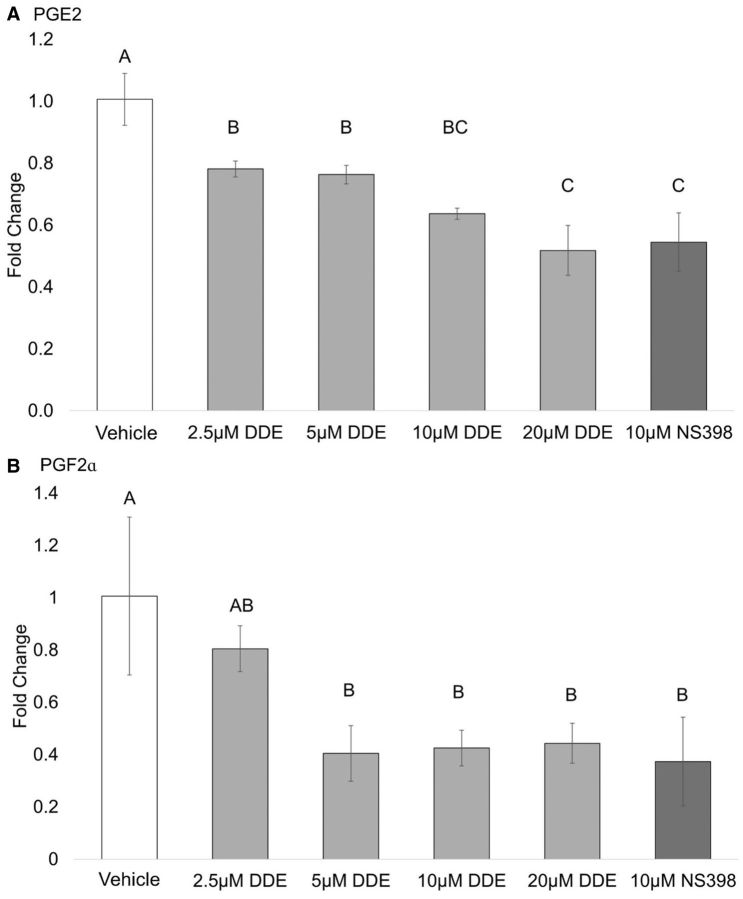
Prostaglandin production in cell lysates. The effect of DDE treatment on COX-2 activity and the production of the prostaglandins PGE2 and PGF2α derived from exogenous AA were investigated in a cell lysate system (Figure 2). J774A.1 macrophages were pretreated with 1 µg/ml LPS for 2 h, lysed and the lysate was incubated with DDE or NS-398 (a specific COX-2 inhibitor). PGE2 and PGF2α concentrations were then determined. DDE treatment reduced the production of PGE2 (Figure 2A) in a concentration-dependent manner with 20 µM DDE treatment resulting in a mean 45% decrease. Similarly, treatment with DDE decreased production of PGF2α in a concentration-dependent manner with a mean maximum decrease of 65% (Figure 2B). NS-398 treatment was also shown to decrease PGE2 and PGF2α production. Thus, DDE treatment appeared to decrease COX-2 activity in cell lysates, as evidenced by the decrease in prostaglandin production.
FIG. 2.
Inhibition of prostaglandin production in cell lysates. Production of (A) PGE2 and (B) PGF2α from exogenous AA was measured in J774A.1 cell lysates by UPLC-ESI-MS/MS and area ratios (analyte/internal standard) were estimated for each sample. Data are expressed as fold change from vehicle. Statistically significant differences were determined with one-way ANOVA with Duncan’s Studentized range test for multiple comparisons. Data represent the mean ± SEM of three experiments. Treatment groups with the same letter are not significantly different (P < .05).
Expression of Nos2 and Arg1 reflect polarization stimulus in J774A.1 cells. In this study, we defined M1 polarization as IFN-γ + LPS activated macrophages, whereas M2 refers to IL-4 activation. Expression of Nos2 and Arg1 is commonly used as markers of murine macrophage polarization and is considered to accurately represent polarization stimulus, an effect that has been established in both primary macrophage cultures and the RAW 264.7 macrophage cell line (Davis et al., 2013; Sica et al., 2012). To ensure that Nos2 and Arg1 expression accurately reflected polarization stimulus in J774A.1 macrophage cells polarized to either the M1 or M2 phenotype, we stimulated these cells with 20 ng/ml IFN-γ and 100 ng/ml LPS or 20 ng/ml IL-4 for M1 and M2, respectively. In this study, it was found that the polarization stimuli did lead to the expected upregulation of the phenotype markers for M1 (Nos2 and Ptgs2) or M2 (Arg1) (Figure 3). In this study, polarization stimulus was found to have no significant effect on expression of the internal control gene, Actb (P < .05) (Schmittgen et al., 2008).
FIG. 3.
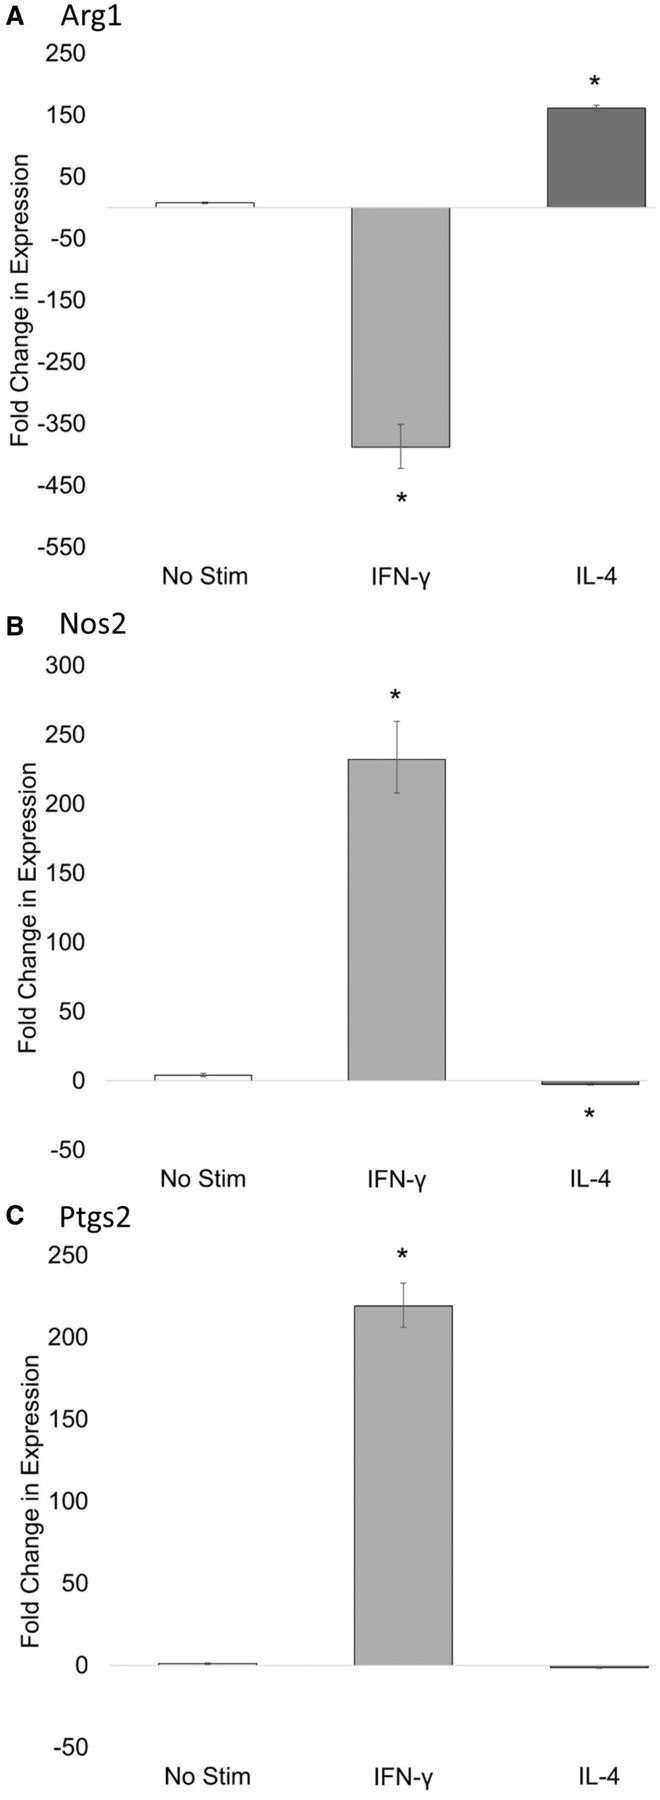
24-h M1/M2 macrophage polarization markers in J774A.1 macrophages. J774A.1 macrophage cells were induced to differentiate to M1 or M2 macrophage phenotype by IFN-γ + LPS or IL-4, respectively. 24 h later, total RNA was isolated and analyzed for (A) Arg1, (B) Nos2, (C) and Ptgs2 expression by RT-qPCR. Asterisks indicate significance at P < .05 versus No Stim, as determined by Student’s t-test. Data represent the mean ± SEM of three experiments.
DDE alters expression of M1 polarization markers. The effects of DDE or a selective COX-2 inhibitor on expression of M1 polarization markers were assessed by RT-qPCR (Figure 4). It was found that 10 µM DDE and NS-398 attenuated the induction of Nos2 (Figure 4A) and Ptgs2 (Figure 4C) caused by IFN-γ + LPS treatment, compared with stimulated cells treated with vehicle (0.05% vol/vol EtOH) control. Additionally, DDE (10 µM) and NS-398 enhanced the reduction in Arg1 (Figure 4B) expression caused by IFN-γ + LPS treatment alone.
FIG. 4.
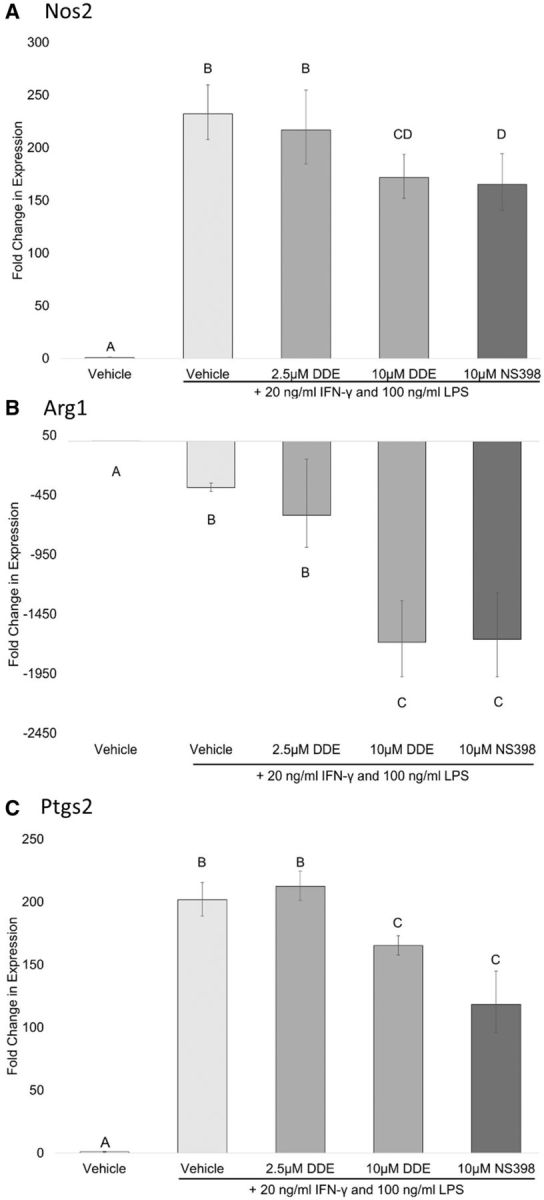
Fold change in M1 polarization markers in J774A.1 cells. J774A.1 macrophage cells were induced to differentiate to M1 macrophage phenotype in the presence of vehicle (0.05% EtOH), 2.5 or 10 µM DDE, 10 µM NS-398. Expression of (A) Arg1, (B) Nos2, and (C) Ptgs2 was measured by RT-qPCR. Statistically significant differences were determined with one-way ANOVA with Duncan’s Studentized range test for multiple comparisons. Data represent the mean ± SEM of three experiments. Treatment groups with the same letter are not significantly different (P < .05).
DDE alters expression of M2 polarization markers in vitro. DDE’s ability to perturb the polarization of macrophages to an M2 phenotype by IL-4 treatment was assessed by gene expression changes measured by qRT-PCR. Our data indicate that COX-2 inhibition alone was unable to suppress expression of M2 polarization markers; rather, selective COX-2 inhibitor NS-398 and DDE (2.5 and 10 µM) significantly increased Arg1 expression as compared with vehicle in cells stimulated with IL-4 (Figure 5B). No treatment effect was shown for the expression of Nos2 in IL-4 stimulated cells (Figure 5A). Additionally, the IL-4 polarization stimulus had no effect of the expression of Ptgs2 (Figure 5C).
FIG. 5.
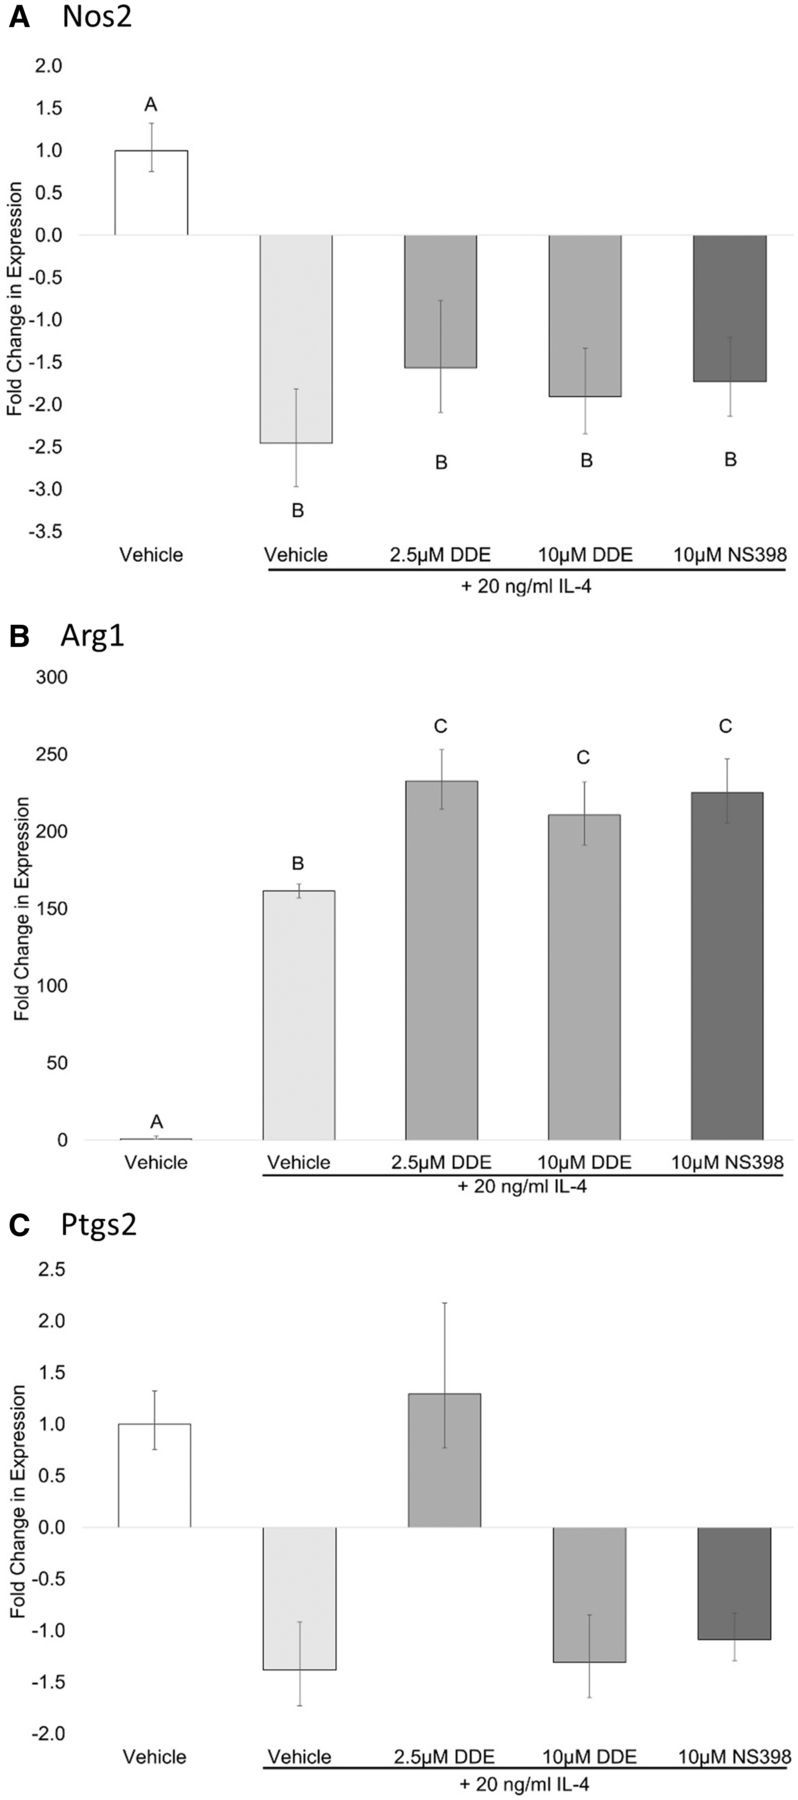
Fold Change in mRNA expression in J774A.1 cells stimulated with IL-4. J774A.1 macrophage cells were grown to 80% confluence and induced to differentiate to M2 macrophage phenotype using 20 ng/ml IL-4 in the presence of vehicle (0.05% EtOH), 2.5 or 10 µM DDE, 10 µM NS-398. 24 h later, total RNA was isolated and analyzed for (A) Arg1, (B) Nos2, and (C) Ptgs2 by RT-qPCR. Comparisons were made between stimulated cells and unstimulated control. Statistically significant differences were determined with one-way ANOVA with Duncan’s Studentized range test for multiple comparisons. Data represent the mean ± SEM of three experiments. Treatment groups with the same letter are not significantly different (P < .05).
DDE treatment decreased PGE2 secretion independently of Ptgs2 expression. Data from in vitro experiments indicated that DDE could decrease prostaglandin production, as determined by attenuated PGE2 secretion following stimulation with LPS. The finding that DDE could decrease prostaglandin production in a cell lysate system containing exogenous AA was further evidence of DDE’s potential to interfere with overall cyclooxygenase activity. However, expression data showed that DDE (10 µM) or NS-398 could decrease the expression of Ptgs2 following 24 h of LPS + IFN-γ stimulus. To determine whether an attenuation of Ptgs2 expression was responsible for the decrease observed in J774A.1 cells stimulated with LPS, prostaglandin content from tissue culture supernatant from IL-4 and LPS + IFN-γ stimulated cells was analyzed. It was found that, regardless of polarization stimulus or Ptgs2 expression, PGE2 release into the medium was attenuated by DDE (2.5 and 10 µM) compared with vehicle (Figure 6).
FIG. 6.
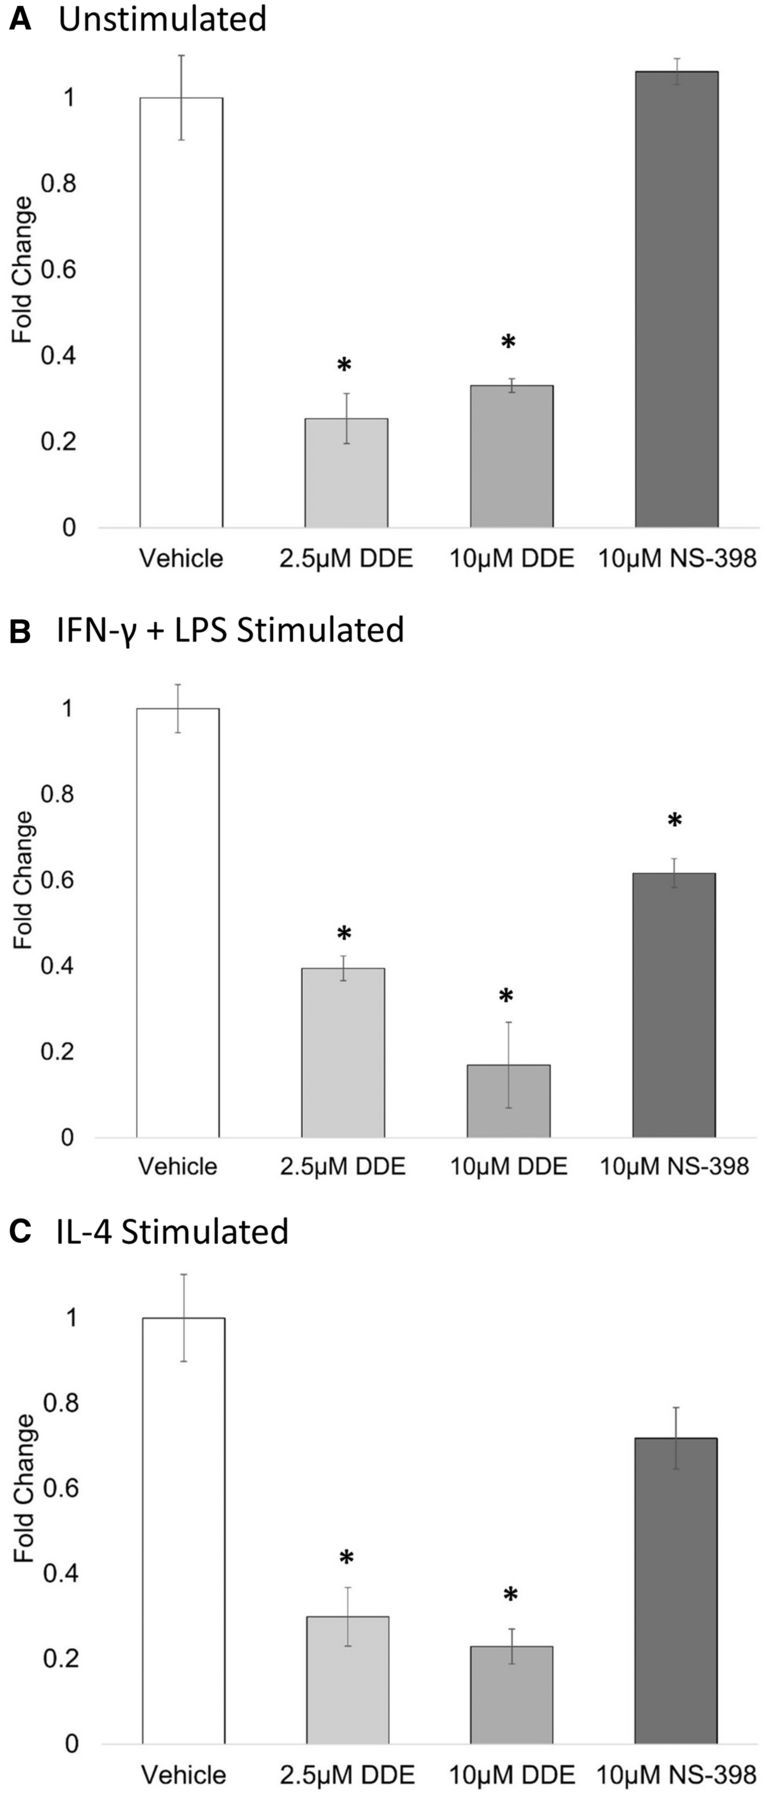
Prostaglandin production following polarization stimulus. J774A.1 macrophage cells were induced to differentiate to M1 or M2 macrophage phenotype by IFN-γ + LPS or IL-4, respectively, in the presence of vehicle (0.05% EtOH), 2.5 or 10 µM DDE, 10 µM NS-398. 24 h later, prostaglandin production was measured by UPLC-ESI-MS/MS, and total area ratios were estimated for (A) unstimulated, (B) IFN-γ + LPS, or (C) IL-4 stimulated each sample. Data are expressed as fold change from vehicle (0.05% EtOH). Asterisks indicate significance at P < .05 versus vehicle, as determined by Student’s t-test. Data represent the mean ± SEM of two experiments.
F4/80+CD11b+ monocyte/macrophage infiltration into adipose tissue. To analyze the effect of DDE on F4/80+ CD11b+ cell numbers in adipose tissue, C57BL/6H mice were fed a regular chow diet and exposed to 2 mg/kg DDE or corn oil vehicle by oral gavage daily for 5 days to represent a subchronic exposure paradigm using the most likely human route of exposure.
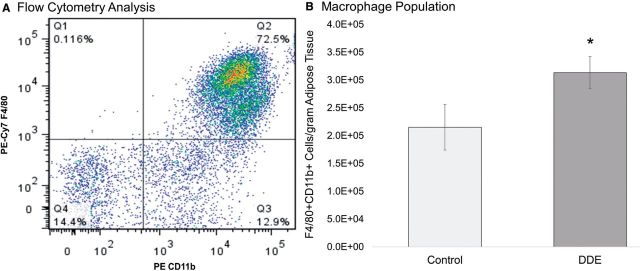
Mice were sacrificed 12 h after the last dose and adipose tissue was collected and digested for FACS analysis of the macrophage population of the SVF. The SVF of mice exposed to DDE revealed a significant increase (α = .05) in the number of F4/80+ CD11b+ cells in the epididymal adipose tissue by approximately 37% (Figure 7). Interestingly, mice exposed to DDE for 5 days gained an average of 2.6 g compared with 0.9 g gained by corn oil vehicle fed animals, but this increase was not significant (P < .05). There was no significant difference in total fat pad weights between the groups. Furthermore, the total number of cells isolated from the SVF of DDE exposed mice was increased by approximately 26%, but this was also not significant (data not shown). Finally, F4/80+ CD11b+ cells were sorted into lysis plus buffer for RNA isolation and subsequent analysis by RT-qPCR. Gene expression analysis of known markers of macrophage polarization revealed no significant differences between the expression of Arg1, Mrc1, or Tlr4, whereas, Nos2 expression could not be detected in any of the samples.
FIG. 7.
Analysis of F4/80+CD11b+ population by FACS. C57Bl/6H mice were exposed to 2 mg/kg DDE or corn oil vehicle. The SVF from the epidydimal adipose tissue was collected and analyzed by multicolor flow cytometry. A, A representative example of macrophage population analysis by FACS. In total, 50 000 cells were gated on CD11b (PE-Cy7) and F4/80 (PE) is shown. The percentage of CD11b and F4/80 positive cells was quantified for each animal and normalized to adipose tissue weight in grams. B, Adipose tissue from DDE exposed animals contained approximately 37% more cells/g fat than control mice. This was significant as determined by Student’s t-test (P < .05).
DISCUSSION
Metabolic syndrome and T2D are diseases of metabolic and inflammatory dysfunction and are suspected to be, in part, driven by perturbed macrophage activity in obese adipose tissue (Fuentes et al., 2013; Murray et al., 2011). Inflammation, particularly the chronic, low-grade metabolic inflammation present in obesity and insulin resistance, is complex and not well understood. The present study indicates that DDE exposure perturbs macrophage reactivity to inflammatory and polarization stimuli, and may enhance macrophage accumulation in adipose tissue depots.
Inflammation and the resolution thereof require feedback mechanisms between both immune cells and local tissues involving cytokine and lipid mediator pathways to properly eliminate an inflammatory insult without causing overt damage to the self. The role of inflammatory lipid mediators, like prostaglandins, in adipogenesis and adipose tissue inflammation in vivo is not well defined. However, recent observations indicate that PGE2 signaling through the EP4 receptor may limit adipose tissue inflammation in vivo (Tang et al., 2015). The data presented in this study suggest that DDE can inhibit the production of prostaglandins, particularly PGE2 and PGF2α, by J774A.1 cells, evidence that was supported by similar findings in the human monocytic cell line, THP-1, and in RAW 264.7 murine macrophages (Supplementary Data and Supplementary Data).
Though widely used, the M1 and M2 terminologies are not all-encompassing and fail to fully describe the range of activation states that favor either inflammation or resolution of inflammation. Utilization of arginine by NOS2 or Arg-1 is often used to classify macrophages as M1 or M2, respectively. Arg-1 and NOS2 compete for the same substrate, l-arginine, to produce ornithine and NO, respectively. A shift in arginine usage can control the direction of inflammation as the expression of Nos2 is under the control of arginine availability, and arginase diverts arginine away from the NO pathway. NO is microbicidal and limits infection, but prolonged or enhanced production can lead to tissue damage and chronic inflammation whereas depletion of arginine by arginase limits the expression of Nos2 and the subsequent production of NO, favoring a less destructive and anti-inflammatory microenvironment. Expression of Nos2 and Ptgs2 has been shown to be coregulated and, interestingly, NO has been demonstrated to inhibit COX-2 activity through nitration of Tyr385 (Simmons et al., 2004). Interpreting the effects of DDE on development of macrophages with M1 and M2 phenotypes is not as straightforward as it may seem. It is worth first considering the results that would be expected from an agent that strictly suppresses M1 and enhances M2 macrophage maturation. Such an agent would presumably suppress the increase in expression of M1 markers induced by an M1 stimulus and it would magnify any decrease in M2 markers induced by an M1 stimulus. This pattern of results was noted in Figure 4. In response to an M2 stimulus, an agent that suppresses M1 maturation and enhances M2 maturation would presumably increase expression of M2 markers and magnify any decreases in M1 markers. The results shown in Figure 5 do not precisely conform to this pattern. Although DDE significantly increased the expression of the M2 marker Arg1 in response to the M2 stimulus IL-4, DDE did not significantly magnify the reduction of M1 marker expression in response to IL-4. Thus, DDE should not be characterized on the basis of the results reported here as a “pure” inhibitor of M1 macrophage maturation and enhancer of M2 maturation. However, DDE did significantly increase M2 marker expression induced by an M2 stimulus and significantly decreased M1 marker expression induced by an M1 stimulus. Future experiments are needed to determine whether macrophage functional changes correspond to this pattern suggesting a tendency toward increased M2 maturation and decreased M1 maturation. These findings indicate that DDE treatment may impair the complete polarization of macrophages toward the extreme ends of the polarization spectrum and may instead induce gene expression that favors an overall M2-like phenotype.
Data have shown that COX-2 is potentially a key enzyme in the polarization process (Na et al., 2013). However, the finding that DDE (2.5 and 10 µM) attenuated PGE2 release independently of Ptgs2 expression suggests that the perturbation seen in this study is not mediated by suppression of Ptgs2. It should be noted that, although COX-2 is predominantly responsible for the production of PGE2 and its activity was the focus of this study, COX-1 expression was not assessed in this study and its contribution to a reduction in PGE2 release cannot be discounted.
There is a documented and rapid change in the composition of adipose tissue SVF in response to high fat feeding. Whether this initial change is an early compensatory mechanism meant to orchestrate proper growth and maintain healthy adipose tissue (Wernstedt et al., 2014) or a response that is pathological in nature is subject to debate (Fuentes et al., 2013). The progression toward a predominantly M1 phenotype can be caused by adipocyte hypertrophy, as occurs during chronic high fat feeding, and the development of a cellular milieu consisting of high concentrations of free fatty acids, reactive oxygen species, and inflammatory cytokines. At present, it is unknown whether proliferation of resident macrophages or infiltration of monocytes accounts for the source of the massive expansion of the adipose tissue macrophage population. Furthermore, the roles of both populations have not yet been elucidated (Dey et al., 2015; Hill et al., 2014). We observed an increase in the number of macrophage cells/gram of adipose tissue in DDE exposed mice, though it is unknown whether this is the result of recruitment from circulation or whether the increased numbers are the product of resident adipose tissue macrophage proliferation in response to DDE exposure. Furthermore, DDE did not induce a change in vivo in the expression of macrophage polarization markers in F4/80+CD11b+ cells isolated from adipose tissue by FACS, with expression profiles for both treated and control animals favoring that of a resting M2 phenotype. This is not entirely unexpected, as in the absence of high-fat feeding, there is little stimulus for polarization other than the DDE itself and preliminary data (unpublished from our lab) indicate that DDE exposure alone has no effect on the expression of either Arg1 or Nos2 in unstimulated J774A.1 cells. This is in agreement with the finding that, at the onset of weight gain during high fat feeding, the vast majority of macrophages in the adipose tissues exhibit an M2, Arg1 expressing phenotype.
M2 macrophages suppress inflammation, due in part to the dominance of the arginase-ornithine pathway; however, ornithine is a precursor amino acid for proline, a necessary component in the production of collagen. In obesity, the number of macrophages in adipose tissue increases and although M1 macrophages tend to aggregate in crown-like structures around necrotic adipocytes, especially in obese adipose, M2 macrophages are found throughout adipose tissue and, as a recent study of obese human adipose tissue found, may be the predominant phenotype in insulin resistant adipose tissue (Fjeldborg et al., 2014). It has been found that the M2 adipose macrophages are associated with areas of adipose tissue fibrosis, which is associated with insulin-resistant adipose tissue (Spencer et al., 2010). It is possible that M2 macrophages contribute to the development of adipose fibrosis by favoring the production of collagen from ornithine. As such, an increase in the number of adipose tissue macrophages, even M2 macrophages, may favor a scenario that would result in adipose tissue insulin resistance.
Macrophages in vivo are exposed to an array of cellular signals and we are only just beginning to understand the complexity of signaling cascades that can differentially drive macrophage polarization as well as the potential plasticity of resident tissue macrophage populations. Adipocytes are a large source of adipokines, like leptin and adiponectin, and chemokines that can influence macrophage polarization. Adipose tissue presents a complex and incompletely characterized microenvironment. This system is complex on its own, and it is currently unknown what kind of influence a compound like DDE can have on adipose tissue homeostasis. The results of this study indicate that DDE can influence the responsiveness of macrophage cells in vitro and induce an increase in the number of cells expressing macrophage surface markers in adipose tissue of C57Bl/6H mice. Any compound that can influence the activity or function of the immune system could contribute to dysfunction both locally and systemically. By augmenting PG synthesis, macrophage polarization, and immune cell infiltration to or proliferation in adipose tissue, DDE may contribute to immune system dysfunction, such as that seen in metabolic syndrome or insulin resistance. T2D and MS are characterized by a state of chronic low-grade inflammation, particularly in adipose tissue. Immunomodulation of adipose microenvironment by DDE may contribute to an “obese phenotype” that predisposes an individual to developing metabolic disease.
FUNDING
Center for Environmental Health Sciences; Department of Basic Sciences at Mississippi State University; National Institute of General Medical Sciences and the IDeA Program (P20GM103646 to S.B.P.).
Supplementary Material
ACKNOWLEDGMENT
The authors thank Dr Lee Mangum for his assistance with the UPLC-MS prostaglandin analysis. They declare no conflict of interest.
SUPPLEMENTARY DATA
Supplementary data are available online at Supplementary Data.
REFERENCES
- Alegria-Torres J. A., Diaz-Barriga F., Gandolfi A. J., Perez-Maldonado I. N. (2009). Mechanisms of p,p′-DDE-induced apoptosis in human peripheral blood mononuclear cells. Toxicol. In Vitro 23, 1000–1006. [DOI] [PubMed] [Google Scholar]
- Cho K. W., Morris D. L., Lumeng C. N. (2014). Chapter sixteen—Flow cytometry analyses of adipose tissue macrophages. In Methods in Enzymology (Ormond A. M., Ed.), Vol. 537, pp. 297–314. Academic Press: San Diego, CA. [DOI] [PMC free article] [PubMed] [Google Scholar]
- Davis M. J., Tsang T. M., Qiu Y., Dayrit J. K., Freij J. B., Huffnagle G. B., Olszewski M. A. (2013). Macrophage M1/M2 polarization dynamically adapts to changes in cytokine microenvironments in Cryptococcus neoformans infection. MBio 4, e00264–13. [DOI] [PMC free article] [PubMed] [Google Scholar]
- Dey A., Allen J., Hankey-Giblin P. A. (2015). Ontogeny and polarization of macrophages in inflammation: Blood monocytes versus tissue macrophages. Front. Immunol. 5, 683. [DOI] [PMC free article] [PubMed] [Google Scholar]
- Eden P.R., Meek E.C., Wills R.W., Olsen E.V., Crow J.A., Chambers J.E. (2014). Association of type 2 diabetes mellitus with plasma organochlorine compound concentrations. J. Expo. Sci. Environ. Epidemiol. Forthcoming. doi: 10.1038/jes.2014.69. [DOI] [PubMed] [Google Scholar]
- Fjeldborg K., Pedersen S. B., Møller H. J., Christiansen T., Bennetzen M., Richelsen B. (2014). Human adipose tissue macrophages are enhanced but changed to an anti-inflammatory profile in obesity. J. Immunol. Res. 2014, 309548. [DOI] [PMC free article] [PubMed] [Google Scholar]
- Fuentes E., Fuentes F., Vilahur G., Badimon L., Palomo I. (2013). Mechanisms of chronic state of inflammation as mediators that link obese adipose tissue and metabolic syndrome. Mediators Inflamm. 2013, 136584. [DOI] [PMC free article] [PubMed] [Google Scholar]
- Hill A. A., Reid Bolus W., Hasty A. H. (2014). A decade of progress in adipose tissue macrophage biology. Immunol. Rev. 262, 134–152. [DOI] [PMC free article] [PubMed] [Google Scholar]
- Howell G. E., III, Meek E., Kilic J., Mohns M., Mulligan C., Chambers J. E. (2014). Exposure to p,p′-dichlorodiphenyldichloroethylene (DDE) induces fasting hyperglycemia without insulin resistance in male C57BL/6H mice. Toxicology 320, 6–14. [DOI] [PMC free article] [PubMed] [Google Scholar]
- Ibrahim M. M., Fjaere E., Lock E. J., Naville D., Amlund H., Meugnier E., Le Magueresse Battistoni B., Froyland L., Madsen L., Jessen N., et al. (2011). Chronic consumption of farmed salmon containing persistent organic pollutants causes insulin resistance and obesity in mice. PLoS One 6, e25170. [DOI] [PMC free article] [PubMed] [Google Scholar]
- Kalinski P. (2012). Regulation of immune responses by prostaglandin E2. J. Immunol. 188, 21–28. [DOI] [PMC free article] [PubMed] [Google Scholar]
- Lee D.-H., Steffes M. W., Sjödin A., Jones R. S., Needham L. L., Jacobs D. R. Jr.(2011). Low dose organochlorine pesticides and polychlorinated biphenyls predict obesity, dyslipidemia, and insulin resistance among people free of diabetes. PLoS One 6, e15977. [DOI] [PMC free article] [PubMed] [Google Scholar]
- Lim J. S., Son H. K., Park S. K., Jacobs D. R. Jr., Lee D. H. (2010). Inverse associations between long-term weight change and serum concentrations of persistent organic pollutants. Int. J. Obes. 35, 744–777. [DOI] [PubMed] [Google Scholar]
- Livak K. J., Schmittgen T. D. (2001). Analysis of relative gene expression data using real-time quantitative PCR and the 2− ΔΔCT method. Methods 25, 402–408. [DOI] [PubMed] [Google Scholar]
- López-Carrillo L., Torres-Sánchez L., López-Cervantes M., Blair A., Cebrián M. E., Uribe M. (1999). The adipose tissue to serum dichlorodiphenyldichloroethane (DDE) ratio: Some methodological considerations. Environ. Res. 81, 142–145. [DOI] [PubMed] [Google Scholar]
- Lundholm C., Bartonek M. (1991). A study of the effects of p, p′-DDE and other related chlorinated hydrocarbons on inhibition of platelet aggregation. Arch. Toxicol. 65, 570–574. [DOI] [PubMed] [Google Scholar]
- Masoodi M., Nicolaou A. (2006). Lipidomic analysis of twenty-seven prostanoids and isoprostanes by liquid chromatography/electrospray tandem mass spectrometry. Rapid Commun. Mass Spectrom. 20, 3023–3029. [DOI] [PMC free article] [PubMed] [Google Scholar]
- Murray P. J., Wynn T. A. (2011). Protective and pathogenic functions of macrophage subsets. Nat. Rev. Immunol. 11, 723–737. [DOI] [PMC free article] [PubMed] [Google Scholar]
- Na Y.-R., Yoon Y.-N., Son D.-I., Seok S.H. (2013). Cyclooxygenase-2 inhibition blocks M2 macrophage differentiation and suppresses metastasis in murine breast cancer model. PLoS One 8, e63451. [DOI] [PMC free article] [PubMed] [Google Scholar]
- Schmittgen T. D., Livak K. J. (2008). Analyzing real-time PCR data by the comparative CT method. Nat. Protoc. 3, 1101–1108. [DOI] [PubMed] [Google Scholar]
- Shimada Y., Tomita M., Yoshida T., Fukuyama T., Katoh Y., Ohnuma-Koyama A., Takahashi N., Soma K., Kojima S., Ohtsuka R., et al. (2015). Inhibition of lipopolysaccharide-induced liver injury in rats treated with a hepatic drug-metabolizing enzyme inducer p,p′-DDT. Exp. Toxicol. Pathol. 67, 245–251. [DOI] [PubMed] [Google Scholar]
- Sica A., Mantovani A. (2012). Macrophage plasticity and polarization: In vivo veritas. J. Clin. Invest. 122, 787–795. [DOI] [PMC free article] [PubMed] [Google Scholar]
- Simmons D. L., Botting R. M., Hla T. (2004). Cyclooxygenase isozymes: The biology of prostaglandin synthesis and inhibition. Pharmacol. Rev. 56, 387–437. [DOI] [PubMed] [Google Scholar]
- Spencer M., Yao-Borengasser A., Unal R., Rasouli N., Gurley C. M., Zhu B., Peterson C. A., Kern P. A. (2010). Adipose tissue macrophages in insulin-resistant subjects are associated with collagen VI and fibrosis and demonstrate alternative activation. Am. J. Physiol. Endocrinol. Metab. 299, E1016–E1027. [DOI] [PMC free article] [PubMed] [Google Scholar]
- Tang E. H. C., Cai Y., Wong C. K., Rocha V. Z., Sukhova G. K., Shimizu K., Xuan G., Vanhoutte P. M., Libby P., Xu A. (2015). Activation of prostaglandin E2-EP4 signaling reduces chemokine production in adipose tissue. J. Lipid Res. 56, 358–368. [DOI] [PMC free article] [PubMed] [Google Scholar]
- Tighe S. (2015). UVM Cancer Center Flow Cytometry Facility. Available at: http://www.uvm.edu/medicine/vtcancercenter/?Page=facilities_flowcytometry.html&SM=facilitiessubmenu.html. Univ. of Vermont, Cancer Center, Burlington, VT. Accessed July 13, 2014. [Google Scholar]
- Wernstedt Asterholm I., Tao C., Morley T. S., Wang Q. A., Delgado-Lopez F., Wang Z. V., Scherer P. E. (2014). Adipocyte inflammation is essential for healthy adipose tissue expansion and remodeling. Cell Metab. 20, 103–118. [DOI] [PMC free article] [PubMed] [Google Scholar]
- Wrobel M. H., Mlynarczuk J., Kotwica J. (2012). The effect of DDT and its metabolite (DDE) on prostaglandin secretion from epithelial cells and on contractions of the smooth muscle of the bovine oviduct in vitro. Toxicol. Appl. Pharmacol. 259, 152–159. [DOI] [PubMed] [Google Scholar]
- Xie S., Borazjani A., Hatfield M. J., Edwards C. C., Potter P. M., Ross M. K. (2010). Inactivation of lipid glyceryl ester metabolism in human THP1 monocytes/macrophages by activated organophosphorus insecticides: Role of carboxylesterases 1 and 2. Chem. Res. Toxicol. 23, 1890–1904. [DOI] [PMC free article] [PubMed] [Google Scholar]
Associated Data
This section collects any data citations, data availability statements, or supplementary materials included in this article.


