

Abstract
Increasing non‐shivering thermogenesis (NST), which expends calories as heat rather than storing them as fat, is championed as an effective way to combat obesity and metabolic disease. Innate mechanisms constraining the capacity for NST present a fundamental limitation to this approach, yet are not well understood. Here, we provide evidence that Regulator of Calcineurin 1 (RCAN1), a feedback inhibitor of the calcium‐activated protein phosphatase calcineurin (CN), acts to suppress two distinctly different mechanisms of non‐shivering thermogenesis (NST): one involving the activation of UCP1 expression in white adipose tissue, the other mediated by sarcolipin (SLN) in skeletal muscle. UCP1 generates heat at the expense of reducing ATP production, whereas SLN increases ATP consumption to generate heat. Gene expression profiles demonstrate a high correlation between Rcan1 expression and metabolic syndrome. On an evolutionary timescale, in the context of limited food resources, systemic suppression of prolonged NST by RCAN1 might have been beneficial; however, in the face of caloric abundance, RCAN1‐mediated suppression of these adaptive avenues of energy expenditure may now contribute to the growing epidemic of obesity.
Keywords: adaptive thermogenesis, Down syndrome, obesity, RCAN1, sarcolipin
Subject Categories: Metabolism
Introduction
Regulation of whole‐body metabolism requires the integration of multiple organ systems that must respond appropriately to a diversity of internal and external stimuli. Disruption of this homeostatic balance underlies the growing epidemic in obesity, metabolic disease, and associated comorbidities. Enhancing innate thermogenic mechanisms that increase energy expenditure by dissipating it as heat has been championed as a promising approach for reducing storage of excess calories as fat. However, the body possesses multiple feedback mechanisms that on the whole work toward maintaining body weight 1. Some thermogenic processes are constitutive in nature, contributing to an increase in resting energy expenditure (REE), while others are responsive, increasing energy expenditure only when activated. Heat generated by skeletal muscle, in animals at rest, is constitutive, whereas cold activation of the mitochondrial uncoupling protein 1 (UCP1) in brown adipose tissue (BAT) is an acute response. In cold‐induced thermogenesis, increased adrenergic activity promotes lipolysis, releasing free fatty acids (FFA) that in turn activate UCP1 to release membrane potential as heat rather than ATP production. UCP1 is most abundant in BAT, but under certain conditions, UCP1‐positive (UCP1+) adipocytes appear in white adipose tissues (WAT) and have been termed “beige” or “brite” for brown‐in‐white adipocytes 2. Prolonged cold exposure, β‐adrenergic stimulation, or a high caloric diet can each increase “beiging” of WAT and primarily occurs in inguinal, subcutaneous WAT (sWAT) rather than in visceral WAT. Thus, adrenergic stimulation causes both an immediate adaptive thermogenic response by activating UCP1 and a long‐term adaptive response by increasing UCP1 protein levels.
Although skeletal muscle in animals at rest has a relatively low metabolic rate, it comprises such a large percentage of body mass that in mammals it contributes 20–30% of REE 3. Sarcolipin (SLN) is a muscle‐specific, sarcoplasmic reticulum (SR)‐associated protein that when present increases heat production by uncoupling ATP hydrolysis from Ca2+ transport by SERCA, the SR Ca2+‐ATPase, thereby increasing ATP consumption at rest 4. SLN is found in both skeletal muscle and heart. Mice lacking SLN are predisposed to diet‐induced obesity, whereas skeletal muscle‐specific overexpression provides protection 5, 6, 7. Although mice lacking either Ucp1 or Sln individually are able to survive acute cold exposure, loss of both genes severely compromises survival 8. Thus, both UCP1 in adipose tissue and SLN in skeletal muscle are required for optimal thermogenesis under acute cold stress, although the molecular mechanisms used for thermogenesis by each are quite different; UCP1 reduces ATP production, whereas SLN increases ATP hydrolysis. The mechanisms providing coordination between these two systems are not fully understood. Here, we provide evidence that the gene, Regulator of Calcineurin 1 (Rcan1), exerts suppressive control over both mechanisms of thermogenesis, thereby contributing to systemic regulation of energy expenditure.
Rcan1 (also known as Dscr1/Mcip1) is an endogenous inhibitor of the calcium‐activated protein phosphatase, calcineurin 9, 10. Organ transplant patients receiving calcineurin inhibitors for immunosuppression are at increased risk for weight gain and new‐onset diabetes 11, 12. In human genomewide association studies (GWAS), the PPP3CA locus, which encodes a catalytic subunit of calcineurin, is associated with both body mass index (BMI) and serum insulin levels 13. Thus, both clinical and genetic data implicate calcineurin in metabolic regulation, although the underlying mechanisms are not known.
Calcineurin has many substrates including the transcription factor NFAT. A number of genes central to metabolic regulation have been identified as potential calcineurin/NFAT targets, including insulin, Irs2, and resistin 14, 15, 16. Mice deficient for both Nfatc2 and Nfatc4 are resistant to diet‐induced obesity 14. In humans, polymorphisms in the NFATc4 locus are associated with an increased risk for new‐onset diabetes following organ transplant 17 and human GWAS studies show association of the NFATc1, NFATc2, and NFATc3 loci with a variety of metabolic traits 13. Calcineurin can also influence gene expression by activating cAMP response element binding protein (CREB)‐regulated transcription co‐activators (CRTCs). The CREB/CRTC axis is central to metabolic responses in a variety of tissues 18. CRTC1 polymorphisms influence BMI and fat mass in the general adult population 19, and a CRTC2 polymorphism was identified as a risk factor for metabolic syndrome in transplant patients 20. CRTC3 variants are associated with adiposity 21 and cholesterol levels in adults 22. Taken as a whole, the range of genetic and phenotypic associations not only supports a model in which calcineurin‐dependent transcription impacts body metabolism, but also suggests that multiple transcriptional mechanisms may be involved.
Rcan1 is the best understood of the three mammalian Rcan genes 23 and generates two protein isoforms 24. Both the RCAN1.1 and RCAN1.4 isoforms are potent calcineurin inhibitors; however, Rcan1.4 expression is under the control of calcineurin/NFAT and thus forms an inhibitory feedback loop 25. We previously showed that high glucose increases Rcan1.1 transcription in pancreatic β‐cells 26 and linked this to mitochondrial dysfunction and hypoinsulinemia in humans with T2D 27. However, pancreatic function and growth appear to be normal in mice with the disruption of the gene encoding Rcan1 (Rcan1‐KO). Protein levels of both RCAN1 isoforms are high in a number of metabolically active tissues, including skeletal muscle, heart, and brain. Although there are currently no gene association studies in humans linking RCAN1 to metabolic disorders, SNPs at the locus show a strong linkage to climate adaptation 28 and QTL studies in cattle show strong association between Rcan1 and multiple adipose tissue traits 29, suggesting that Rcan1 may have an as‐yet‐undefined role in mammalian adipocyte biology.
The RCAN1 gene is located on human chromosome 21 and has been proposed as a key contributor to many of the phenotypes observed in individuals with Down syndrome (DS) 30. Body weight regulation is a lifelong challenge in this population, which is also at greater risk for both type 1 and type 2 diabetes compared to weight‐ and age‐matched peers 31. We recently showed that mouse models of DS that were trisomic for the region containing the Rcan1 locus are hyperglycemic, whereas those lacking this region are not 27, suggesting that one or more of the genes in this region are important to metabolism and glucose regulation. Here, we undertook a series of studies to better understand the role of RCAN1 in metabolic regulation. We show that Rcan1‐KO mice are resistant to high‐fat diet (HFD)‐induced obesity because of an increase in whole‐body metabolic rate when compared to wild‐type (WT) controls. The mechanisms underlying the lean phenotype are multifaceted and include both increased expression of Ucp1 in sWAT and increased expression of Sln in skeletal muscle. Our findings suggest that Rcan1 helps to limit energy expenditure by acting directly as a brake on each of these adaptive, thermogenic processes. On an evolutionary timescale, in the context of limited food resources, these functions would be beneficial; however, in the face of current caloric abundance, Rcan1‐mediated suppression of these adaptive avenues of energy expenditure may contribute to the growing epidemic in obesity.
Results
Mice deficient for Rcan1 are resistant to diet‐induced obesity
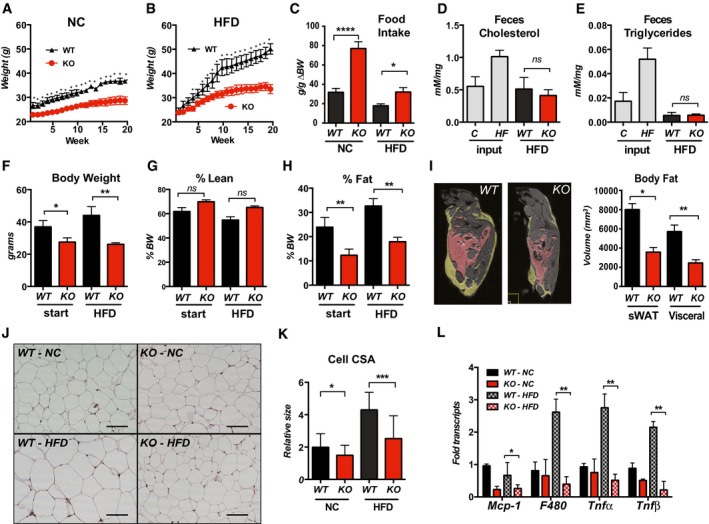
WT and Rcan1‐KO mice were placed on a high‐fat diet (HFD: 60% calories from fat) or maintained on normal rodent chow (NC) for 25 weeks. WT mice gained significantly more weight than the Rcan1‐KO mice on either food source (Fig 1A and B). The difference in weight gain was not due to reduced food intake, as the calories consumed by the KO per gram of increase in body weight was greater than that of WT on either diet (Figs 1C and EV1A). The amount of cholesterol and triglyceride remaining in the feces of KO and WT animals on the HFD were similar (Fig 1D and E); thus, the lean phenotype of the Rcan1‐KO mice was not due to a defect in the ability to absorb dietary fat.
Figure 1. Rcan1‐KO mice are resistant to diet‐induced obesity.
-
A, BBody weights of WT and Rcan1‐KO mice fed normal chow diet (NC) or a high‐fat diet (HFD) for 20 weeks starting at 8–10 weeks of age (male, n = 15 each).
-
CFood consumption per gram of body weight gained (g/g ∆BW) over the first 15 weeks on NC or HFD, starting at 8 weeks of age (male, n = 9 each).
-
D, ECholesterol and triglyceride remaining in the feces of WT and Rcan1‐KO mice fed a HFD, measured as mMol per mg of feces (males, n = 4 over 3 days). Cholesterol and triglyceride contents of NC and the HFD chow (input) were measured for comparison.
-
F–IMRI measures of total body weight, percentage lean mass, and percent fat mass prior to and after 6 weeks on the HFD (males, n = 5). MRI image of WT and KO males following 8 weeks on a HFD. Yellow delineates visceral WAT. Pink delineates subcutaneous WAT. Quantification graphed on the right.
-
JRepresentative H&E staining of gWAT from WT and KO males after 25 weeks on NC or HFD. Scale bar = 100 μm.
-
KQuantification of cross‐sectional area (CSA) of adipocytes in (J) (n = 3 animals, three images/each, 75–100 adipocytes). Scale bar = 100 μm.
-
LTranscript levels for inflammatory markers monocyte chemoattractant protein‐1 (Mcp‐1), macrophage antigen F4/80 (F480), tumor necrosis factor‐alpha (Tnfα), and tumor necrosis factor‐beta (Tnfβ) in gWAT of WT and KO after 25 weeks on NC or HFD (males, n = 4–5). Transcript levels were normalized to 18S.
Figure EV1. Rcan1‐KO mice are resistant to diet‐induced obesity.
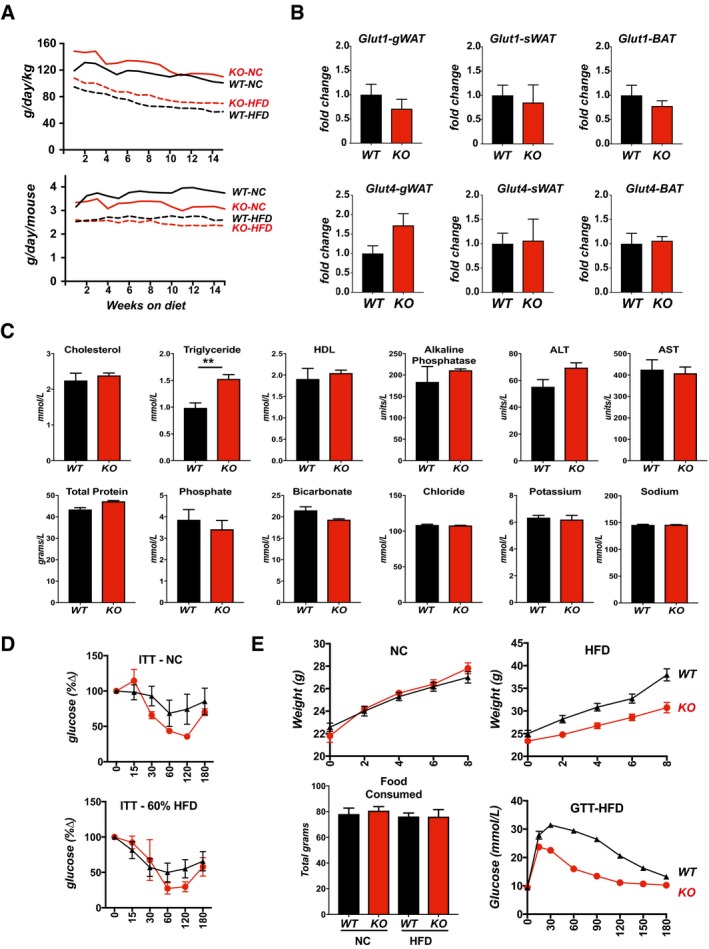
- Food consumption of animals in Fig 1C, calculated and tracked weekly over the first 15 weeks on NC or a 60% fat HFD, starting at 8 weeks of age (male, n = 9 each). Data are presented as grams consumed per day per kilogram body weight (g/day/kg) and grams consumed per day per mouse (g/day/mouse).
- Transcript levels for Glut1 and Glut4 in gWAT, sWAT, and BAT of WT and KO males after 8 weeks on a 60% fat HFD. Transcript levels were normalized to 18S.
- Assessment of standard blood parameters in fasted, 18‐week‐old KO males after 8 weeks on a 60% fat HFD (n = 4 per group).
- Insulin tolerance tests (ITT) from Fig 1H, with blood glucose levels plotted as a percentage of starting glucose levels (glucose %∆) after 25 weeks on NC or a 60% fat HFD. GTT was performed following an overnight fast, ITT following a 3‐h fast (males, n = 6).
- Body weights of WT and KO mice fed NC or a 60% fat HFD for 8 weeks starting at 3 weeks of age (males, n = 15 each). Total food consumed per animal over the course of 8 weeks. Glucose tolerance test (GTT) was given after 8 weeks on the HFD.
Nuclear magnetic resonance spectroscopy (NMR) analysis indicated that the primary difference between the two genotypes was body fat rather than lean mass (Fig 1F–H). This was verified by magnetic resonance imaging (MRI) showing significantly more fat deposition in WT animals than in KO after only 8 weeks on a HFD (Fig 1I). Upon histological examination, the average cross‐sectional area of adipocytes was smaller in the gonadal fat pads (gWAT) of KO than in WT (Fig 1J and K), suggesting a reduction in triglyceride storage at the level of individual adipocytes. Transcript levels for Glut1 and Glut4 were not significantly different in the adipose tissue depots of the KO compared to WT fed the HFD (Fig EV1B); thus, the smaller adipocyte size in the KO is not likely due to changes in glucose uptake.
Inflammation of visceral WAT stores typically precedes the onset of type 2 diabetes (T2D) and has been implicated in its onset 32. Transcript levels for tumor necrosis factor‐alpha (Tnf‐α), Tnf‐beta (Tnf‐β), and the macrophage antigen F4/80 were elevated in gWAT of HFD WT mice, whereas these signs of increased inflammation were absent in the gWAT of KO mice (Fig 1L). Transcripts for monocyte chemoattractant protein‐1 (Mcp‐1) did not increase under HFD in our study but were lower in the KO regardless of diet.
Taken together, these data indicate that Rcan1‐KO mice consume and absorb dietary fat at a rate similar to that of WT mice but store less of it as body fat. Furthermore, when on a HFD, the visceral fat stores of KO mice do not develop signs of inflammation and macrophage infiltration that are often indicative of a pre‐diabetic state.
Rcan1‐KO mice maintain normal lipid handling and insulin sensitivity on a HFD
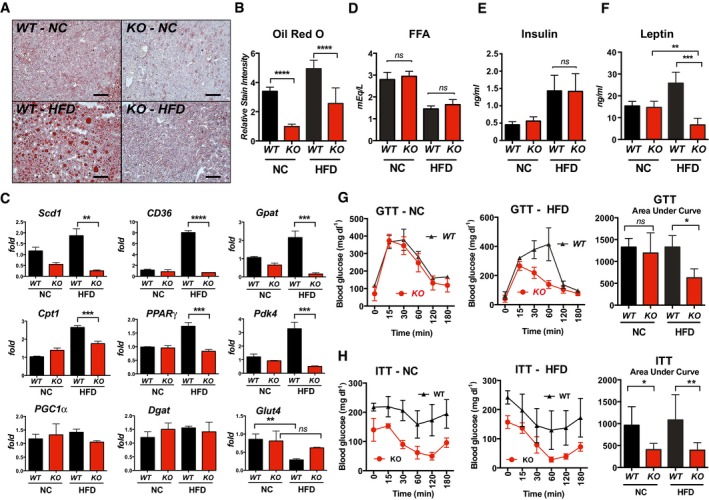
Oil Red O staining showed extensive liver steatosis in WT mice on HFD (Fig 2A). Lipid accumulation was significantly lower in the livers of KO animals compared to WT, on either NC or HFD (Fig 2B). Transcript levels for genes involved in lipid handling and metabolism were elevated in the livers of WT, but not in the KO, including stearoyl‐coenzyme A desaturase (Scd1), fatty acid transporter (CD36), glycerol‐3‐phosphate acyltransferase (Gpat), and carnitine palmitoyltransferase I (Cpt1) (Fig 2C). Expression of genes involved in gluconeogenesis: peroxisome proliferator‐activated gamma (Pparg) and pyruvate dehydrogenase acetyl‐transferase (Pdk4) were likewise elevated in WT mice on HFD but not in KO. Conversely, there was a significant decrease in transcript levels for the facilitated glucose transporter (Glut4) in the livers of WT HFD mice but not KO (Fig 2C). There was no significant change in peroxisome proliferator‐activated receptor gamma coactivator 1 alpha (Pgc1α) or diacylglycerol O‐acyltransferase (Dgat) in either group.
Figure 2. Rcan1‐KO mice maintain normal lipid handling and insulin sensitivity on a HFD.
-
A, BOil Red O staining of livers from WT and KO males after 25 weeks on NC or HFD, with quantification of relative stain intensity (n = 3, three images each). Scale bar = 100 μm.
-
CTranscript levels for genes involved in lipid metabolism and gluconeogenesis in livers of WT and KO mice after 25 weeks on NC or HFD. Stearoyl‐Coenzyme A desaturase (Scd1), fatty acid transporter (CD36), glycerol‐3‐phosphate acyltransferase (Gpat), carnitine palmitoyltransferase I (Cpt1), peroxisome proliferator‐activated gamma (PPARγ), pyruvate dehydrogenase acetyl‐transferase (Pdk4), PPARγ coactivator 1 alpha (PGC1α), diacylglycerol O‐acyltransferase (Dgat), and facilitated glucose transporter (Glut4) (males, n = 4–5). Transcript levels were normalized to 18S.
-
D–FSerum levels of free fatty acids (FAA), insulin, and leptin in WT and KO after 25 weeks on NC or HFD (males, n = 8–10).
-
G, HGlucose tolerance test (GTT) and insulin tolerance test (ITT) after 25 weeks on NC or HFD. GTT was performed following an overnight fast, ITT following a 3‐h fast (males, n = 6).
Serum levels of nonesterified free fatty acids (FFA) were not significantly different in KO when compared to WT (Fig 2D). Both genotypes showed a similar decline in serum FFA when placed on a HFD, indicating reduced reliance on stored triglycerides. Insulin levels were similar in the two genotypes and increased comparably on the HFD (Fig 2E). An analysis of a wide panel of standard blood parameters also showed no significant difference between KO and WT (Fig EV1C). Finally, circulating levels of the adipokine leptin were the same in WT and KO animals on NC (Fig 2F), but significantly elevated only in the WT HFD animals, consistent with their pronounced increase in body fat mass.
Following an overnight fast, WT and KO animals on NC performed similarly in a glucose tolerance test (GTT) (Fig 2G). In contrast, in the animals maintained on a 60% HFD for 25 weeks, blood glucose levels remained elevated longer in the WT than in the KO, as evidenced by the significant difference in the area under the curves (Fig 2G). In an insulin tolerance test (ITT) following a 3‐h fast, initial blood glucose levels in the KO were much lower than WT on either diet and remained lower throughout (Fig 2H). When normalized to starting levels, glucose uptake in the KO was likewise more pronounced (Fig EV1D). If animals were fasted for a longer period prior to the ITT assay, so that starting blood glucose levels were comparable in the WT and KO, the KO mice frequently died of hypoglycemic shock when injected with insulin, particularly those on a high‐fat diet. To evaluate how quickly differences in glucose handing were manifest, we tracked a separate cohort of animals and found significant differences in glucose uptake between the two genotypes by only 8 weeks on the HFD (Fig EV1F). Similar differences in weight gain were observed on a 35% fat diet (Fig EV2A). Furthermore, when maintained on normal chow for a year, KO mice had improved glucose tolerance and insulin sensitivity compared to WT (Fig EV2B). Thus, the KO mice were resistant to age‐dependent declines in glucose metabolism and handling.
Figure EV2. Rcan1‐KO mice are resistant to age‐related obesity and insulin resistance.
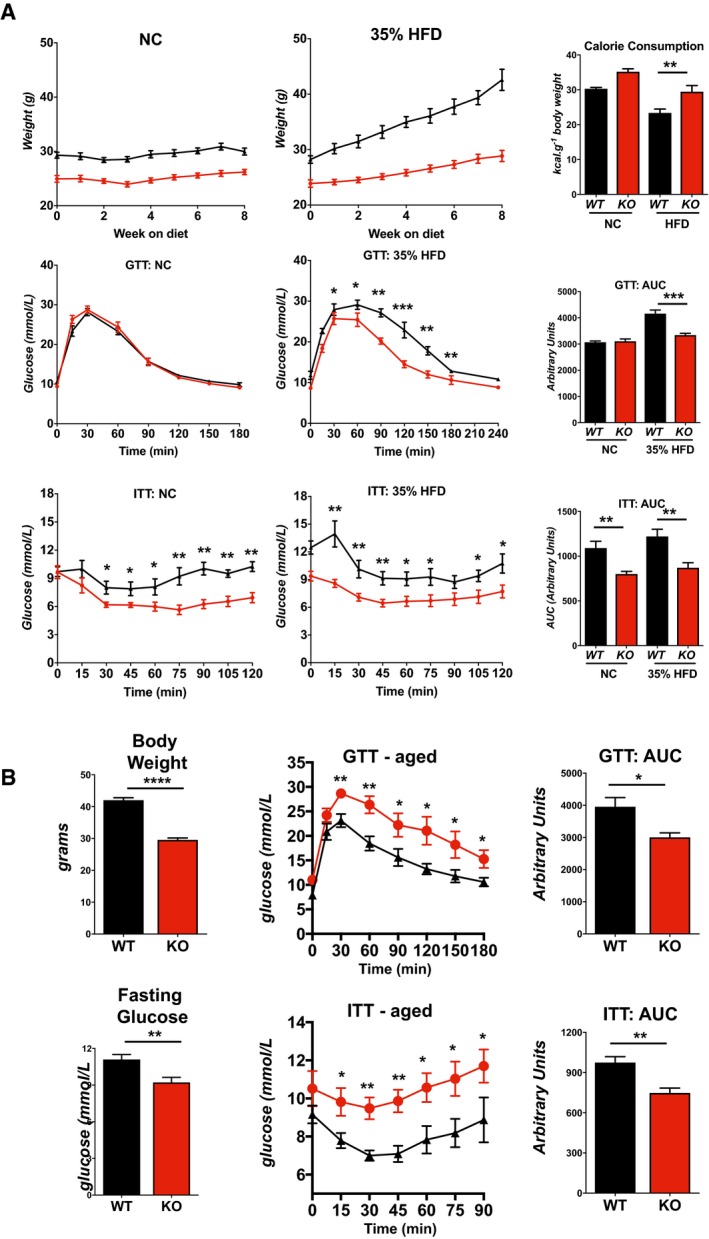
- Body weights (n = 8), food consumption (n = 8), glucose tolerance tests (GTT) (n = 5), and insulin tolerance tests (ITT) (n = 5) for WT and KO male mice fed either a normal chow diet (NC) or a 35% fat HFD for 8 weeks starting at 8–10 weeks of age. Food consumption was measured as kilocalories consumed per gram change in body weight (kcal/g body weight) consumption per animal over the course of 8 weeks.
- Body weights, fasting blood glucose levels, glucose tolerance test (GTT), and insulin tolerance test (ITT) for 1‐year‐old WT and KO mice maintained on a normal chow diet (males, n = 5).
Whole‐body metabolism is elevated in mice lacking Rcan1
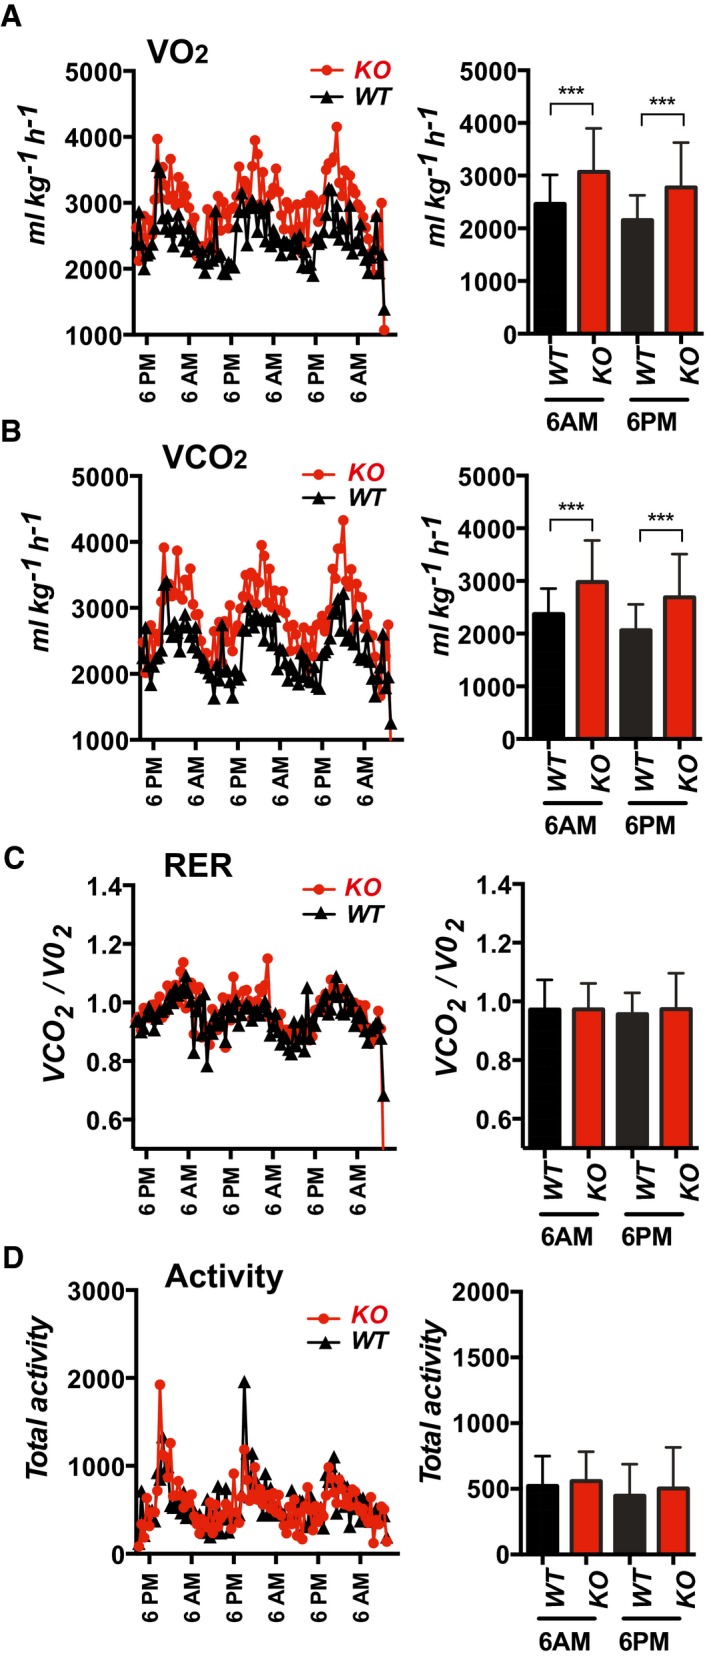
Although we observed dramatic phenotypic differences between WT and KO mice on a HFD, these differences were primarily those one would expect to find when comparing an obese mouse with a lean one. As such, they provide limited insight into the underlying processes being influenced by Rcan1. Therefore, we focused our analysis on identifying metabolic differences between 12‐week‐old KO and WT mice on normal chow. Whole‐body rates of both oxygen consumption (VO2) and carbon dioxide production (VCO2) were significantly elevated in KO mice compared to WT, indicating an increased rate of metabolism (Fig 3A and B). However, there was no difference in the respiratory exchange ratio (RER) (Fig 3C), demonstrating similar substrate preferences and normal circadian shifts between glucose and fatty acid oxidation. Importantly, there was no significant difference in the physical activity between the two genotypes (Fig 3D); thus, the elevated metabolic rate of the KO was not due to a change in physical activity.
Figure 3. Whole‐body metabolism is elevated in the Rcan1‐KO .
-
A–DOxygen consumption (VO2), carbon dioxide production (VCO2), respiratory exchange ratio VCO2/VO2 (RER), and physical activity of 10‐ to 12‐week‐old WT and KO mice on normal chow were measured using the CLAM metabolic cage system (males, n = 6). Bar graphs show the average value of metabolic measurements made within the 60 min flanking 6AM or 6PM. Values shown are average ± SD. ***P < 0.001 (two‐way ANOVA with multiple comparisons).
Depletion of Rcan1 reduces lipid accumulation in differentiated 3T3‐L1 adipocytes
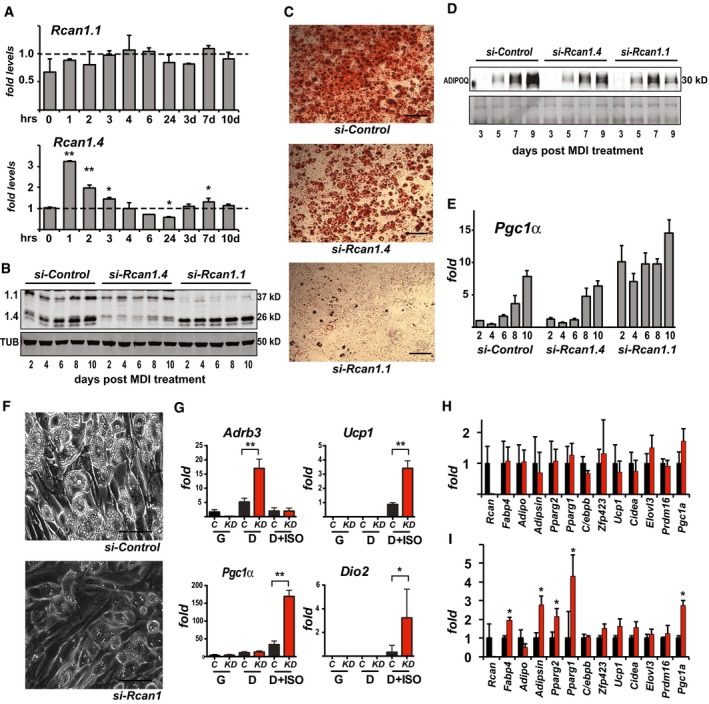
RCAN1.1 protein could be detected by Western blot in extracts of BAT, sWAT, and gWAT from both male and female animals, although in lower abundance than in striated muscle or brain (Fig EV3A and B). To test for RCAN1 adipocyte‐autonomous functions, we used 3T3‐L1 preadipocytes. Changes in transcript levels of both Rcan1.1 and Rcan1.4 were quantified by RT–PCR following treatment with MDI (medium containing 3‐isobutyl‐1‐methylxanthine, dexamethasone, and insulin) to induce differentiation (Fig 4A). Rcan1.1 transcript levels remained relatively constant throughout the time course, whereas Rcan1.4, whose expression is under the control of calcineurin/NFAT 25, was more dynamic, suggesting a rapid transient activation of calcineurin in response to MDI, followed by a more modest, gradual rise later in differentiation. siRNAs targeting each of the isoforms were used to deplete Rcan1 transcripts prior to differentiation. Knockdown (KD) was efficient and sustained over a 10‐days course of differentiation (Fig 4B). Lipid accumulation was markedly reduced in the Rcan1.1 KD cultures compared to controls as assessed by Oil Red O (Fig 4C). The effect of the Rcan1.4 KD on lipid accumulation was much less pronounced, but still evident. Depletion of Rcan1 did not prevent or delay adipocyte differentiation as all treatment groups began releasing adiponectin into the culture media at a similar time (Fig 4D). Transcript levels for Pgc1α, which plays a central role in the activation of the brown and beige adipocyte program 33 increased over the 10‐days course of differentiation in all cultures; however, expression was higher in the Rcan1.1 KD adipocytes at all time points (Fig 4E). Ucp1 transcript levels were below detection.
Figure EV3. RCAN1 protein is present in adipose tissues.
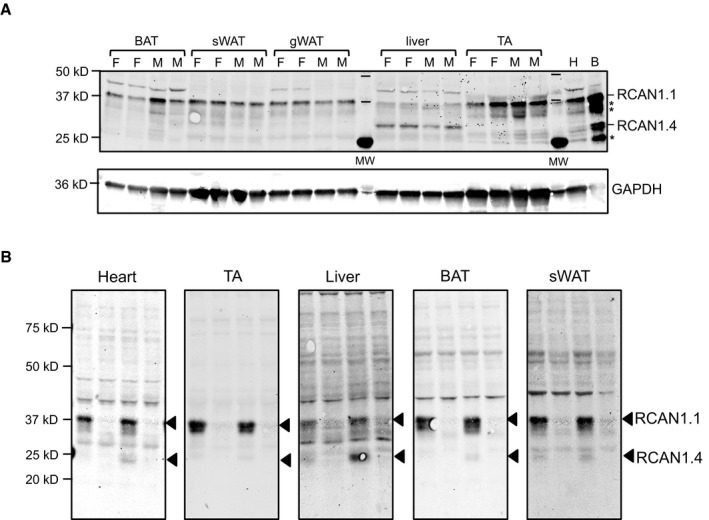
- Western blot analysis for RCAN1.4 and RCAN1.1 proteins in extracts from BAT, sWAT, gWAT, liver, and tibialis anterior skeletal muscle (TA) extracted from 12‐week‐old WT, mixed background females (F) and males (M) on normal chow, housed at vivarium temperatures (20 μg per lane). Protein extracts from heart (H, 20 μg) and brain (B, 10 μg) are included for comparison. The locations of potential cleavage products of RCAN1 are marked with an asterisk (*). GAPDH is provided as a loading control within each tissue type.
- Western blot to validate specificity of RCAN1 antibody. Protein extracts from heart, TA, liver, BAT, and sWAT were probed with anti‐RCAN1 (20 μg per lane). The first two lanes are from animals housed at room temperature. The second two lanes are from animals housed at 4°C for 4–5 h. Tissues were harvested at 2 PM.
Figure 4. Depletion of Rcan1 reduces adipocyte lipid accumulation in vitro.
-
ATranscript levels for Rcan1.1 and Rcan1.4 during differentiation of 3T3‐L1 adipocytes, measured at 0, 1, 2, 3, 4, 6, and 24 h following the addition of MDI as well as at 3, 7, and 10 days as indicated (n = 3). *P < 0.05; **P < 0.01 (unpaired Student's t‐test versus 0 time point).
-
BWestern blot for RCAN1.1, RCAN1.4, and tubulin (TUB) in whole‐cell extracts of 3T3‐L1 adipocytes transfected with a control siRNA or ones targeting either Rcan1.4 or Rcan1.1 (20 μg per lane).
-
CRepresentative images of 3T3‐L1 adipocytes transfected with the indicated siRNAs prior to differentiation and stained with Oil Red O on day 10. Scale bar = 100 μm.
-
DWestern blot for adiponectin (ADPOQ) released into the media during differentiation by 3T3‐L1 adipocytes transfected with the indicated siRNAs. Ponceau‐stained image provides loading control.
-
ETranscript levels for Pgc1‐α in 3T3‐L1 adipocytes transfected with the indicated siRNAs and assayed over 10 days of differentiation (n = 3).
-
FRepresentative bright‐field images showing lipid accumulation at 10 days of differentiation of Ing‐svf cells treated with the indicated siRNA. Scale bar = 50 μm.
-
GTranscript levels for Adrenoceptor beta 3 (Adrb3), uncoupling protein 1 (Ucp1), PPARγ coactivator 1 alpha (PGC1α), and deiodinase type II (Dio2) in Ing‐svf cultures transfected with control siRNA (C) or one targeting Rcan1 (KD) then maintained in growth media (G), or differentiated for 10 days (D) with and without the addition of 100 mM isoproterenol for 6 h prior to harvesting (D+ISO) (n = 2 in triplicate). *P < 0.05; **P < 0.01 (two‐way ANOVA with multiple comparisons).
-
H, ITranscript levels for the indicated panel of genes relevant to adipocyte differentiation in platelet‐derived growth factor receptor alpha‐positive (PDGFRα+) and lineage‐negative (Lin−) stromal vascular cells isolated by FACS analysis sorting from sWAT of WT (black bars) and KO (red bars). In (H), isolated cells were maintained in growth media. In (I), cultures were treated with MDI then differentiated for 10 days. *P < 0.05; **P < 0.01 (unpaired Student's t‐test, WT versus KO time point) (n = 3).
Adrenergic stimulation of Pgc1 and Ucp1 expression is enhanced in subcutaneous adipocytes depleted of Rcan1
The increase in Pgc1α expression and decrease in lipid accumulation observed in Rcan1‐depleted 3T3‐L1 adipocytes, coupled with the lean phenotype of the Rcan1‐KO mice, suggest that Rcan1 may act to suppress differentiation of adipocytes toward a brown or beige phenotype. To study this in cells capable of activating Ucp1 expression, we established an immortalized preadipocyte cell line, Ing‐svf, using stromal vascular cells (SVCs) isolated from sWAT of WT C57BL/6 mice. Ing‐svf cultures were transfected with control or Rcan1‐targeted siRNA (targets both Rcan1 isoforms), then differentiated for 10 days. Similar to the Rcan1‐depleted 3T3‐L1 adipocytes, lipid droplet size appeared smaller in the Rcan1‐depleted Ing‐svf adipocytes than in the control siRNA‐treated cultures (Fig 4F). Importantly, upon differentiation, the Ing‐svf cultures depleted for Rcan1 showed elevated expression of the beta‐3 adrenergic receptor, Adrb3, which is required for cold induction of Ucp1 in sWAT 2 (Fig 4G). Following adrenergic stimulation with isoproterenol (ISO), transcript levels for Pgc1α, Ucp1, and type II deiodinase (Dio2) were higher in Rcan1‐depleted cultures than in the control siRNA cells, suggesting an increased beiging response in the absence of Rcan1. To determine whether these differences were manifest in the adipocyte progenitors of the Rcan1‐KO mice, fluorescence‐activated cell sorting (FACS) was used to isolate platelet‐derived growth factor receptor alpha‐positive and lineage‐negative (PDGFRA+/Lin−) SVCs from the sWAT of WT and Rcan1‐KO mice. When maintained in growth media, there was no significant difference in expression of a wide panel of genes related to adipocyte differentiation and metabolic phenotype (Fig 4H). However, following differentiation with MDI, expression of a number of these genes, including Pgc1α, Pparγ1, and Pparγ2, was higher in the cultures derived from the Rcan1‐KO than in those derived from WT (Fig 4I). Taken together, these studies suggest that Rcan1 has an adipocyte‐autonomous inhibitory effect on differentiation toward a UCP1+, thermogenic beige/brown phenotype.
Cold‐induced “beiging” of subcutaneous WAT is enhanced in the Rcan1 KO
To compare the cold‐induced beiging response of KO with that of WT, animals were housed for 5 days in a 6°C environment or maintained under normal vivarium temperatures (RT = 24°C). The morphology of the fat pad and extent of UCP1+ staining were similar in the WT and KO animals housed at RT. Both genotypes showed a mosaic of uni‐ and multi‐locular adipocytes with patchy regions of low‐intensity UCP1+ staining (Fig 5A). Following 5 days of cold exposure, the increase in UCP1+ signal was more pronounced in the KO animals. In animals maintained at RT, Pgc1α and Ucp1 transcript levels were similar in WT and KO, although significantly higher in the sWAT of males than in females (Fig 5B). Following 24‐h exposure to 4°C, cold induction of Pgc1α and Ucp1 in sWAT of females was significantly greater in KO than WT (Fig 5B). In males, the cold‐induced response trended toward higher in KO, but did not reach statistical significance. Diet‐induced beiging of sWAT in response to a prolonged HFD was also greater in the KO, as evidenced by higher transcript levels for Pgc1α, Ucp1, and Adbr3 (Fig 5C). Thus, animals deficient for Rcan1 showed enhanced activation of adaptive thermogenesis in sWAT in response to either temperature or diet. In contrast, there was no significant difference in the transcript levels for several genes involved in BAT specification (pRB1, Zfph23, and Prdm16) in the sWAT of KO compared to WT fed a HFD (Fig 5C). Taken together, these data suggest that Rcan1 suppresses both diet‐ and cold‐induced adaptive thermogenesis of WAT, through a mechanism involving the Pgc1α/Ucp1 axis.
Figure 5. Rcan1‐KO mice show enhanced beiging of adipocytes in sWAT and elevated expression of SLN skeletal muscle.
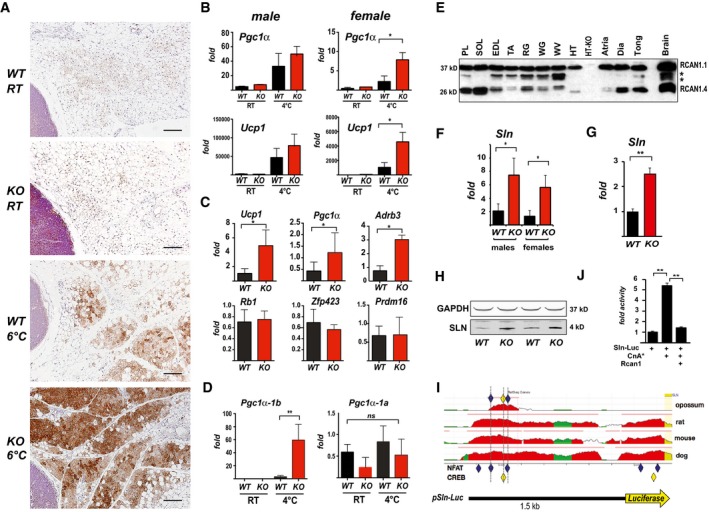
- Representative H&E histological sections of sWAT from WT and KO mice probed with anti‐UCP1 antibodies. Mice were either maintained at 24°C (RT) or housed at 6°C for 5 days. Scale bar = 200 μm.
- Transcript levels of Pgc1α and Ucp1 in sWAT of male and female WT and KO mice after 24 h at RT or 4°C (n = 5).
- Transcript levels of Ucp1, Pgc1α, Adrb3, retinoblastoma 1 (Rb1), zinc finger protein 423 (Zfp423), and PR domain containing 16 (Prdm16) were quantified in sWAT of WT and KO mice after 25 weeks on a HFD (n = 4–5).
- Transcript levels of Pgc1α‐1b and Pgc1α‐1a isoforms in sWAT of WT and KO 8‐week‐old females maintained at 24°C (RT) or housed at 4°C for 24 h (n = 5).
- Western blot for RCAN1 in various skeletal muscle groups. Each lane was loaded with 20 μg of total protein from plantaris (PL), soleus (SOL), extensor digitorum longus (EDL), tibialis anterior (TA), red gastrocnemius (RG), white gastrocnemius (WG), white vastus lateralis (WV), heart ventricle (HT), atria, diaphragm (Dia), and tongue (Tong). The lane containing brain extract was loaded with 10 μg of protein. Antibody specificity was validated by running 20 μg of protein from the heart of an Rcan1‐KO animal (HT‐KO). The asterisks * indicate the location of putative proteolytic fragments of RCAN1.1.
- Transcript levels of Sln in skeletal muscle (tibialis anterior) of 8‐ to 10‐week‐old WT and KO mice housed at RT (n = 4–5 each gender).
- Transcript levels of Sln in skeletal muscle (tibialis anterior) of 8‐ to 10‐week‐old male WT and KO animals housed at RT (n = 5).
- Representative Western blot showing SLN protein in soleus muscle of 8‐ to 10‐week‐old WT and KO animals housed at RT. GAPDH was used as a loading control.
- Alignment of the genomic region 1.5‐Kb upstream of the mammalian Sln gene using the ECR Browser (http://ecrbrowser.dcode.org/). Human was used as the reference genome. The location of conserved NFAT binding sites is indicated by blue diamonds and CREB sites by yellow. Sites were conserved across all mammalian species available in the database except opossum. Mouse, rat, and dog are provided as representative examples. The structure of the Sln‐Luc reporter construct is aligned below.
- Activity of the Sln‐Luc reporter in C2C12 myoblasts transiently transfected with an empty control vector or ones expressing constitutively active calcineurin (CnA*) and Rcan1. Luciferase activity was normalized to beta‐galactosidase activity from a co‐transfected vector (n = 3, assayed in duplicate).
Rcan1‐dependent control is specific for the Pgc1α‐1b transcript during cold‐induced beiging of sWAT
Pgc1α is required for transcriptional activation of cold‐induced adaptive thermogenesis 33. The Pgc1α gene produces multiple transcripts by differential promoter usage and splicing 34, 35. Upstream of the classical transcript start site, Pgc1α‐1a, there is an alternative Pgc1α‐1b promoter under the control of the cAMP responsive CRE‐binding protein (CREB). Cold activation of Pgc1α expression in BAT is specific for the Pgc1α‐1b transcript 36. In skeletal muscle, calcineurin‐regulated CRTCs have been found to coactivate CREB to drive Pgc1α expression 37. Therefore, we postulated that the increase in Pgc1α transcript levels in the Rcan1‐KO mice following cold exposure would be specific for the Pgc1α‐1b isoform. Pgc1α‐1b transcript levels were below the level of detection in animals of either genotype housed at RT. After 24 h at 4°C, Pgc1α‐1b transcripts were significantly higher in the sWAT of the KO compared to WT (Fig 5D). Pgc1α‐1a was expressed in both genotypes housed at RT and was not cold‐induced. These data indicate that RCAN1 suppression of Pgc1α expression is specific for the Pgc1α‐1b transcript during cold adaptation of sWAT.
Loss of Rcan1 has minimal impact on cold activation of BAT
Under basal conditions, transcript levels for Ucp1, Pgc1α, and Adrb3 were not elevated in BAT of KO animals compared to WT (Fig EV4A). Similarly, cold induction of Ucp1 and the Pgc1α‐1b isoform in BAT was of the same magnitude in WT and KO animals (Fig EV4B). Consistent with this, UCP1 protein levels in BAT were similar in WT and KO (Fig EV4C) as was the ability to maintain body temperature following a shift to 4°C (Fig EV4D). We found no genotype differences in the rates of lipolysis in BAT and gWAT, either under basal conditions or following adrenergic stimulation (Fig EV4E). However, in sWAT, the basal rate of lipolysis was significantly higher in the KO compared to WT. Following adrenergic stimulation, fold activation was much lower in the KO compared to the WT response, although the maximal stimulated rates were similar. Taken together, these data suggest that RCAN1 plays a unique role in adipose tissue stores capable of undergoing white‐to‐brown conversion, acting to both suppress basal rates of lipolysis and limit adrenergic activation of Ucp1 expression during cold‐induced beiging. Remarkably, loss of RCAN1 appears to have minimal impact on these processes in canonical WAT and BAT.
Figure EV4. The thermogenic responses of KO BAT are similar to those of WT .
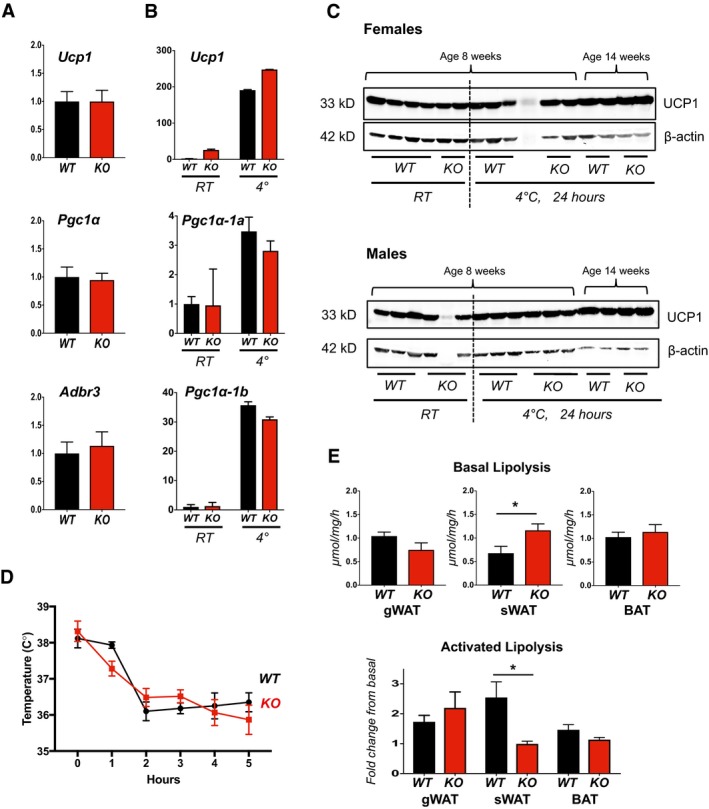
- Transcript levels for Ucp1, Pgc1α, and Adr‐b3 in BAT from 18‐week‐old male WT and KO animals on normal chow, housed at normal vivarium temperatures (n = 5).
- Transcript levels for Ucp1, Pgc1α‐1a, and Pgc1α‐1b in BAT of WT and KO mice following cold exposure. 10‐ to 12‐week‐old WT and Rcan1 KO females were housed at 24°C (RT) or shifted to 4°C for 24 h. Tissues were harvested between 10 and 12 AM (n = 5).
- Western blot analysis for UCP1 and β‐actin in protein extracts of WT and KO BAT from animals housed at 24°C (RT) or shifted to 4°C for 24 h. The upper panel contains protein extracted from females. The lower panel is from males (20 μg protein per lane).
- Change in body temperature following shift of WT and KO mice to 4°C measured using a rodent rectal temperature probe (World Precision Instruments) (females, n = 3, ± SD).
- Upper panel shows basal rates of lipolysis measured in gWAT, sWAT, and BAT tissue explants from WT and KO animals. Fold change in lipolysis following adrenergic stimulation is compared in the lower panel (males, n = 5, ± SEM). *P < 0.05 (t‐tests in E, upper panel; two‐way ANOVA with multiple comparisons in E, lower panel).
Expression of sarcolipin is increased in striated muscle of Rcan1‐KO mice
The preceding data demonstrate that mice deficient for Rcan1 have an increased adipocyte‐autonomous capacity for cold and diet‐induced beiging of sWAT. However, this is not likely sufficient to account for the elevated whole‐body metabolic rate of young Rcan1‐KO mice housed at RT (Fig 3), because these mice show no evidence of increased UCP1 compared to WT. In humans, adipose tissue is estimated to contribute < 1% of REE 3, whereas striated muscle contributes as much as 30%. As much as 50% of the ATP consumed by skeletal muscle in animals at rest is expended by SERCA to cycle Ca2+ ions 38. RCAN1 is abundant in striated muscle 10, and forced expression in skeletal muscle can prevent formation of highly oxidative type I fibers 39. Protein levels of RCAN1.1 were similar across a variety of skeletal muscle groups, whereas RCAN1.4 levels varied depending on the fiber‐type composition of the muscle, with higher levels found in more highly oxidative muscles such as the soleus and plantaris (Fig 5E). Metachromatic staining for muscle fiber‐type composition 40 (Fig EV5A) and myosin heavy chain resolution 41 (Fig EV5B) showed that the skeletal muscle of the Rcan1 KO animal had not shifted toward a more oxidative fiber‐type composition. If anything, there appeared to be a reduction in highly oxidative type I fibers. Thus, a shift in fiber‐type composition could not explain the elevated metabolic rate. AKT phosphorylation following an insulin injection was similar in the skeletal muscle of both genotypes (Fig EV5C), indicating a similar ability to respond to insulin, consistent with the similarity in the shapes of the ITT responses seen in Fig 2H.
Figure EV5. Skeletal muscle parameters and changes in RCAN1 protein levels.
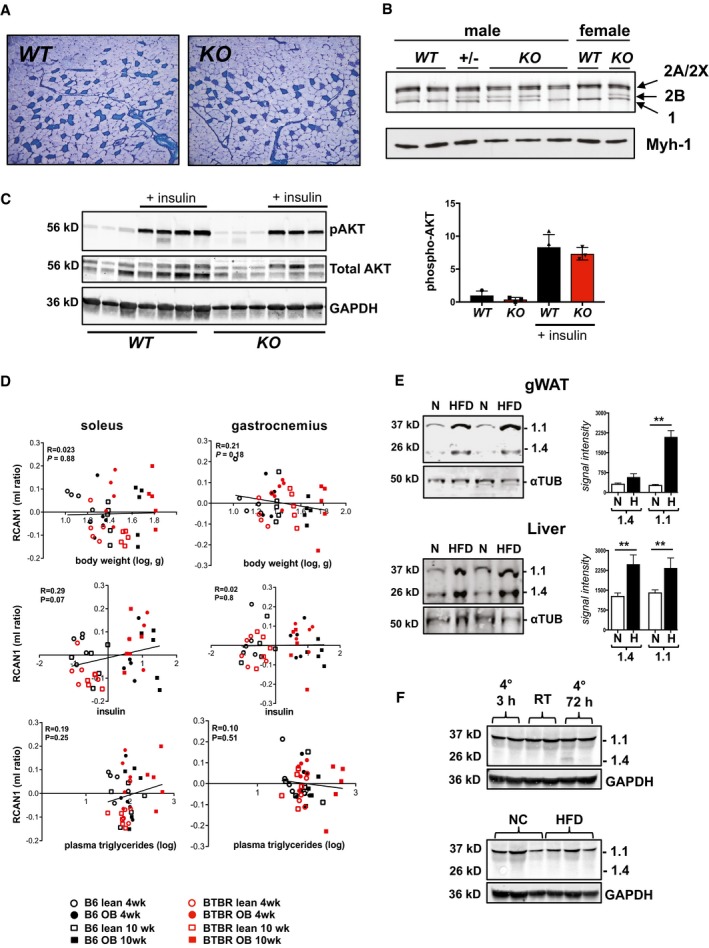
- Representative image showing metachromatic fiber‐type stain of the gastrocnemius muscle proximal to the plantaris muscle in 12‐week‐old, male WT and KO animals.
- Silver stain of high‐resolution myosin heavy stain SDS–PAGE gels of soleus muscle. Location of oxidative type 1 (1), oxidative type 2A (2A/2X) and glycolytic 2B (2B) myosin heavy chain proteins are indicated by arrows. Lower panel provides a Western blot of the same extracts probed for oxidative, type 1 myosin heavy chain (Myh‐1).
- Western blot analysis for phosphorylated AKT, total AKT, and GAPDH in extracts from gastrocnemius skeletal muscle of 10‐week‐old female WT and KO animals house at RT on NC. Insulin was injected 10 min prior to harvesting tissue. Graph at right provides quantification of Akt phosphorylation (n = 3–4, ± SEM).
- Correlation of Rcan1 expression in soleus and gastrocnemius skeletal muscle with body weight, plasma insulin, and plasma triglycerides, in a data set comparing backgrounds susceptible (BTBR background) or resistant (C57BL/6 background) to diabetes when carrying the leptin ob/ob (ob) mutation. Measures are reported as the ratio of the mean log10 intensity (ml ratio). Regression line (black), r = linear regression, P = P‐value.
- Western blot analysis for RCAN1 and α‐tubulin (αTUB) proteins in gWAT (n = 6) and liver (n = 3) of WT, males on normal chow (N) or high‐fat diet (H) for 8 weeks starting at 10 weeks of age. **P < 0.01 (two‐way ANOVA with multiple comparisons).
- Western blot analysis for RCAN1 and GAPDH proteins in gastrocnemius skeletal muscle of 3‐month‐old, WT, mixed background, males maintained at vivarium temperatures (RT) or housed at 4°C for either 3 or 72 h as indicated. The lower blot shows extracts of gastrocnemius from WT C57BL/6 males fed normal chow (NC) or high‐fat diet (HFD) for 15 weeks, starting at 10 weeks of age (20 μg protein per lane).
Given the recent studies identifying SLN as a key determinant of basal metabolic rate and muscle‐based thermogenesis 5, 7, we asked whether a change in SLN levels in skeletal muscle could contribute to the elevated whole‐body metabolic rate of Rcan1‐KO mice. Indeed, Sln transcript levels were higher in the skeletal muscle of Rcan1‐KO mice compared to in WT mice housed at 24°C (Fig 5F). In contrast to Pgc1α and Ucp1 in sWAT, there was no significant difference between males and females with regard to Sln transcript levels. Western blot analysis confirmed a corresponding increase in SLN protein levels in skeletal muscle of the KO mice (Fig 5G). Sln transcript levels were likewise elevated in the KO heart, another striated muscle where Sln is expressed (Fig 5H).
The Sln promoter responds to calcineurin
In mouse, Sln is preferentially expressed in muscle groups rich in oxidative fibers 42. However, fiber‐type analysis indicated that skeletal muscle in the KO was not more oxidative (Fig EV5A and B). Thus, the increase in SLN levels was not due to a shift in fiber‐type content. Little is known regarding the transcriptional controls that mediate Sln expression. The ECR Browser (http://ecrbrowser.dcode.org/) indicated two clusters of NFAT‐ and CREB‐binding sites conserved across all available mammalian genomes (excluding opossum) (Fig 5H). To test whether this genomic region is calcineurin‐responsive, the 1.5‐Kb fragment was cloned upstream of a luciferase reporter (Fig 5H) and used in transient transfections of C2C12 myoblasts. Co‐transfection with a plasmid encoding a constitutively active form of calcineurin (CnA*) increased reporter activity. Co‐transfection with a vector expressing Rcan1 blocked activation of the reporter by CnA* (Fig 5I). Taken together, these data suggest that a calcineurin‐dependent increase in expression of Sln in the skeletal muscle of Rcan1‐KO mice contributes to the elevated REE of these animals.
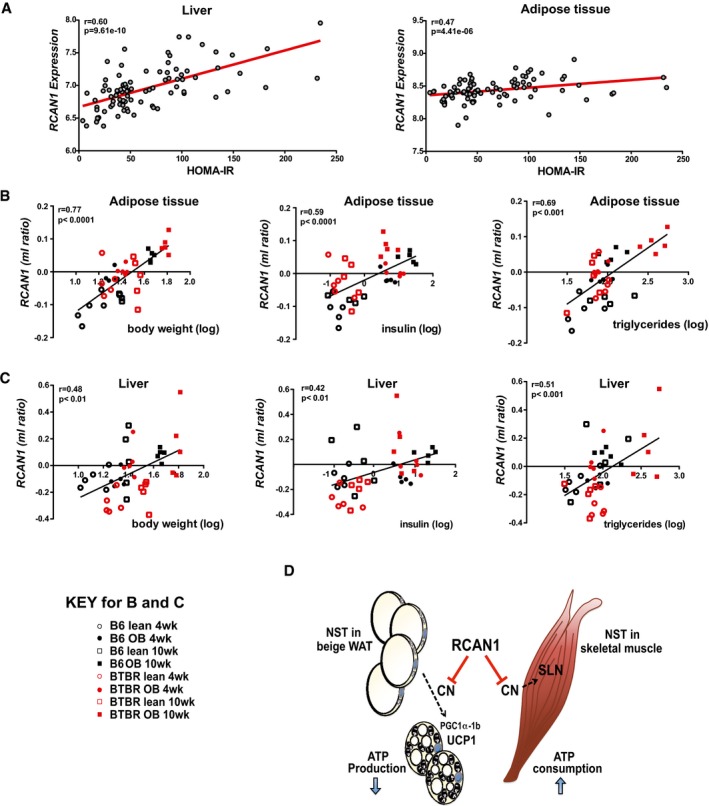
Liver and adipose tissue expression of Rcan1 correlates with measures of metabolic syndrome
Using a publicly available data set designed to identify associations between gene expression levels in target tissues and metabolic traits in a diverse population of more than 100 unique inbred mouse strains 43, we plotted Rcan1 gene expression in liver and adipose tissue as a function of HOMA‐IR (homeostatic model of assessment of insulin resistance) after 8 weeks on a high‐fat/high‐sugar diet (32% kcal from fat and 25% kcal from sucrose). There was a positive correlation between Rcan1 transcript levels and HOMA‐IR index in both liver and white adipose tissue (Fig 6A). For liver, Rcan1 ranked as the strongest positive correlation with HOMA‐IR in the data set of over 22,000 microarray probesets. In adipose tissue, Rcan1 ranked in the top 4% strongest correlations. Surprisingly, a similar analysis showed no association between Rcan1 transcript levels in skeletal muscle and HOMA‐IR (Fig EV5D). It may be relevant to note that RCAN1.1 and RCAN1.4 protein levels increased in both white adipose tissue and liver following 8 weeks on HFD (Fig EV5E). In contrast, RCAN1 protein levels did not change in skeletal muscle in response to either 8 weeks of HFD or short‐term cold exposure (Fig EV5F). Thus, only tissues with a positive association between Rcan1 transcript levels and HOMA‐IR showed increased protein levels on a HFD.
Figure 6. Rcan1 expression is positively correlated with indices of metabolic syndrome.
-
ACorrelation of Rcan1 expression in liver and gonadal adipose tissue with HOMA‐IR, using male mice from over 100 strains from the hybrid mouse diversity panel. Regression line (red), r = biweight midcorrelation, P = P‐value.
-
B, CCorrelation of Rcan1 expression in gonadal adipose tissue and liver with body weight, plasma insulin, and plasma triglycerides, in a data set comparing backgrounds susceptible (BTBR background) or resistant (C57BL/6 background) to diabetes when carrying the leptin ob/ob (ob) mutation. Measures are reported as the ratio of the mean log10 intensity (ml ratio). Regression line (black), r = linear regression, P = P‐value.
-
DModel for RCAN1 suppressive control over two prominent mechanisms of mammalian non‐shivering thermogenesis (NST): one in white adipose tissue, where uncoupling of the mitochondrial membrane potential by UCP1 increases heat generation at the expense of ATP production; the other in skeletal muscle, where SLN increases ATP consumption by SERCA. In adipose tissue, RCAN1 suppresses the conversion of white adipocytes to UCP1‐positive, beige adipocytes by acting as a brake on calcineurin (CN)‐dependent activation of Pgc1α‐1b expression, thereby blunting downstream activation of Ucp1 expression. In skeletal muscle, RCAN1 suppresses CN‐dependent expression of Sln directly. Loss of these repressive functions underlies the elevated metabolic rate and lean phenotype of the Rcan1‐KO animals.
Using a second data set profiling gene expression in tissues from lean and obese mouse strains that are resistant or susceptible to diabetes 44, we also found positive correlations for Rcan1 expression in liver and adipose tissue with body weight, triglycerides, and insulin (Fig 6B and C). Taken together, these data identify the Rcan1 gene as a gene highly correlated with metabolic syndrome, consistent with our studies of the Rcan1‐KO mice.
Discussion
Obesity has been estimated to reduce life expectancy by as much as 6–20 years 1, 45 and is associated with an increased risk for type 2 diabetes, cardiovascular disease, and cancer. On a global level, the causes driving this epidemic in obesity are multifactorial, involving factors such as socioeconomic pressures, education, and nutritional content. On an individual level, the underlying cause lies in an imbalance between calories consumed and calories expended. However, control over this deceptively simplistic equation involves a complex network of gene–environment interactions that feed back to establish homeostatic control. Mammals evolved under the selective pressures of food limitation and environmental exposure, developing mechanisms for both long‐term storage of calories and their expenditure for functions such as thermogenesis when needed. Although UCP1 and SLN act through distinct mechanisms, levels of both proteins increase in their respective tissues under prolonged exposure to cold, leading to a long‐term, adaptive increase in thermogenic potential. The ability to adjust thermogenic capacity to environmental conditions is critical as it guards against unnecessary expenditure of limited energy resources when thermogenesis is not needed. Here, we provide evidence that the Rcan1 gene acts as a centralized brake on both of these adaptive, thermogenic responses, providing systemic control over energy resources.
Although Ucp1‐KO mice are acutely sensitive to cold temperatures, they can gradually adapt to 4°C through activation of compensatory thermogenic mechanisms 46, 47, such as increasing SLN in skeletal muscle 8, 48. Conversely, Sln‐KO animals adapt through increased expression of Ucp1 and enhanced browning of WAT 8. Thus, although expression of both Ucp1 and Sln increases in response to cold exposure, there are systemic regulatory mechanisms that feed back to establish the appropriate balance between these two thermogenic mechanisms. In the absence of Rcan1, the “set‐point” of this balance appears to have been raised, as both UCP1 and SLN levels are elevated in the Rcan1‐KO, suggesting that in WT animals, Rcan1 functions to limit the magnitude to which each of these thermogenic processes are activated in its respective tissue (Fig 6D).
Rcan1 limits activation of Pgc1α and Ucp1 during beiging
Here, we demonstrate that loss of Rcan1 does not alter the ability of preadipocytes to differentiate; rather, it alters the capacity of those adipocytes to respond to adrenergic signals that promote beiging. This was most pronounced in sWAT of the KO mice where cold induction of Pgc1α and Ucp1 expression was significantly higher than in WT (Fig 5). In humans, the capacity for UCP1‐dependent thermogenesis is inversely associated with insulin resistance, diabetes, and obesity 49, 50. It is relevant to note that the molecular signature of UCP1‐positive adipocytes in humans more closely resembles beige adipocytes than classical BAT regardless of their location in the body 51. Therefore, the increased beiging response displayed by Rcan1‐KO mice may be particularly applicable to control of UCP1‐dependent thermogenesis in humans.
Pgc1α is both required 52 and sufficient to promote Ucp1 expression 33. Enhanced, cold activation of Pgc1α expression in Rcan1‐KO mice was specific for the alternative Pgc1α‐1b isoform, whose expression in skeletal muscle is dependent on calcineurin‐activated CRTCs 34, 37. Taken together, our results are consistent with a model in which RCAN1 acts to suppress calcineurin‐/CRTC‐/CREB‐dependent expression of Pgc1α‐1b, thereby suppressing adaptive increases in Ucp1 expression during the beiging response. Relevant to our studies, a recent paper provides evidence for binding of CRTC3 directly to the Ucp1 locus 53, potentially placing Ucp1 under control of RCAN/calcineurin both in parallel with and downstream of Pgc1α‐1b.
Rcan1 suppresses Sln expression in skeletal muscle
Both in vitro and in vivo studies suggest that Sln is under the control of calcineurin (Fig 5). Based on the sequence alignment of the proximal promoter, there are evolutionarily conserved binding sites for NFAT and CREB, either of which is capable of mediating calcineurin‐dependent control. Whether these signaling pathways act in concert or individually to influence Sln expression is yet to be determined. Skeletal muscle‐specific deletion of SIK1, a suppressor of CRTC‐mediated transcription, improves insulin sensitivity and glucose disposal in mice on a HFD 54, highlighting the relevance of CRTC pathway to skeletal muscle‐mediated glucose control.
In rodents, Sln is preferentially expressed in oxidative fibers 42, the muscle fiber‐type associated with higher calcineurin activity 55. In larger mammals, including humans, SLN levels are an order of magnitude higher than in rodents and not restricted to slow fiber‐type muscles 42, 56. Thus, SLN may contribute to a larger share of NST in humans than in mice. Similar to the Rcan1‐KO mice, transgenic mice with skeletal muscle‐specific overexpression of Sln have a higher whole‐body metabolic rate, consume more calories, gain less weight on a HFD, and have lower glucose levels following a fast 57, demonstrating that increased Sln expression could be sufficient to cause this array of phenotypes in the Rcan1‐KO. However, calcineurin signaling is a central mediator of skeletal muscle metabolic adaptation 58. It would therefore be naive to assume that elevated SLN content is the only metabolically relevant change in the skeletal muscle of the Rcan1‐KO animals.
Rcan1 acts in multiple tissues
Calcineurin and its regulator RCAN1 are involved in many physiological processes capable of impacting metabolism. In the pancreas, expression of a number of genes important for β‐cell proliferation is under the control of NFAT 59. We previously showed that systemic overexpression of Rcan1.1 inhibits glucose‐stimulated insulin secretion from β‐cells 26, 27 and influences vesicle recycling 60, 61. Furthermore, overexpression of Rcan1.1 in acinar cells blocks pancreatic growth 62. It was therefore surprising to find that plasma insulin levels in young Rcan1‐KO mice were similar to those of WT on a normal chow diet, and increased similarly on the HFD, although phenotypic differences did manifest with aging (Fig EV2B). Calcineurin signaling is important in immune responses, and indeed, Rcan1 is present in a variety of cell types of both the innate and adaptive immune systems 63, 64, 65, 66. RCAN1 can suppress NF‐κβ activation 67, and Rcan1‐KO mice show enhanced inflammatory responses 68, 69. Thus, the reduction in inflammatory markers in the gWAT of the KO mice on HFD is likely secondary to the lean phenotype rather than due to suppression of an immune response in the KO. Along these same lines, endothelial cell dysfunction is a prominent feature of diabetes 70, whereas RCAN1 promotes endothelial barrier integrity 71; thus, loss of Rcan1 in endothelial cells is not likely the driving mechanism behind the lean phenotype in our studies.
In young animals, the most prominent difference comparing KO to WT was the elevation in whole‐body metabolic rate (Fig 4). As discussed earlier, the increase in SLN levels, observed in young mice housed at RT and fed NC, could be sufficient to explain this phenotype. In contrast, differences stemming from the enhanced beiging response might only become manifest following an initiating challenge, such as cold exposure or HFD feeding. It is important to note that all of the animals used in our studies were raised under normal vivarium temperatures (~23°C) rather than thermoneutral conditions. Therefore, based on the studies presented here, it is not possible to know whether the elevated metabolic rate observed in young Rcan1‐KO mice (Fig 3) is an inherent developmental phenotype or already reflects an enhanced adaptation to the environment.
Across the genome, Rcan1 expression in liver has the strongest positive correlation with markers of worsening metabolism and ranks within the top 4% of positive correlations in WAT 43. The positive correlation of Rcan1 expression in WAT with HOMA‐IR, body weight, triglycerides, and insulin levels (Fig 6B and F–H), combined with our evidence that loss of Rcan1 reduces fat storage and improves metabolic function, supports a model in which Rcan1 acts to impair metabolism, rather being expressed downstream of metabolic change. Surprisingly, no correlation was found for Rcan1 expression in skeletal muscle (Fig EV5D). It is interesting to note that we found no change in RCAN1 protein levels in skeletal muscle in response to either cold or HFD (Fig EV5F). This might suggest that the mechanism of action of RCAN1 relative to NST in skeletal muscle does not involve a change in RCAN1 abundance, whereas in liver and adipose tissue, it does.
A potential confounding factor when assessing RCAN1 levels is the circadian pattern of Rcan1.4 expression reported for both skeletal muscle 72 and heart 73, 74, but which may also occur in other tissues. In addition, Rcan1 transcript levels have been shown to display seasonal changes in hibernating animals 75. This raises the interesting possibility that daily or seasonal changes in RCAN1 levels could impact the magnitude of energy mobilization or a thermogenic response.
The fact that the strongest positive correlation between Rcan1 expression and insulin resistance was found in liver (Fig 6A and C–E) suggests that RCAN1 is also relevant to metabolic control in this tissue. This is perhaps not surprising given the broad tissue distribution of calcineurin and the breadth of processes dependent on calcineurin‐mediated signaling. Interestingly, Rcan2‐KO mice were recently found to be resistant to age and diet‐induced obesity 76, 77. However, in contrast to the Rcan1‐KO mice, the underlying cause in the Rcan2‐KO mice was a reduction in food intake rather than an increase in energy expenditure, and the relevant site of action for Rcan2 was the hypothalamus. Thus, relative to controlling metabolic balance, both RCAN family members act to conserve calories but carry out apparently distinct functions, with Rcan2 acting in the central nervous system to promote caloric intake and Rcan1 suppressing thermogenic expenditure of calories in peripheral tissues. Although, given RCAN1's abundance in neurons, we cannot rule out the possibility that the central nervous system also has a role in metabolic phenotype of the Rcan1 KO animals.
We have recently shown that loss of RCAN1 increases calcineurin‐dependent mitochondrial fission both in vitro and in vivo 78. Consistent with increased fission, we found that mitochondrial membrane potential and oxygen consumption were lower in myocytes and fibroblasts isolated from Rcan1‐KO mice. Thus, one might predict a more fragmented mitochondrial network to reduce metabolic rate rather than increase it. However, it is intriguing to note a recent study that reports a connection between mitochondrial fission and white‐to‐beige conversion of human adipocytes 79. Therefore, it is possible that, in addition to the mechanisms we have documented here, altered mitochondrial dynamics may also contribute to enhanced adaptive NST in the absence of Rcan1.
In conclusion, we provide evidence that Rcan1 influences metabolism by cell‐autonomous suppression of two thermogenic processes, one in adipose tissue and the other in skeletal muscle. This ability to limit energy expenditure by NST may be critical for survival when food sources are scarce but have become maladaptive in current conditions of caloric abundance. We postulate that these findings may be of particular relevance to individuals with DS, a population with increased adiposity and insulin resistance 80, 81 coupled with reduced REE 82, phenotypes opposite to those observed in the Rcan1‐KO. Given the wide range of physiological processes regulated by calcineurin, it is probable that additional points of Rcan1‐dependent metabolic control may be identified in the future.
Materials and Methods
Mice
Two independently derived Rcan1‐KO lines were used in our studies: one lacking exons 5 and 6 83 and the other deficient for the coding regions of exon 6 and 7 84. Mice were maintained on a mixed 129SvJ × C57BL/6 genetic background, homozygous for a wild‐type allele of the nicotinamide nucleotide transhydrogenase locus (Nnt), mutation of which can dysregulate glucose homeostasis and increase weight gain on a HFD 85, 86. The two lines were indistinguishable relative to metabolic phenotype. Whenever possible, littermates from (Het × Het) crosses were used. In addition, to increase yields, sibling mice from (Het × Het) crosses were used to set up (Het × KO) and (WT × WT) crosses, and to generate KO and WT animals, respectively. New breeding pairs were periodically set up from the offspring of (Het × Het) crosses. Experimental animals were age‐matched and always only one generation away from the founding (Het × Het) cross. Unless otherwise noted, animals were housed at 23°C under standard vivarium conditions under a 12:12‐h light:dark cycle. Animals were allowed free access to water and were fed ad libitum either a normal chow diet (NC), in which 4% of the caloric content derived from fat (LabDiet 5001), a high‐fat diet (HFD) in which 60% of the calories derived from fat (Research diet D12492), or a 35% fat diet of similar composition produced by Specialty Feeds (WA, Australia). Food consumption and body weight were recorded weekly. For cold‐induction experiments, mice were housed at 6°C under a 12:12‐h light:dark cycle with free access to food and water. All animal procedures were carried out with the oversight and approval of the University's Institutional Animal Care and Use Committee and conformed to the current Guide for the Care and Use of Laboratory Animals, published by the National Institutes of Health. Unless otherwise noted, tissues were harvested between 10 AM and 2 PM.
Cell lines
3T3‐L1 preadipocytes (ATCC) were cultured at 37°C, 5% CO2, 21% O2, in a growth medium of Dulbecco's modified Eagle's medium with high glucose plus pyruvate, supplemented with 10% (v/v) fetal calf serum, 100 units/ml penicillin G, and 100 mg/ml streptomycin. Two days after reaching confluence (day 0), cells were treated for 2 days with growth medium plus MDI (0.5 mM methylisobutylxanthine, 1 μM dexamethasone, and 10 μg/ml insulin, all from Sigma) to induce differentiation. At day 2 differentiation, media were replaced with growth medium containing 10 μg/ml insulin for 2 days and then every 2 days thereafter with growth medium alone. Samples of media were removed prior to each change for analysis of adiponectin content by Western blot. After 10 days, cells were harvested for protein and RNA or fixed with formalin and stained with Oil Red O. ON‐TARGETplus siRNAs (Dharmacon) were used to deplete RCAN1. Preadipocyte cultures were grown to confluence then transfected with a non‐specific control siRNA (IDT) or siRNAs targeting RCAN1.1 (UGGAGGAGGUGGAUCUGCAUUU) and RCAN1.4 (GAUGAUGUCUUCAGCGAAAUU) using Lipofectamine®RNAiMax reagent. 48 h after transfection, differentiation was initiated using MDI. The immortalized Ing‐svf preadipocyte cell line was derived by serial 3T3 passaging of plastic‐adherent inguinal WAT SVF cells of WT mice 87. PDGFRα+/Lin− adipose tissue stem cells were isolated from the SVF of WT and Rcan1‐KO animals by flow cytometry, then differentiated as previously described 88.
Glucose and insulin tolerance tests
For the glucose tolerance test (GTT), mice were fasted for 16 h then gavaged with 1 g/kg body weight glucose. For insulin tolerance test (ITT), mice were fasted for 3 h then injected interperitoneally with 1unit/kg body weight insulin. Mice had access to water ad libitum during this period. Blood was sampled from the tail. Serum glucose was measured using the glucose‐GO assay kit (Sigma‐Aldrich GAGO), and insulin was measured by ELISA (Sigma‐Aldrich RAB0817).
Fecal triglyceride and cholesterol
Feces were collected over the course of 3 days and stored at −20°C until extraction. Samples were homogenized with chloroform/methanol to extract lipids and cholesterol following standard procedures 89. Triglycerides and cholesterol were quantified using commercially available kits (BioVision K622 and K603) according to the manufacturer's instructions. Concentrations were determined based on a standard curve and expressed as mM/mg feces. Triglyceride and cholesterol were extracted from normal and HFD chow pellets for comparison.
Metabolic chambers and body composition
Whole‐body metabolic rates were assessed using CLAMS system metabolic chambers (Columbus Instruments) in the Mouse Metabolic Phenotyping Core Facility at University of Texas Southwestern Medical Center. Mice had free access to food and water and were allowed to adapt to the metabolic cage for 24 h prior to data collection. Body composition parameters were measured by NMR in a Bruker Minispec mq10 system. Magnetic resonance imaging analysis was carried out using ITK‐SNAP 90 with voxel spacing of 0.45 × 0.45 × 0.50. Visceral adipose and subcutaneous adipose tissues were manually segmented slice by slice on the basis of differences in signal intensity and location. Subcutaneous and visceral fat area was determined by total voxel area (mm3).
Histology
Adipose tissue was isolated and fixed in 4% paraformaldehyde (PFA) and processed for H&E staining. Anti‐UCP1 antibody (Fisher Scientific, PA1‐24894) at a dilution of 1:500 was used on fat pads fixed overnight in 10% formalin. Prior to Oil Red O staining of liver sections, tissues were fixed in 4% PFA overnight, incubated for 12 h in 12% sucrose, then overnight in 18% sucrose overnight before being cryoembedded and sectioned by the University of Texas Southwestern Medical Center Histology Core Facility. Adipocyte size and Oil Red O staining were quantified using ImageJ software (NIH, Bethesda, MD). For fiber‐type analysis, the gastrocnemius/plantaris skeletal muscle group was isolated from male animals at 12 weeks of age and embedded in a 3:1 ratio of Tissue Freezing Medium to gum tragacanth. Samples were flash‐frozen and sectioned on a cryostat‐microtome. Metachromatic ATPase fiber‐type staining was performed using standard Brooke & Kaiser histochemistry methods with CaCl2 and toluidine‐blue protocol variations according to Ogilvie & Feeback as previously described 40.
Silver‐stained high‐resolution glycerol gels
Total proteins including myosins were extracted from freshly frozen muscles in extraction buffer (0.3 M KCl, 0.1 M KH2PO4, 50 mM K2HPO4, 10 mM EDTA, pH 6.5) with the addition of cOmplete Protease Inhibitor Cocktail (Roche; Indianapolis, IN) as described previously 39, 91. The protein extracts were diluted 1:1 (v/v) with 60% glycerol, and 0.02 μg of protein was separated on an 8% polyacrylamide gel containing 30% glycerol. The gels were run at 4°C for 40 h at 70 V. Following electrophoresis, the gels were silver‐stained with Silver Stain Plus (Bio‐Rad).
Preparation of RNA and real‐time PCR
RNA was extracted from tissues using either an RNeasy Mini Kit (QIAGEN) or in TRIzol (Invitrogen) using a TissueLyser (Qiagen). First‐strand cDNA was synthesized using SuperScript III (Invitrogen). Real‐time PCR was carried out using SYBR Green on either a Roche 480 LightCycler or a RotorGene 3000 thermocycler. Transcript levels were normalized to 18S rRNA transcript levels, and changes in expression calculated using a 2−∆∆CT method. All samples were run in triplicate. Primer sequences and other information for all target genes are provided in Table 1.
Table 1.
PCR Primers
| Gene | Symbol | Forward primer | Reverse primer |
|---|---|---|---|
| Adrenoceptor beta 3 | Adrb3 | TGC GCA CCT TAG GTC TCA TTA | AAG GCG GAG TTG GCA TAG C |
| Fatty acid transporter | CD36 | GCC AAG CTA TTG CGA CAT GA | AAG GCA TTG GCT GGA AGA AC |
| Carnitine palmitoyltransferase I a | Cpt1a | GTG ACG TTG GAC GAA TCG GA | TCG GTG GCC ATG ACA TAC TC |
| Carnitine palmitoyltransferase I b | Cpt1b | TGT CAC TTC TGT CGC CAC CT | CAC CTC ATA ACG CTG GCT TC |
| Diacylglycerol O‐acyltransferase | Dgat | GTG GCC TTA CTGG TTGA GTC | CTG GAT AGC TCAC AGC TTGC |
| Deiodinase type II | Dio2 | CTT CCT CCT AGA TGC CTA CAA AC | CGA GGC ATA ATT GTT ACC TGA TTC |
| Macrophage antigen F4/80 | F480 | CTT TGG CTA TGG GCT TCC AGT C | GCA AGG AGG ACA GAG TTT ATC GTG |
| Facilitated glucose transporter | Glut4 | CCC CCG ATA CCT CTA CAT CAT C | GCA TCA GAC ACA TCA GCC CAG |
| Glycerol‐3‐phosphate acyltransferase | Gpat | GGA ATA CAG CCT TGG CCG AT | CTC TGT GGC GTG CAG GAA TA |
| Monocyte chemoattractant protein‐1 | Mcp‐1 | GGC TCA GCC AGA TGC AGT TAAC | GCC TAC TCA TTG GGA TCA TCT TG |
| Pyruvate dehydrogenase acetyl‐transferase | Pdk4 | TTC ACA CCT TCA CCA CAT GC | AAA GGG CGG TTT TCT TGA TG |
| Pparγ coactivator 1 alpha—total | Pgc1α | CGG AAA TCA TAT CCA ACC AG | TGA GAA CCG CTA GCA AGT TTG |
| Pparγ coactivator 1 alpha—1a | Pgc1α‐1a | GGG ACA TGT GC AGC CAA GA | AAG AGG CTG GTC CTC ACC AA |
| Pparγ coactivator 1 alpha—1b | Pgc1α‐1b | GAC ATG GAT GTT GGG ATT GTC A | ACC AAC CAG AGC AGC ACA TTT |
| Peroxisome proliferator‐activated gamma | Pparγ2 | GCA TCA GGC TTC CAC TAT GGA | AAG GCA CTT CTG AAA CCG ACA |
| PR domain containing 16 | Prdm16 | CTT CTC CGA GAT CCG AAA CTT C | GAT CTC AGG CCG TTT GTC CAT |
| Retinoblastoma 1 | Rb1 | CTG GCC TGT GCT CTT GAA GTT | CCA CGG GAA GGA CAA ATC TGT |
| Regulator of calcineurin 1—exon 1 | Rcan1.1 | TAG ATG GAG GAG GTG GAT CTG C | TCC TTG TCA TAT GTT CTG AAG AGG G |
| Regulator of calcineurin 1—exon 4 | Rcan1.4 | CCC GTG AAA AAG CAG AAT GC | TCC TTG TCA TAT GTT CCT GAA GAG GG |
| Stearoyl‐coenzyme A desaturase | Scd1 | GCC GAG AAG CTG GTG ATG TT | ATA GAG ATG CGC GGA ACT GT |
| Sarcolipin | Sln | GCT CCT CTT CAG GAA GTG AAG | TGG CCC CTC AGT ATT GGT AGG |
| Tumor necrosis factor‐alpha | Tnf‐α | GTA CCT TGT CTA CTC CCA GGT TCT CT | GTG TGG GTG AGG AGC ACG TA |
| Uncoupling protein 1 | Ucp1 | GCC AAA GTC CGC CTT CAG AT | TGAT TTG CCT CTG AAT GCC C |
| Zinc finger protein 423 | Zfp423 | CCC CCT GAT GGG AAT AAT GC | GCA ATG CGC CTG TTG GA |
Blood chemistry
Circulating levels of insulin, leptin, and adiponectin were measured by ELISA. Serum levels of nonesterified free fatty acids (FFA) were measured following a NEFA‐HR (2) assay protocol (Wako Diagnostics).
Western blot analysis
From tissue culture, total soluble protein extracts were isolated in M‐PER reagent (Thermo Fisher 78505) with protease and phosphatase inhibitors (Thermo Fisher 78442). Protein extracts from skeletal muscle, heart, and liver were isolated using RIPA buffer (150 mM NaCl, 50 mM Tris–HCl pH 7.4, 1% Triton X‐100, 0.5% Na deoxycholate, 0.1% SDS, 5 mM EDTA, 2 mM EGTA) plus protease and phosphatase inhibitors in a Dounce homogenizer. Lysates were cleared by centrifugation. To extract proteins from adipose (BAT, sWAT, and gWAT), tissues were homogenized in adipose tissue lysis buffer (50 mM HEPES, 150 mM NaCl, 10% glycerol, 1% Triton X‐100, pH 7.5, plus inhibitors), incubated on ice for 30 min, then centrifuged at 18,000 × g at 4°C for 20 min. The fat cake on top was discarded, and supernatant moved to a clean tube. Protein concentrations were measured using BCA (ThermoFisher 23225) and then run on standard 4–20% Tris‐gylcine SDS–PAGE. For detecting SLN in skeletal muscle, separate extracts were made by homogenizing in M‐PER reagent with inhibitors then measuring the protein concentration of the combined soluble and insoluble lysate. 4× SDS loading buffer (without EGTA) was added, and DNA was removed from the total protein extract by spinning through glass wool. Protein extracts were fractionated on 16% tricine–SDS–PAGE gels 92, then transferred to nitrocellulose. Polyclonal, rabbit anti‐SLN antibody (Millipore ABT13, Lot 2622046) 1:1,000 was followed by goat anti‐Rabbit fluorescent secondary (LI‐COR, P/N 925‐32211) and visualized using a LI‐COR Odyssey® imaging system. Densitometry analysis of relative protein levels on Western blots was performed using Image Studio Digits (Li‐COR). Other antibodies included the following: rabbit anti‐DSCR1 (Sigma D6694, 1:2,000), α‐tubulin (Santa Cruz sc‐5286, 1:1,000), adiponectin (Thermo Fisher MA1‐054, 1:1,000), and GAPDH (Fitzgerald 10R‐6109a, 1:1,000).
Lipolysis in adipose tissue explants
These experiments measured lipolysis as previously described 93. Modified Krebs‐Henseleit buffer was gassed for 40 min with 95%O2/5%CO2. Glucose (5 mM) and fatty acid‐free BSA (4%) were added to the buffer immediately before measurements. All experiments were conducted in a shaking water bath at 37°C. A sample (~30 mg) of sWAT, gWAT, or BAT was surgically removed and washed several times with saline and incubated in 500 μl buffer with ongoing gentle shaking in the absence (basal) or presence of 1 μM isoproterenol (a pan β‐adrenergic agonist). The medium was collected 2 h later for determination of glycerol using a commercially available kit (Wako Chemicals, Neuss, Germany; Sigma, St. Louis, MO).
Sln‐Luc construct and luciferase assays
The proximal promoter from the mouse Sln gene was cloned into the Nhe1 and BglII sites of the pGL3‐Basic luciferase reporter vector (Promega) using forward (ACGCGTGCTAGCTTCTAAGCCCCATTTAGC) and reverse (AAGCTTAGATCTCCGGCTGTCTGAGCTCCTGG) primers. Transfection of C2C12 myoblasts and luciferase assays were carried out as previously described 94 and normalized to a co‐transfected β‐galactosidase vector. Three independent transfections were assayed in duplicate.
Statistical analysis
GraphPad Prism software (GraphPad Software, San Diego, CA) was used for data analysis. A normal distribution was assumed, and variance was tested using Brown–Forsythe test. Statistical significance was tested using either a two‐way ANOVA with Tukey's multiple comparisons or an unpaired Student's t‐test as indicated in figure legends.
Sources for additional key reagents can be found in Table 2.
Table 2.
Sources for key resources
| Reagent or resource | Source | Identifier |
|---|---|---|
| Antibodies | ||
| Rabbit Anti‐Sarcolipin antibody | Millipore | Cat#ABT13, lot 2622046 |
| Rabbit Anti‐UCP1 antibody | Thermo Fisher | Cat#PA1‐24894 |
| Rabbit Anti‐DSCR1 antibody | Sigma | Cat#D6694 |
| Mouse Anti‐α Tubulin antibody (B‐7) | Santa Cruz | Cat#Sc‐5286 |
| Mouse Anti‐Adiponectin | Thermo Fisher | Cat#MA1‐054 |
| Mouse Anti‐GAPDH | Fitzgerald | Cat#10R‐G109a |
| IRDye 800CW Goat anti‐rabbit IgG | LI‐COR | Cat#P/N 925‐32211 |
| IRDye 680RD Goat anti‐mouse IgG | LI‐COR | Cat#P/N 925‐68070 |
| Chemicals, peptides, and recombinant proteins | ||
| SuperScript III First‐strand Synthesis SuperMix | Thermo Fisher | Cat#18080400 |
| TRIzol | Thermo Fisher | Cat#15596026 |
| LightCycler FastStart Master SYBR Green I | Roche | Cat#03003230001 |
| RNeasy Mini Kit | Qiagen | Cat#74104 |
| FuGENE HD | Promega | Cat#E2311 |
| Lipofectamine®RNAiMax | Thermo Fisher | Cat#13778030 |
| M‐PER Mammalian Protein Extraction Reagent | Thermo Fisher | Cat#78501 |
| Protease & Phosphatase inhibitor cocktail | Thermo Fisher | Cat#78442 |
| High Fat Diet (60% fat) | Research Diets | Cat#D12492 |
| Normal Chow Diet | LabDiet | Cat#5001 |
| Critical commercial assays | ||
| Glucose (GO) Assay Kit | Sigma‐Aldrich | Cat#GAGO |
| Mouse Ins1/Insulin‐1 ELISA kit | Sigma‐Aldrich | Cat#RAB0817 |
| Mouse Leptin ELISA Kit | Sigma‐Aldrich | Cat#RAB0334 |
| Mouse Adiponectin ELISA Kit | Sigma‐Aldrich | Cat#RAB1115 |
| Triglyceride Quantification Kit | BioVision | Cat#K622 |
| Total Cholesterol and Cholesteryl Ester Colorimetric/Fluorometric Assay Kit | BioVision | Cat#K603 |
| Nonesterified free fatty acid assay | Wako Diagnostics | HR series NEFA‐HR (2) |
| Experimental models: cell lines | ||
| C2C12 mouse myoblasts | ATCC | CRL‐1772 |
| 3T3‐L1 | ATCC | CL‐173 |
| Ing‐svf | This study | |
| Experimental models: organisms/strains | ||
| Rcan1‐KO (129SvJ:C57BL/6) | Vega et al 83 | |
| Rcan1‐KO (129SvJ:C57BL/6) | Porta et al 84 | |
| Oligonucleotides | ||
| Primers for RT–qPCR | IDT | See Table 1 |
| Forward primer for cloning pSln‐Luc ACGCGTGCTAGCTTCTAAGCCCCATTTAGC | IDT | |
| Reverse primer for cloning pSln‐Luc AAGCTTAGATCTCCGGCTGTCTGAGCTCCTGG | IDT | |
| siRNA targeting mouse Rcan1.1 UGGAGGAGGUGGAUCUGCAUUU | ON‐TARGETplus siRNA, Dharmacon | |
| siRNA targeting mouse Rcan1.4 GAUGAUGUCUUCAGCGAAAUU | ON‐TARGETplus siRNA, Dharmacon | |
| SMARTpool: ON‐TARGETplus Rcan1 siRNA | Dharmacon | L‐056697‐01‐0005 |
| Non‐targeting siRNA control Pool | Dharmacon | D‐001810‐10‐05 |
| Recombinant DNA | ||
| pSln‐Luc: sarcolipin luciferase reporter | This study | |
| pCnA*‐HA: constitutively active calcineurin‐HA‐Tag | Rothermel et al 10 | |
| pRCAN1.4‐HA: Rcan1.4 expression vector‐HA‐Tag | Rothermel et al 10 | |
| Software and algorithms | ||
| GraphPad Prism7 | GraphPad | http://www.graphpad.com/scientific-software/prism/ |
| Other | ||
| CLAMS system metabolic chambers | Columbus Instruments | http://www.touchstonediabetescenter.org/MetabolicCore/metabolic-cage.html |
| Bruker Minispec mq10—MRI | Bruker | http://www.touchstonediabetescenter.org/MetabolicCore/Bruker-NMR.html |
| ITK‐SNAP software application | Yushkevich et al 90 | |
| ImageJ software | NIH | https://imagej.nih.gov/ij/download.html |
Author contributions
Conceptualization: DR, HP, DJK, and BAR; Methodology: DBG, CFJ, BWP, AJL, DRM, MJW, RKG, and MAP; Investigation: DR, HP, DBG, AMM, JB, VP, CH, CRM, DM, BWP, NUNN, MO, II, TJ, DRM, RKG, and BAR; Writing—original draft: DR, HP, DJK, and BAR; Writing—review & editing: HAS, DRM, MAP, DJK, and BAR; Funding acquisition, HAS, RKG, DJK, and BAR.
Conflict of interest
The authors declare that they have no conflict of interest.
Supporting information
Expanded View Figures PDF
Review Process File
Acknowledgements
This work was supported by funding from the National Institutes of Health (HL072016, HL102478, 1U54HD087351, DK104789), American Heart Association (11POST7950051, 13POST16520009), Australian National Health and Medical Research Council (APP1088737), National Fund for Scientific and Technological Development in Chile (FONDECYT 11150282 and PAI 79150007), and the Diabetes Australia Research Trust (Y16G‐KEAD).
EMBO Reports (2018) 19: e44706
Contributor Information
Damien J Keating, Email: damien.keating@flinders.edu.au.
Beverly A Rothermel, Email: beverly.rothermel@utsouthwestern.edu.
References
- 1. Bouret S, Levin BE, Ozanne SE (2014) Gene‐environment interactions controlling energy and glucose homeostasis and the developmental origins of obesity. Physiol Rev 95: 47–82 [DOI] [PMC free article] [PubMed] [Google Scholar]
- 2. Harms M, Seale P (2013) Brown and beige fat: development, function and therapeutic potential. Nat Med 19: 1252–1263 [DOI] [PubMed] [Google Scholar]
- 3. Rolfe DF, Brown GC (1997) Cellular energy utilization and molecular origin of standard metabolic rate in mammals. Physiol Rev 77: 731–758 [DOI] [PubMed] [Google Scholar]
- 4. Shaikh SA, Sahoo SK, Periasamy M (2016) Phospholamban and sarcolipin: are they functionally redundant or distinct regulators of the sarco(endo)plasmic reticulum calcium ATPase? J Mol Cell Cardiol 91: 81–91 [DOI] [PMC free article] [PubMed] [Google Scholar]
- 5. Bal NC, Maurya SK, Sopariwala DH, Sahoo SK, Gupta SC, Shaikh SA, Pant M, Rowland LA, Goonasekera SA, Molkentin JD et al (2012) Sarcolipin is a newly identified regulator of muscle‐based thermogenesis in mammals. Nat Med 18: 1575–1579 [DOI] [PMC free article] [PubMed] [Google Scholar]
- 6. Gamu D, Trinh A, Bombardier E, Tupling AR (2015) Persistence of diet‐induced obesity despite access to voluntary activity in mice lacking sarcolipin. Physiol Rep 3: e12549 [DOI] [PMC free article] [PubMed] [Google Scholar]
- 7. Maurya SK, Periasamy M (2015) Sarcolipin is a novel regulator of muscle metabolism and obesity. Pharmacol Res 102: 270–275 [DOI] [PMC free article] [PubMed] [Google Scholar]
- 8. Rowland LA, Bal NC, Kozak LP, Periasamy M (2015) Uncoupling protein 1 and sarcolipin are required to maintain optimal thermogenesis, and loss of both systems compromises survival of mice under cold stress. J Biol Chem 290: 12282–12289 [DOI] [PMC free article] [PubMed] [Google Scholar]
- 9. Fuentes JJ, Genescà L, Kingsbury TJ, Cunningham KW, Pérez‐Riba M, Estivill X, la Luna de S (2000) DSCR1, overexpressed in Down syndrome, is an inhibitor of calcineurin‐mediated signaling pathways. Hum Mol Genet 9: 1681–1690 [DOI] [PubMed] [Google Scholar]
- 10. Rothermel B, Vega RB, Yang J, Wu H, Bassel‐Duby R, Williams RS (2000) A protein encoded within the Down syndrome critical region is enriched in striated muscles and inhibits calcineurin signaling. J Biol Chem 275: 8719–8725 [DOI] [PubMed] [Google Scholar]
- 11. Heisel O, Heisel R, Balshaw R, Keown P (2004) New onset diabetes mellitus in patients receiving calcineurin inhibitors: a systematic review and meta‐analysis. Am J Transplant 4: 583–595 [DOI] [PubMed] [Google Scholar]
- 12. López‐Vilella R, Sánchez‐Lázaro IJ, Martínez‐Dolz L, Almenar‐Bonet L, Marqués‐Sulé E, Melero‐Ferrer J, Portolés‐Sanz M, Rivera‐Otero M, Domingo‐Valero D, Montero‐Argudo A (2015) Incidence of development of obesity after heart transplantation according to the calcineurin inhibitor. Transplant Proc 47: 127–129 [DOI] [PubMed] [Google Scholar]
- 13. Ramos EM, Hoffman D, Junkins HA, Maglott D, Phan L, Sherry ST, Feolo M, Hindorff LA (2013) Phenotype‐genotype integrator (PheGenI): synthesizing genome‐wide association study (GWAS) data with existing genomic resources. Eur J Hum Genet 22: 144–147 [DOI] [PMC free article] [PubMed] [Google Scholar]
- 14. Yang TTC, Suk HY, Yang X, Olabisi O, Yu RYL, Durand J, Jelicks LA, Kim J‐Y, Scherer PE, Wang Y et al (2006) Role of transcription factor NFAT in glucose and insulin homeostasis. Mol Cell Biol 26: 7372–7387 [DOI] [PMC free article] [PubMed] [Google Scholar]
- 15. Soleimanpour SA, Crutchlow MF, Ferrari AM, Raum JC, Lu T, Rankin MM, Liu C, De León DD, Naji A, Kushner JA et al (2010) Calcineurin signaling regulates human islet {beta}‐cell survival. J Biol Chem 285: 40050–40059 [DOI] [PMC free article] [PubMed] [Google Scholar]
- 16. Lawrence MC, Bhatt HS, Easom RA (2002) NFAT regulates insulin gene promoter activity in response to synergistic pathways induced by glucose and glucagon‐like peptide‐1. Diabetes 51: 691–698 [DOI] [PubMed] [Google Scholar]
- 17. Chen Y, Sampaio MS, Yang JW, Min D, Hutchinson IV (2012) Genetic polymorphisms of the transcription factor NFATc4 and development of new‐onset diabetes after transplantation in Hispanic kidney transplant recipients. Transplantation 93: 325–330 [DOI] [PubMed] [Google Scholar]
- 18. Altarejos JY, Montminy M (2011) CREB and the CRTC co‐activators: sensors for hormonal and metabolic signals. Nat Rev Mol Cell Biol 12: 141–151 [DOI] [PMC free article] [PubMed] [Google Scholar]
- 19. Choong E (2013) Influence of CRTC1 polymorphisms on body mass index and fat mass in psychiatric patients and the general adult population. JAMA Psychiatry 70: 1011 [DOI] [PubMed] [Google Scholar]
- 20. Quteineh L, Bochud P‐Y, Golshayan D, Crettol S, Venetz J‐P, Manuel O, Kutalik Z, Treyer A, Lehmann R, Mueller NJ et al (2015) CRTC2 polymorphism as a risk factor for the incidence of metabolic syndrome in patients with solid organ transplantation. Pharmacogenomics J 17: 69–75 [DOI] [PubMed] [Google Scholar]
- 21. Song Y, Altarejos J, Goodarzi MO, Inoue H, Guo X, Berdeaux R, Kim J‐H, Goode J, Igata M, Paz JC et al (2010) CRTC3 links catecholamine signalling to energy balance. Nature 468: 933–939 [DOI] [PMC free article] [PubMed] [Google Scholar]
- 22. Ou Z, Wang G, Li Q, Ma Z, Dai M, Zou F (2014) CRTC3 polymorphisms were associated with the plasma level of total cholesterol and the risks of overweight and hypertriglyceridemia in a Chinese Han population. Mol Biol Rep 41: 125–130 [DOI] [PubMed] [Google Scholar]
- 23. Davies KJA, Ermak G, Rothermel BA, Pritchard M, Heitman J, Ahnn J, Henrique‐Silva F, Crawford D, Canaider S, Strippoli P et al (2007) Renaming the DSCR1/Adapt78 gene family as RCAN: regulators of calcineurin. FASEB J 21: 3023–3028 [DOI] [PubMed] [Google Scholar]
- 24. Fuentes JJ, Pritchard MA, Estivill X (1997) Genomic organization, alternative splicing, and expression patterns of the DSCR1 (Down syndrome candidate region 1) gene. Genomics 44: 358–361 [DOI] [PubMed] [Google Scholar]
- 25. Yang J, Rothermel B, Vega RB, Frey N, McKinsey TA, Olson EN, Bassel‐Duby R, Williams RS (2000) Independent signals control expression of the calcineurin inhibitory proteins MCIP1 and MCIP2 in striated muscles. Circ Res 87: E61–E68 [DOI] [PubMed] [Google Scholar]
- 26. Peiris H, Raghupathi R, Jessup CF, Zanin MP, Mohanasundaram D, Mackenzie KD, Chataway T, Clarke JN, Brealey J, Coates PT et al (2012) Increased expression of the glucose‐responsive gene, RCAN1, causes hypoinsulinemia, β‐cell dysfunction, and diabetes. Endocrinology 153: 5212–5221 [DOI] [PubMed] [Google Scholar]
- 27. Peiris H, Duffield MD, Fadista J, Jessup CF, Kashmir V, Genders AJ, McGee SL, Martin AM, Saiedi M, Morton N et al (2016) A syntenic cross species aneuploidy genetic screen links RCAN1 expression to β‐cell mitochondrial dysfunction in type 2 diabetes. PLoS Genet 12: e1006033 [DOI] [PMC free article] [PubMed] [Google Scholar]
- 28. Hancock AM, Witonsky DB, Gordon AS, Eshel G, Pritchard JK, Coop G, Di Rienzo A (2008) Adaptations to climate in candidate genes for common metabolic disorders. PLoS Genet 4: e32 [DOI] [PMC free article] [PubMed] [Google Scholar]
- 29. Dodson MV, Hausman GJ, Guan L, Du M, Rasmussen TP, Poulos SP, Mir P, Bergen WG, Fernyhough ME, McFarland DC et al (2010) Lipid metabolism, adipocyte depot physiology and utilization of meat animals as experimental models for metabolic research. Int J Biol Sci 6: 691–699 [DOI] [PMC free article] [PubMed] [Google Scholar]
- 30. Park J, Oh Y, Chung KC (2009) Two key genes closely implicated with the neuropathological characteristics in Down syndrome: DYRK1A and RCAN1. BMB Rep 42: 6–15 [DOI] [PubMed] [Google Scholar]
- 31. Yahia S, El‐Farahaty RM, El‐Hawary AK, El‐Hussiny MA, Abdel‐Maseih H, El‐Dahtory F, El‐Gilany A‐H (2012) Leptin, insulin and thyroid hormones in a cohort of Egyptian obese Down syndrome children: a comparative study. BMC Endocr Disord 12: 22 [DOI] [PMC free article] [PubMed] [Google Scholar]
- 32. Shoelson SE, Lee J, Goldfine AB (2006) Inflammation and insulin resistance. J Clin Invest 116: 1793–1801 [DOI] [PMC free article] [PubMed] [Google Scholar]
- 33. Puigserver P, Wu Z, Park CW, Graves R, Wright M, Spiegelman BM (1998) A cold‐inducible coactivator of nuclear receptors linked to adaptive thermogenesis. Cell 92: 829–839 [DOI] [PubMed] [Google Scholar]
- 34. Yoshioka T, Inagaki K, Noguchi T, Sakai M, Ogawa W, Hosooka T, Iguchi H, Watanabe E, Matsuki Y, Hiramatsu R et al (2009) Identification and characterization of an alternative promoter of the human PGC‐1alpha gene. Biochem Biophys Res Commun 381: 537–543 [DOI] [PubMed] [Google Scholar]
- 35. Martinez‐Redondo V, Pettersson AT, Ruas JL (2015) The hitchhiker's guide to PGC‐1α isoform structure and biological functions. Diabetologia 58: 1969–1977 [DOI] [PubMed] [Google Scholar]
- 36. Chang JS, Fernand V, Zhang Y, Shin J, Jun H‐J, Joshi Y, Gettys TW (2012) NT‐PGC‐1α protein is sufficient to link β3‐adrenergic receptor activation to transcriptional and physiological components of adaptive thermogenesis. J Biol Chem 287: 9100–9111 [DOI] [PMC free article] [PubMed] [Google Scholar]
- 37. Wu Z, Huang X, Feng Y, Handschin C, Feng Y, Gullicksen PS, Bare O, Labow M, Spiegelman B, Stevenson SC (2006) Transducer of regulated CREB‐binding proteins (TORCs) induce PGC‐1alpha transcription and mitochondrial biogenesis in muscle cells. Proc Natl Acad Sci USA 103: 14379–14384 [DOI] [PMC free article] [PubMed] [Google Scholar]
- 38. Smith IC, Bombardier E, Vigna C, Tupling AR (2013) ATP consumption by sarcoplasmic reticulum Ca2+ pumps accounts for 40–50% of resting metabolic rate in mouse fast and slow twitch skeletal muscle. PLoS ONE 8: e68924 [DOI] [PMC free article] [PubMed] [Google Scholar]
- 39. Oh M, Rybkin II, Copeland V, Czubryt MP, Shelton JM, van Rooij E, Richardson JA, Hill JA, De Windt LJ, Bassel‐Duby R et al (2005) Calcineurin is necessary for the maintenance but not embryonic development of slow muscle fibers. Mol Cell Biol 25: 6629–6638 [DOI] [PMC free article] [PubMed] [Google Scholar]
- 40. Ogilvie RW, Feeback DL (1990) A metachromatic dye‐ATPase method for the simultaneous identification of skeletal muscle fiber types I, IIA, IIB and IIC. Stain Technol 65: 231–241 [DOI] [PubMed] [Google Scholar]
- 41. Talmadge RJ, Roy RR (1993) Electrophoretic separation of rat skeletal muscle myosin heavy‐chain isoforms. J Appl Physiol 75: 2337–2340 [DOI] [PubMed] [Google Scholar]
- 42. Babu GJ, Bhupathy P, Carnes CA, Billman GE, Periasamy M (2007) Differential expression of sarcolipin protein during muscle development and cardiac pathophysiology. J Mol Cell Cardiol 43: 215–222 [DOI] [PMC free article] [PubMed] [Google Scholar]
- 43. Parks BW, Sallam T, Mehrabian M, Psychogios N, Hui ST, Norheim F, Castellani LW, Rau CD, Pan C, Phun J et al (2015) Genetic architecture of insulin resistance in the mouse. Cell Metab 21: 334–346 [DOI] [PMC free article] [PubMed] [Google Scholar]
- 44. Keller MP, Choi Y, Wang P, Davis DB, Rabaglia ME, Oler AT, Stapleton DS, Argmann C, Schueler KL, Edwards S et al (2008) A gene expression network model of type 2 diabetes links cell cycle regulation in islets with diabetes susceptibility. Genome Res 18: 706–716 [DOI] [PMC free article] [PubMed] [Google Scholar]
- 45. Peeters A, Barendregt JJ, Willekens F, Mackenbach JP, Mamun Al A, Bonneux L, NEDCOM, the Netherlands Epidemiology and Demography Compression of Morbidity Research Group (2003) Obesity in adulthood and its consequences for life expectancy: a life‐table analysis. Ann Intern Med 138: 24–32 [DOI] [PubMed] [Google Scholar]
- 46. Enerbäck S, Jacobsson A, Simpson EM, Guerra C, Yamashita H, Harper ME, Kozak LP (1997) Mice lacking mitochondrial uncoupling protein are cold‐sensitive but not obese. Nature 387: 90–94 [DOI] [PubMed] [Google Scholar]
- 47. Ukropec J, Anunciado RP, Ravussin Y, Hulver MW, Kozak LP (2006) UCP1‐independent thermogenesis in white adipose tissue of cold‐acclimated Ucp1‐/‐ mice. J Biol Chem 281: 31894–31908 [DOI] [PubMed] [Google Scholar]
- 48. Bal NC, Maurya SK, Singh S, Wehrens XHT, Periasamy M (2016) Increased reliance on muscle‐based thermogenesis upon acute minimization of brown adipose tissue function. J Biol Chem 291: 17247–17257 [DOI] [PMC free article] [PubMed] [Google Scholar]
- 49. Betz MJ, Enerbäck S (2015) Human brown adipose tissue: what we have learned so far. Diabetes 64: 2352–2360 [DOI] [PubMed] [Google Scholar]
- 50. Cypess AM, Lehman S, Williams G, Tal I, Rodman D, Goldfine AB, Kuo FC, Palmer EL, Tseng Y‐H, Doria A et al (2009) Identification and importance of brown adipose tissue in adult humans. N Engl J Med 360: 1509–1517 [DOI] [PMC free article] [PubMed] [Google Scholar]
- 51. Lidell ME, Betz MJ, Dahlqvist Leinhard O, Heglind M, Elander L, Slawik M, Mussack T, Nilsson D, Romu T, Nuutila P et al (2013) Evidence for two types of brown adipose tissue in humans. Nat Med 19: 631–634 [DOI] [PubMed] [Google Scholar]
- 52. Lin J, Wu P‐H, Tarr PT, Lindenberg KS, St‐Pierre J, Zhang C‐Y, Mootha VK, Jäger S, Vianna CR, Reznick RM et al (2004) Defects in adaptive energy metabolism with CNS‐linked hyperactivity in PGC‐1alpha null mice. Cell 119: 121–135 [DOI] [PubMed] [Google Scholar]
- 53. Shan T, Xiong Y, Zhang P, Li Z, Jiang Q, Bi P, Yue F, Yang G, Wang Y, Liu X et al (2016) Lkb1 controls brown adipose tissue growth and thermogenesis by regulating the intracellular localization of CRTC3. Nat Commun 7: 1–11 [DOI] [PMC free article] [PubMed] [Google Scholar]
- 54. Nixon M, Stewart‐Fitzgibbon R, Fu J, Akhmedov D, Rajendran K, Mendoza‐Rodriguez MG, Rivera‐Molina YA, Gibson M, Berglund ED, Justice NJ et al (2016) Skeletal muscle salt inducible kinase 1 promotes insulin resistance in obesity. Mol Metab 5: 34–46 [DOI] [PMC free article] [PubMed] [Google Scholar]
- 55. Chin ER, Olson EN, Richardson JA, Yang Q, Humphries C, Shelton JM, Wu H, Zhu W, Bassel‐Duby R, Williams RS (1998) A calcineurin‐dependent transcriptional pathway controls skeletal muscle fiber type. Genes Dev 12: 2499–2509 [DOI] [PMC free article] [PubMed] [Google Scholar]
- 56. Odermatt A, Taschner PE, Scherer SW, Beatty B, Khanna VK, Cornblath DR, Chaudhry V, Yee WC, Schrank B, Karpati G et al (1997) Characterization of the gene encoding human sarcolipin (SLN), a proteolipid associated with SERCA1: absence of structural mutations in five patients with Brody disease. Genomics 45: 541–553 [DOI] [PubMed] [Google Scholar]
- 57. Maurya SK, Bal NC, Sopariwala DH, Pant M, Rowland LA, Shaikh SA, Periasamy M (2015) Sarcolipin is a key determinant of the basal metabolic rate, and its overexpression enhances energy expenditure and resistance against diet‐induced obesity. J Biol Chem 290: 10840–10849 [DOI] [PMC free article] [PubMed] [Google Scholar]
- 58. Tavi P, Westerblad H (2011) The role of in vivo Ca²⁺ signals acting on Ca²⁺‐calmodulin‐dependent proteins for skeletal muscle plasticity. J Physiol 589: 5021–5031 [DOI] [PMC free article] [PubMed] [Google Scholar]
- 59. Heit JJ, Apelqvist AA, Gu X, Winslow MM, Neilson JR, Crabtree GR, Kim SK (2006) Calcineurin/NFAT signalling regulates pancreatic beta‐cell growth and function. Nature 443: 345–349 [DOI] [PubMed] [Google Scholar]
- 60. Keating DJ, Dubach D, Zanin MP, Yu Y, Martin K, Zhao Y‐F, Chen C, Porta S, Arbonés ML, Mittaz L et al (2008) DSCR1/RCAN1 regulates vesicle exocytosis and fusion pore kinetics: implications for Down syndrome and Alzheimer's disease. Hum Mol Genet 17: 1020–1030 [DOI] [PubMed] [Google Scholar]
- 61. Zanin MP, Mackenzie KD, Peiris H, Pritchard MA, Keating DJ (2013) RCAN1 regulates vesicle recycling and quantal release kinetics via effects on calcineurin activity. J Neurochem 124: 290–299 [DOI] [PubMed] [Google Scholar]
- 62. Gurda GT, Crozier SJ, Ji B, Ernst SA, Logsdon CD, Rothermel BA, Williams JA (2010) Regulator of calcineurin 1 controls growth plasticity of adult pancreas. Gastroenterology 139: 609–619.e6 [DOI] [PMC free article] [PubMed] [Google Scholar]
- 63. Valdor R, Mocholi E, Botbol Y, Guerrero‐Ros I, Chandra D, Koga H, Gravekamp C, Cuervo AM, Macian F (2014) Chaperone‐mediated autophagy regulates T cell responses through targeted degradation of negative regulators of T cell activation. Nat Immunol 15: 1046–1054 [DOI] [PMC free article] [PubMed] [Google Scholar]
- 64. Bhoiwala DL, Kannabiran V, Hushmendy SF, Hahn A, Bhoiwala DL, Heuring JM, Crawford DR (2011) The calcineurin inhibitor RCAN1 is involved in cultured macrophage and in vivo immune response. FEMS Immunol Med Microbiol 61: 103–113 [DOI] [PubMed] [Google Scholar]
- 65. Lei Q‐Q, Hu G‐Q, Chen W, Yu S‐X, Qi S, Du C‐T, Gu J‐M, Lin T‐J, Yang Y‐J (2016) Molecular immunology. Mol Immunol 77: 26–33 [DOI] [PubMed] [Google Scholar]
- 66. Wu Z, Li Y, MacNeil AJ, Junkins RD, Berman JN, Lin TJ (2013) Calcineurin‐Rcan1 interaction contributes to stem cell factor‐mediated mast cell activation. J Immunol 191: 5885–5894 [DOI] [PubMed] [Google Scholar]
- 67. Kim YS, Cho K‐O, Lee HJ, Kim SY, Sato Y, Cho Y‐J (2006) Down syndrome candidate region 1 increases the stability of the IkappaBalpha protein: implications for its anti‐inflammatory effects. J Biol Chem 281: 39051–39061 [DOI] [PubMed] [Google Scholar]
- 68. Junkins RD, MacNeil AJ, Wu Z, McCormick C, Lin TJ (2013) Regulator of calcineurin 1 suppresses inflammation during respiratory tract infections. J Immunol 190: 5178–5186 [DOI] [PubMed] [Google Scholar]
- 69. García‐Redondo AB, Esteban V, Briones AM, del Campo LSD, González‐Amor M, Méndez‐Barbero N, Campanero MR, Redondo JM, Salaices M (2018) Regulator of calcineurin 1 modulates vascular contractility and stiffness through the upregulation of COX‐2‐derived prostanoids. Pharmacol Res 133: 236–249 [DOI] [PubMed] [Google Scholar]
- 70. Avogaro A, Albiero M, Menegazzo L, de Kreutzenberg S, Fadini GP (2011) Endothelial dysfunction in diabetes: the role of reparatory mechanisms. Diabetes Care 34: S285–S290 [DOI] [PMC free article] [PubMed] [Google Scholar]
- 71. Ballesteros‐Martinez C, Méndez‐Barbero N, Montalvo‐Yuste A, Jensen BM, Gomez‐Cardenosa A, Klitfod L, Garrido‐Arandia M, Alvarez‐Llamas G, Pastor‐Vargas C, Vivanco F et al (2017) Endothelial regulator of calcineurin 1 promotes barrier integrity and modulates histamine‐induced barrier dysfunction in anaphylaxis. Front Immunol 8: 1323 [DOI] [PMC free article] [PubMed] [Google Scholar]
- 72. Dyar KA, Ciciliot S, Tagliazucchi GM, Pallafacchina G, Tothova J, Argentini C, Agatea L, Abraham R, Ahdesmäki M, Forcato M et al (2015) The calcineurin‐NFAT pathway controls activity‐dependent circadian gene expression in slow skeletal muscle. Mol Metab 4: 823–833 [DOI] [PMC free article] [PubMed] [Google Scholar]
- 73. Sachan N, Dey A, Rotter D, Grinsfelder DB, Battiprolu PK, Sikder D, Copeland V, Oh M, Bush E, Shelton JM et al (2011) Sustained hemodynamic stress disrupts normal circadian rhythms in calcineurin‐dependent signaling and protein phosphorylation in the heart. Circ Res 108: 437–445 [DOI] [PMC free article] [PubMed] [Google Scholar]
- 74. Rotter D, Grinsfelder DB, Parra V, Pedrozo Z, Singh S, Sachan N, Rothermel BA (2014) Calcineurin and its regulator, RCAN1, confer time‐of‐day changes in susceptibility of the heart to ischemia/reperfusion. J Mol Cell Cardiol 74C: 103–111 [DOI] [PMC free article] [PubMed] [Google Scholar]
- 75. Vermillion KL, Anderson KJ, Hampton M, Andrews MT (2015) Gene expression changes controlling distinct adaptations in the heart and skeletal muscle of a hibernating mammal. Physiol Genomics 47: 58–74 [DOI] [PMC free article] [PubMed] [Google Scholar]
- 76. Ding L‐C, Gong Q‐Q, Li S‐W, Fu X‐L, Jin Y‐C, Zhang J, Gao J‐G, Sun X‐Y (2017) Rcan2 and estradiol independently regulate body weight in female mice. Oncotarget 8: 48098–48109 [DOI] [PMC free article] [PubMed] [Google Scholar]
- 77. Sun X‐Y, Hayashi Y, Xu S, Kanou Y, Takagishi Y, Tang Y‐P, Murata Y (2011) Inactivation of the Rcan2 gene in mice ameliorates the age‐ and diet‐induced obesity by causing a reduction in food intake. PLoS ONE 6: e14605 [DOI] [PMC free article] [PubMed] [Google Scholar]
- 78. Parra V, Altamirano F, Hernández‐Fuentes CP, Tong D, Kyrychenko V, Rotter D, Pedrozo Z, Hill JA, Eisner V, Lavandero S et al (2018) Down syndrome critical region 1 gene, Rcan1, helps maintain a more fused mitochondrial network. Circ Res 122: e20–e33 [DOI] [PMC free article] [PubMed] [Google Scholar]
- 79. Pisani DF, Barquissau V, Chambard J‐C, Beuzelin D, Ghandour RA, Giroud M, Mairal A, Pagnotta S, Cinti S, Langin D et al (2018) Mitochondrial fission is associated with UCP1 activity in human brite/beige adipocytes. Mol Metab 7: 35–44 [DOI] [PMC free article] [PubMed] [Google Scholar]
- 80. Basil JS, Santoro SL, Martin LJ, Healy KW, Chini BA, Saal HM (2016) Retrospective study of obesity in children with Down syndrome. J Pediatr 173: 143–148 [DOI] [PubMed] [Google Scholar]
- 81. Flore P, Bricout V‐A, van Biesen D, Guinot M, Laporte F, Pépin J‐L, Eberhard Y, Favre‐Juvin A, Wuyam B, van de Vliet P et al (2008) Oxidative stress and metabolism at rest and during exercise in persons with Down syndrome. Eur J Cardiovasc Prev Rehabil 15: 35–42 [DOI] [PubMed] [Google Scholar]
- 82. Hill DL, Parks EP, Zemel BS, Shults J, Stallings VA, Stettler N (2013) Resting energy expenditure and adiposity accretion among children with Down syndrome: a 3‐year prospective study. Eur J Clin Nutr 67: 1087–1091 [DOI] [PMC free article] [PubMed] [Google Scholar]
- 83. Vega RB, Rothermel BA, Weinheimer CJ, Kovacs A, Naseem RH, Bassel‐Duby R, Williams RS, Olson EN (2003) Dual roles of modulatory calcineurin‐interacting protein 1 in cardiac hypertrophy. Proc Natl Acad Sci USA 100: 669–674 [DOI] [PMC free article] [PubMed] [Google Scholar]
- 84. Porta S, Serra SA, Huch M, Valverde MA, Llorens F, Estivill X, Arbonés ML, Martí E (2007) RCAN1 (DSCR1) increases neuronal susceptibility to oxidative stress: a potential pathogenic process in neurodegeneration. Hum Mol Genet 16: 1039–1050 [DOI] [PubMed] [Google Scholar]
- 85. Nicholson A, Reifsnyder PC, Malcolm RD, Lucas CA, MacGregor GR, Zhang W, Leiter EH (2009) Diet‐induced obesity in Two C57BL/6 substrains with intact or mutant nicotinamide nucleotide transhydrogenase (Nnt) gene. Obesity 18: 1902–1905 [DOI] [PMC free article] [PubMed] [Google Scholar]
- 86. Parker N, Vidal‐Puig AJ, Azzu V, Brand MD (2009) Dysregulation of glucose homeostasis in nicotinamide nucleotide transhydrogenase knockout mice is independent of uncoupling protein 2. Biochim Biophys Acta 1787: 1451–1457 [DOI] [PMC free article] [PubMed] [Google Scholar]
- 87. Todaro GJ, Green H (1963) Quantitative studies of the growth of mouse embryo cells in culture and their development into established lines. J Cell Biol 17: 299–313 [DOI] [PMC free article] [PubMed] [Google Scholar]
- 88. Vishvanath L, MacPherson KA, Hepler C, Wang QA, Shao M, Spurgin SB, Wang MY, Kusminski CM, Morley TS, Gupta RK (2016) Mural preadipocytes contribute to adipocyte hyperplasia induced by high‐fat‐diet feeding and prolonged cold exposure in adult mice. Cell Metab 23: 350–359 [DOI] [PMC free article] [PubMed] [Google Scholar]
- 89. Folch J, Lees M, Sloane Stanley GH (1957) A simple method for the isolation and purification of total lipides from animal tissues. J Biol Chem 226: 497–509 [PubMed] [Google Scholar]
- 90. Yushkevich PA, Piven J, Hazlett HC, Smith RG, Ho S, Gee JC, Gerig G (2006) User‐guided 3D active contour segmentation of anatomical structures: significantly improved efficiency and reliability. NeuroImage 31: 1116–1128 [DOI] [PubMed] [Google Scholar]
- 91. Agbulut O, Noirez P, Beaumont F, Butler‐Browne G (2012) Myosin heavy chain isoforms in postnatal muscle development of mice. Biol Cell 95: 399–406 [DOI] [PubMed] [Google Scholar]
- 92. Schägger H (2006) Tricine‐SDS‐PAGE. Nat Protoc 1: 16–22 [DOI] [PubMed] [Google Scholar]
- 93. Stefanidis A, Watt MJ, Cowley MA, Oldfield BJ (2017) Prevention of the adverse effects of olanzapine on lipid metabolism with the antiepileptic zonisamide. Neuropharmacology 123: 55–66 [DOI] [PubMed] [Google Scholar]
- 94. Oh M, Dey A, Gerard RD, Hill JA, Rothermel BA (2010) The CCAAT/enhancer binding protein beta (C/EBPbeta) cooperates with NFAT to control expression of the calcineurin regulatory protein RCAN1‐4. J Biol Chem 285: 16623–16631 [DOI] [PMC free article] [PubMed] [Google Scholar]
Associated Data
This section collects any data citations, data availability statements, or supplementary materials included in this article.
Supplementary Materials
Expanded View Figures PDF
Review Process File