

Abstract
Studies of antagonistic coevolution between hosts and parasites typically focus on resistance and infectivity traits. However, coevolution could also have genome-wide effects on the hosts due to pleiotropy, epistasis, or selection for evolvability. Here, we investigate these effects in the bacterium Pseudomonas fluorescens SBW25 during approximately 400 generations of evolution in the presence or absence of bacteriophage (coevolution or evolution treatments, respectively). Coevolution resulted in variable phage resistance, lower competitive fitness in the absence of phages, and greater genome-wide divergence both from the ancestor and between replicates, in part due to the evolution of increased mutation rates. Hosts from coevolution and evolution treatments had different suites of mutations. A high proportion of mutations observed in coevolved hosts were associated with a known phage target binding site, the lipopolysaccharide (LPS), and correlated with altered LPS length and phage resistance. Mutations in evolved bacteria were correlated with higher fitness in the absence of phages. However, the benefits of these growth-promoting mutations were completely lost when these bacteria were subsequently coevolved with phages, indicating that they were not beneficial in the presence of resistance mutations (consistent with negative epistasis). Our results show that in addition to affecting genome-wide evolution in loci not obviously linked to parasite resistance, coevolution can also constrain the acquisition of mutations beneficial for growth in the abiotic environment.
Keywords: experimental evolution, antagonistic coevolution, bacteria, bacteriophage, molecular evolution
Introduction
Parasites are abundant in all natural ecosystems and play a central role in the evolution and ecology of their hosts (Woolhouse et al. 2002). Moreover, antagonistic coevolution (defined as the reciprocal evolution of host resistance and parasite infectivity) is recognized as a key driver of genetic divergence between populations of coevolving hosts and parasites, and by extension, antagonistic coevolution is considered a crucial factor in the origin and maintenance of biodiversity (Buckling and Rainey 2002; Thompson 2005). Host–parasite coevolution between bacteria and their lytic viral parasites, bacteriophages, is studied extensively to understand the cause and consequence of coevolution, as coevolution can be observed over a matter of days and weeks (Bohannan and Lenski 2000). However, in addition to their utility for research, using bacteria and bacteriophage to study coevolution also has important implications for our understanding of the ecology and evolution of microbial populations, the role of phage in the evolution of bacterial virulence, and the use of phage in clinical settings (Pirnay et al. 2011; Scanlan and Buckling 2012; Hosseinidoust et al. 2013; Koskella and Brockhurst 2014).
Coevolution with bacteriophages has many important phenotypic consequences for bacteria, including costs of resistance (Bohannan and Lenski 2000), effects on diversity and niche competition in spatially structured environments (Buckling and Rainey 2002; Brockhurst et al. 2004), the social behavior of hosts (Morgan et al. 2012), and evolution of mutation rates (Pal et al. 2007). However, little is known about the genomic consequences of bacterial coevolution with phages. Although there have been a number of studies using whole-genome sequencing (WGS) of coevolved bacteria (Kashiwagi and Yomo 2011; Marston et al. 2012; Le et al. 2014), interpreting the underlying genomic changes is problematic as populations are also adapting to the abiotic environment. An understanding of the genomic consequences of coevolution therefore requires a systematic comparison of evolved and coevolved bacterial populations, which is the aim of this study. Such an experimental approach has been successful in studying the effects of coevolution on virus populations and has revealed that coevolution accelerates molecular evolution in traits linked to infectivity (Paterson et al. 2010; Kashiwagi and Yomo 2011); however, a similar comparison has yet to be conducted on bacteria.
Nonetheless, previous theoretical and empirical studies allow us to make general predictions on the potential genomic effects of coevolution with phage. First, we expect greater genomic divergence of hosts among replicates and from the ancestor in coevolving populations. This is because coevolution creates a continually changing selection pressure by generating parasites with novel infectivity alleles and can also select for mechanisms that generate genetic variation, that is, elevated mutation rates and recombination (Hamilton et al. 1990; Pal et al. 2007). This prediction is further supported by work on coevolving/evolving viruses and phenotypic studies of bacteria (Buckling and Rainey 2002; Brockhurst et al. 2004). Second, we expect different suites of mutations to be acquired in evolved and coevolved bacteria. Somewhat trivially, we only expect resistance mutations to bacteriophage to be acquired in coevolving populations but a less obvious prediction is that mutations acquired in evolved populations will not be acquired in coevolved populations, despite coevolved hosts experiencing a superset of the selective pressures (i.e., not just abiotic but abiotic plus biotic) experienced by evolved bacteria. This is because coevolution may slow down the acquisition of some beneficial mutations as a result of competition between mutations (clonal interference) (Felsenstein 1974; Gerrish and Lenski 1998) and lower population sizes caused by coevolving parasites (Zhang and Buckling 2011) as well as epistatic interactions between resistance and other mutations (Lenski 1988; Weinreich et al. 2005; Buckling et al. 2006).
To address these predictions, we characterized the genetics of resistance evolution to phage during antagonistic coevolution, detailed the effects of coevolution with phage on genome-wide evolution of bacterial hosts, and investigated the relative costs of adaption to the abiotic environment in the presence and absence of coevolving parasites (hereafter referred to as coevolution and evolution treatments). To do so, we carried out phenotypic and genomic analyses of the bacterium Pseudomonas fluorescens SBW25 that had been evolved in isolation or coevolved with dsDNA lytic phage (Phi2) for up to 400 generations in nutrient media. These organisms initially undergo an arms race dynamics in these conditions, with bacteria and phage continually evolving resistance and infectivity, while retaining resistance/infectivity to previously encountered populations (Buckling and Rainey 2002). Both increased resistance and infectivity ranges are associated with a growth rate cost relative to ancestral genotypes, and the arms race dynamic can shift to a fluctuating dynamic (temporal changes in the frequency of specialized genotypes) as a result (Hall, Scanlan, Morgan, et al. 2011). Our initial approach was to focus on the phenotypic and genomic characterization of single genotypes from replicate populations evolved in the presence or absence of phages at the final time point of a 400-generation evolution experiment (Hall, Scanlan, Morgan, et al. 2011) in order to link phenotype with genotype (which is not possible with whole population genomic characterization) and investigate genome-wide effects of bacterial adaption in multiple independently evolved genomes from both experimental treatments. We also sequenced additional phage-resistant genotypes from all coevolved populations after approximately 70 generations, and from a single population at multiple earlier time points, in order to track molecular evolution over time.
Results
Phenotypic Evolution
Coevolved bacteria showed extensive and variable resistance to both sympatric and allopatric coevolving phage, whereas bacteria evolved in the absence of phage (evolution treatment) were sensitive to all coevolved phage genotypes they were tested against (fig. 1A and supplementary fig. S1, Supplementary Material online). Fitness (measured as bacterial growth relative to the ancestral genotype in pairwise competition experiments) in the absence of phage was approximately 25% higher in control compared with both coevolved hosts (t10 = 5.24, P < 0.0002) and the ancestor (t5 = 10.98, P < 0.0001), with no difference in fitness between coevolved hosts and the ancestor (t5 = 0.1014, P = 0.9232; fig. 1B). These data indicate that coevolution had the net effect of constraining adaptation to the abiotic environment (M9 King’s Media B).
Fig. 1.

(A) Coevolved hosts (Coevo) showed extensive resistance to phage, whereas populations evolved in the absence of phages (Evo) were sensitive to all the phage populations and genotypes they were tested against. The host resistance score is the mean (±SEM) proportion of phage that hosts were resistant to. (B) Boxplots showing coevolved hosts had a significantly lower fitness in the absence of phages than evolved hosts. The fitness of the ancestor or WT is indicated with the dashed line (=1).
Genome Evolution
Initially, we sampled a single genotype from each population at T60 (coevolved [n = 6] and evolved [n = 6]) for whole genome sequence analysis. Coevolved T60 genotypes had on average approximately 10 × as many nonsynonymous mutations as T60 evolved genotypes (respectively, 50 ± 36.42 and 4.3 ± 0.81; mean ± SD; t10 = 3.07, P = 0.0059; fig. 2A), as well as a much greater variation in the total number of mutations (including both nonsynonymous and synonymous mutations) (fig. 2B and table 1). Genetic divergence among coevolved genotypes was much greater than that among evolved genotypes (fig. 3). The mean number of genes that were differentially mutated between a given pair of genotypes was 95.7 (SE = 42.1) and 7.6 (SE = 3.0), respectively; this distance measure equals the square of the Euclidean distance, as established as an appropriate measure of genetic divergence (Excoffier et al. 1992; Paterson et al. 2010).
Fig. 2.

(A) The mean (±SD) number of nonsynonymous (non-syn) mutations was significantly higher in the coevolution (Coevo) than the control (Evo) treatment; however, there was considerable variation in the number of mutations per genome between replicate selection lines within coevolution treatment (C1–C6) (B).
Table 1.
Overview of Bacterial Mutation Rates for T60 Coevolved (C prefix) and Evolved (E prefix) Groups and Fitness Scores Together with Genomic Changes (relative to the ancestor [WT]) in Loci Implicated in Elevated Mutation Rates.
| Genotype | Mutation Rate (per 107)a | Number of Mutations | Mutation | Fitness Score (W) |
|---|---|---|---|---|
| C1 | 3.7286 | 127 | mutS (C 81 R), lexAb, uvrBb, xerD (P296 S) | 1.1175 |
| C2 | 71.3323 | 89 | uvrD (L 306 P), recQ (V 392 A), pcrA (R 10 H) | 1.0524 |
| C3 | 49.1216 | 104 | recBb | 1.0496 |
| C4 | 20.6551 | 54 | mutS (T 497 P), dnl1 (V 456 A) | 0.9971 |
| C5 | 0.7927 | 11 | None | 0.8870 |
| C6 | 3.4711 | 7 | None | 0.8435 |
| WT | 0.2157 | 0 | None | 1.0000 |
| E1 | 0.2742 | 7 | None | 1.2173 |
| E2 | 1.3209 | 5 | None | 1.3219 |
| E3 | 0.3203 | 4 | None | 1.2357 |
| E4 | 0.405 | 5 | None | 1.3112 |
| E5 | 0.2379 | 6 | None | 1.2311 |
| E6 | 0.3848 | 5 | None | 1.1730 |
aMutation rate, as indicated, is displayed per 107 mutations/generation (Hall et al. 2009).
bSynonymous mutation.
Fig. 3.

Phylogenetic tree of T60 genomes rooted with the ancestor. C1–C6 are genotypes from the Coevolution treatment and E1–E6 are genotypes from the Evolution treatment. The evolutionary history was inferred using the Neighbor-Joining method. The tree is drawn to scale, with branch lengths in the same units as those of the evolutionary distances used to infer the phylogenetic tree.
We suspected that the high mean and variance in the number of mutations might have resulted from the evolution of mutator phenotypes in some coevolved populations, as previously observed in this system (Pal et al. 2007). Indeed, five out of six of the T60 coevolved genotypes (compared with 0 out of 6 of the evolved genotypes) had mutation rates at least 10-fold higher than the ancestor (table 1); notably, one coevolved nonmutator genotype had a comparable number of mutations to the evolved genotypes. For three of these genotypes the mutator phenotype was associated with mutations in one or more Mismatch Repair genes (mutS, uvrD, or uvrB) (table 1), but for two genotypes the definitive cause of the mutator phenotype was not apparent.
Coevolved and evolved genotypes had different sets of mutations: The same genes were more likely to be mutated within- than between-treatments (permutation test: F1,10 = 1.23, P = 0.004). To determine whether bacteria in both treatments had distinct sets of mutations, as opposed to evolved bacteria simply acquiring fewer mutations than coevolved genotypes, we repeated our analysis but restricted it to either genes mutated only in coevolved populations (n = 279) or genes mutated only in control populations (n = 15). In both cases, genotypes were still more similar within- than between-treatments (genes mutated in coevolved treatment: F1,10 = 1.17, P = 0.004; genes mutated in evolved treatment: F1,10 = 2.33, P = 0.026; fig. 4A and B).
Fig. 4.
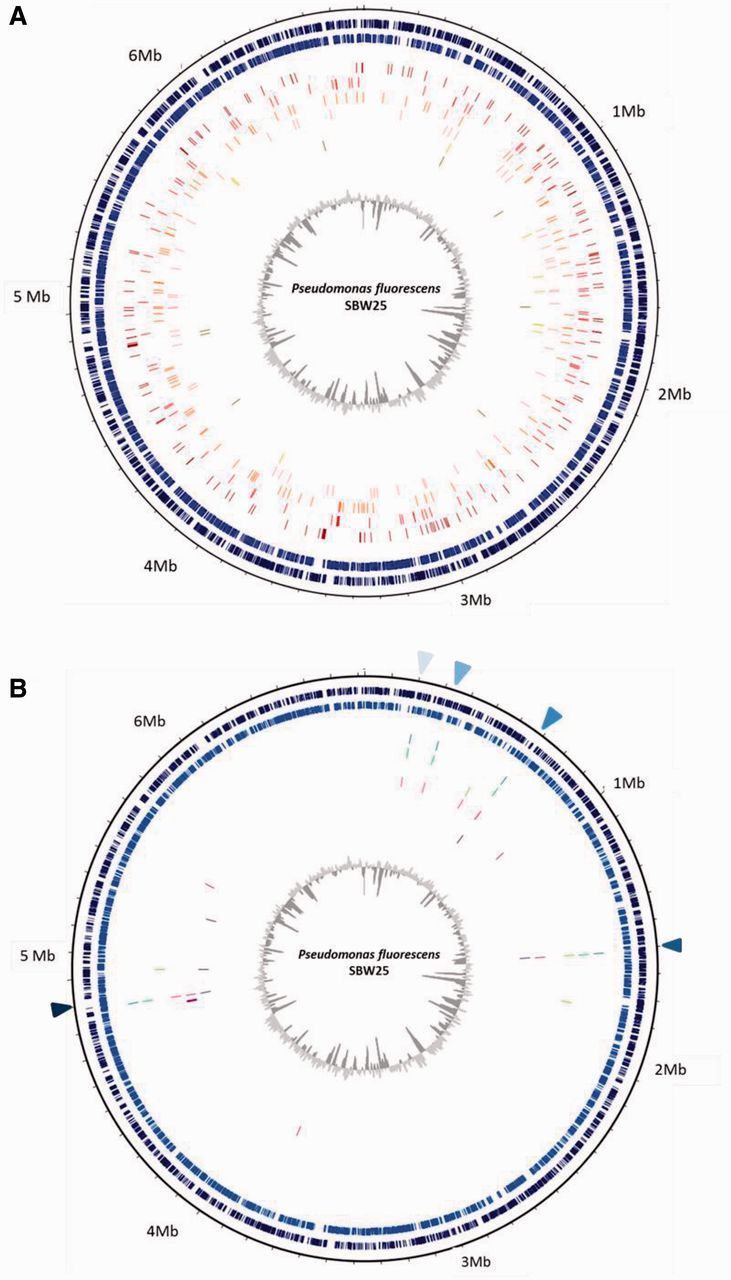
Mutations from each individual coevolved genotype (n = 6) (A) and evolved genotype (n = 6) (B) mapped to the circular genome of Pseudomonas fluorescens SBW25. The two outermost navy (positive strand) and blue (negative strand) circles of images (A) and (B) represent all genes and open reading frames (colored dashes) of P. fluorescens SBW25 (accession number: AM118176.4). Each subsequent and individual colored circle (running from the third to eight circle) represents the mutations present in each one of the six individual genotypes (C1–C6) from the T60 coevolution treatment in (A) and similarly E1–E6 from the T60 evolved treatment (B) mapped to the ancestral genome. Note the variation and diversity in mutations per genotype in (A) compared with the low number and high degree of parallel evolution in (B). Triangle markers shaded from light to dark blue denote location of PFLU_0185, wwsF, PFLU_0596–PFLU 0598 region, algU, and PFLU_4418, respectively (B).
Genetics of Host Resistance Evolution during Antagonistic Coevolution
Due to the selection of mutator phenotypes in coevolved populations, many of the mutations observed in this treatment affected a wide range of traits, many of which showed no obvious link with phage resistance (i.e., associated with lipopolysaccharide [LPS] or cell wall biogenesis). For example, 82% of the 201 nonredundant genes with amino acid changing mutations to which we could give a functional gene classification were assigned to one of 15 functional categories (other than those associated with resistance) including many linked to metabolic processes such as amino acid transport and metabolism, carbohydrate metabolism, and inorganic ion transport, supplementary figure S2, Supplementary Material online. Nonetheless, some of these genes may have a more cryptic role in phage resistance and we also considered the possibility that on-going coevolution may have resulted in additional resistance mechanisms not related to LPS: two genotypes coevolved for 400 generations also had mutations in one of two different putative genes (based on homologies with Escherichia coli) required for phage reproduction and growth (Czyz et al. 2001; Qimron et al. 2006).
Despite the lack of clear association between many mutations and phage resistance, mutations that were present in coevolved but not evolved genotypes do shed light on the genetic bases of resistance in this system. Of particular note are the many mutations in genes encoding the LPS component of the outer membrane that were present in all coevolved genotypes (see supplementary tables S1 and Supplementary Data, Supplementary Material online): Phi2 shares significant homologies with E. coli bacteriophage T7, which is known to interact with LPS (Tamaki et al. 1971). Thirty-six (18%) nonredundant mutations in the long-term coevolution data set (including data from the mutator genotypes) were associated with LPS and cell envelope biogenesis. To further investigate the importance of LPS for phage resistance we sequenced earlier nonmutator genotypes, which had accumulated fewer mutations. Specifically, we sequenced one genotype from each of the six coevolved populations, after approximately 70 bacterial generations or 10 transfers (T10), as well as 4 additional genotypes from a single population from multiple earlier time points of coevolution (after approximately 14 [T2], 28 [T4], 42 [T6], 56 [T8], and 70 [T10] generations). All genotypes had evolved some phage resistance (supplementary fig. S3A, Supplementary Material online) and all four of the earliest genotypes only had mutations in genes associated with LPS biogenesis (supplementary fig. S3B and Supplementary Data, Supplementary Material online). Of the 6 genotypes coevolved for 70 generations, (each with a unique resistance phenotype; supplementary fig. S1, Supplementary Material online), 10 out of the 15 nonsynonymous mutations present in this data set were in genes associated with LPS biogenesis (supplementary table S2, Supplementary Material online). To determine whether these mutations in LPS-associated genes actually affect LPS structure, we determined LPS length for coevolved and evolved genotypes together with the ancestral host. The LPS length of a bacterium is related to the number of O-antigen-repeated units comprising the polymer. The chain length refers to the number of these repeated units which can vary by strain. As an example, for E. coli, the number of repeated units can result in LPS that is very short (1–7 units), short (7–16 units), intermediate (10–18 units), or long (16–25 units) (Franco et al. 1998). Although the ancestral and evolved genotypes had the same short LPS of just a few O-antigen repeats, coevolved genotypes had one of four different LPS types: Very short, short, intermediate, or long (supplementary table S3, Supplementary Material online).
Mutations Associated with Evolved Populations
Given the significant increase in competitive fitness observed for genotypes evolved in the absence of phages (fig. 1B), it is likely that at least some of the genes mutated in these evolved (but not coevolved) genotypes play a key role in bacterial growth under these experimental conditions. A total of 32 mutations were identified in the six evolved genotypes. Of these 32 mutations, 17 (53%) occurred in just four genes (PFLU_0185, algU, wwsF, and PFLU_4418). Moreover, 5/32 (15%) of the mutations were associated with a region of unknown function (PFLU_0596–PFLU_0598) indicating that this site may be under selection and encode some function important for adaption to the abiotic environment. Collectively, 68% of all mutations detected in the evolved genotypes were restricted to just these five common sites and all evolved genotypes shared one or more mutations, see figure 4B. For example, two genotypes (E1 and E2) had mutations in all five commons sites, one genotype had mutations in four out of the five commons sites (E4) and one genotype had mutations in three out of five common sites (E6). PFLU_0185 contains both a GGDEF and an EAL domain, both of which affect bacteria growth (Ryjenkov et al. 2005; Wang et al. 2010); wwsF has high homologies to ftsQ which encodes an essential cell division protein in E. coli (Chen et al. 1999), and PFLU_4418 has high homologies to parA, which encodes an ATPase in P. aeruginosa (Lasocki et al. 2007). Given the low number of mutations but large increase in fitness for evolved genotypes, these mutations are likely to have conferred a significant selective advantage.
Mutations in these genes were notably absent in the coevolved genotypes with the exception of a single mutation in PFLU_0185 detected in one coevolved genotype (C4) and another mutation in PFLU_4418 detected in one other coevolved genotype (C1). Only one gene with mutations was detected in more than one genotype in both treatment groups and this was algU. Mutations in algU were present in five of the six evolved genotypes (fig. 4B) and four of the six coevolved genotypes. However, as this gene encodes an alternative sigma factor that plays a regulatory role in a number of different cellular functions including the bacterial stress response, biofilm formation, conversion to mucoidy (a phenotype associated with phage resistance [Scanlan and Buckling 2012]) and motility (Schurr et al. 1995; Garrett et al. 1999), it may be under different selection pressures in the coevolution and evolution treatments. algU is an exception and the number of genes with shared mutations between the two treatments was very low (the number of genes with mutations identified in the control line that were also present in the coevolution comprised only a small percentage [0.02%] of the mutations identified in the coevolution data set). A key question that arose from our whole genome sequence analysis is why were not a greater number of these putative beneficial mutations present in coevolved populations?
Coevolution of Evolved Genotypes and Evolution of Coevolved Genotypes
To provide some insight into why a greater number of mutations that are linked to a growth rate advantage were not present in coevolved hosts, we determined how fitness of T60-evolved genotypes changed when they were subsequently coevolved with phages (“evolved–coevolved T10” genotypes). As a control for this experiment we also evolved the T60-coevolved bacteria in the absence of phage (“coevolved–evolved T10” genotypes), for the same period of time. Coevolving populations may not have enough time to acquire these beneficial mutations because of clonal interference or reduced population size. As such, fitness of the “evolved–coevolved T10” genotypes should be higher than ancestral bacteria coevolved for the same amount of time (“coevolved T10”). In contrast, if the growth-beneficial mutations had a relatively small benefit, or were disadvantageous as a result of coevolution with parasites, fitness of “evolved–coevolved T10” should be comparable to “coevolved T10” genotypes. Similarly, we would not expect any increase in fitness of the “coevolved–evolved T10” genotypes if the growth-beneficial mutations had a relatively small benefit, or were disadvantageous as a result of coevolution with parasites. We therefore coevolved the ancestral bacterium and the evolved T60 genotypes (E1–E6, evolved for 400 generations) in the presence of phages and evolved the coevolved T60 genotypes (C1–C6, coevolved for 400 generations) in the absence of phage for an additional 70 generations (ten transfers), before comparing their competitive fitness scores in the absence of viruses. Fitness of the evolved genotypes was dramatically reduced following coevolution (evolved T60 vs. “evolved–coevolved T10” t10 = 3.214, P < 0.01; fig. 5), and was not significantly different from the “coevolved T10” bacteria (t10 = 0.5074, P = 0.3115; fig. 5). In our control experiment, fitness of the “coevolved–evolved T10” genotypes was no different following evolution in the absence of phage for 70 generations (see fig. 5).
Fig. 5.

Barchart showing from left to right the mean fitness (±1 SD) of the ancestral bacterium evolved without phage (Evo T10) for ten transfers (70 host generations) and coevolved with phage for ten transfers (Coevo T10), the fitness of bacterial genotypes evolved without phage for 60 transfers (∼400 generations) before (Evo T60) and after ten transfers of coevolution with phage (Evo–Coevo T10) and the fitness of bacterial genotypes coevolved with phage for 60 transfers (Coevo T60) and following ten transfers in the absence of phage (Coevo–Evo T10). The fitness of the ancestor (WT) is indicated with the dashed line (=1).
Asymmetry in Evolutionary Potential between Bacteria and Bacteriophage
We have previously shown that viral infectivity evolution appears to be restricted to just one or possibly two loci (Paterson et al. 2010; Scanlan et al. 2011). Moreover, there is strong positive correlation between the number of amino acid changes in phage infectivity loci and phage host range (Hall, Scanlan, and Buckling 2011; Scanlan et al. 2011) demonstrating a constraint on the potential for phages to evolve elevated infectivity ranges. To investigate whether similar genetic constraints operate on the evolution of bacterial resistance ranges, we looked at the genetic data from the T2 to T10 bacterial hosts and compared it with the dynamics of genetic change observed for these previously characterized phages they had coevolved with (Scanlan et al. 2011). In contrast to phages (Hall, Scanlan, and Buckling 2011; Scanlan et al. 2011), there was no significant correlation between the number of mutations and resistance ranges evolved during early coevolution and resistance was linked to mutations at multiple different loci. Indeed, single mutations at different loci involved in LPS and cell wall biogenesis confer highly variable resistance ranges (supplementary fig. S3A and Supplementary Data, Supplementary Material online).
Discussion
Here, we show that coevolution with viral parasites drives genome-wide evolution and genetic divergence of their bacterial hosts. Our results also indicate a novel cost of host–parasite coevolution in that coevolution with parasites constrains the acquisition of mutations important for host adaptation to the abiotic environment. An analogous finding has been reported for coevolving viruses adapting to temperature stress (Zhang and Buckling 2011), although the genomics underlying this was not investigated.
Although the evolution of mutators in at least four of the six coevolved populations precluded the identification of genes specifically associated with resistance evolution, sequence analysis of an additional 12 hosts from earlier on in the coevolutionary process enabled us to characterize the genetics of resistance evolution through time and across different populations and also link genotype to phenotype. Resistance evolution to phage in this study system was primarily due to mutations associated with a range of genes involved in LPS or cell wall biogenesis. Additionally, single mutations at different loci associated with LPS or cell wall biogenesis identified in hosts isolated from early on in the coevolutionary process conferred different resistance phenotypes and resistance ranges. We also tested all evolved hosts for phage resistance; they all remained sensitive to phage, indicating that there was no correlation between adaptation to the abiotic environment and resistance evolution as has been shown previously for other bacteria and phage combinations (Meyer et al. 2010).
Structural analysis of evolved and coevolved bacteria supported our genetic analysis and shows that LPS structure is indeed a crucial determinant of host resistance in this system. LPS (also commonly referred to as endotoxin) is a complex trait with numerous different genes contributing to the making, processing, assembly, and export of this structure which forms an integral component of bacterial cell structure and functionality. LPS is also a significant virulence factor in a number of human pathogens; 100 s of LPS variants have been reported for single species and variation in LPS can account for differences in both virulence and antimicrobial resistance (Banemann et al. 1998; Fierer and Guiney 2001). Our data clearly show that changes in LPS structure are a key determinant of resistance/susceptibility to coevolving phages and that coevolution with phage drives variation in LPS structure. We observed four general types of LPS banding, ranging from short to very long and although it is not known exactly how these changes in LPS structure affect resistance, it is possible that mutations conferring a very short LPS phenotype result in the loss of the phage receptor, whereas mutations conferring a long LPS phenotype mask the receptor site or result in structural changes that prevent access to the receptor. Together with our genetic analysis (where we observed different mutations at multiple loci linked to LPS and cell wall biogenesis), these data indicate that there is considerable genetic and structural plasticity in LPS for our host bacterium. This helps explain how LPS, as the parasite binding site, can support long-term coevolutionary dynamics in this system.
Despite the fact that we observed a high number of nonsynonymous mutations with no obvious link to resistance genes for our T60 hosts (>80%), the number of genes with mutations shared between the coevolved and evolved genotypes was extremely low. This general absence of mutations in genes beneficial for the abiotic environment in the coevolved T60 genotypes represents a cost of resistance to parasites that is distinct from the well-documented cases of antagonistic pleiotropy (Bohannan and Lenski 2000). Correspondingly, our subsequent experiments revealed that mutations present in the evolved genotypes no longer conferred any fitness benefit after coevolution with parasites. Indeed, fitness of these subsequently coevolved control lines was the same as that of lines coevolved for the same amount of time but without the 400 generations prior adaptation to the abiotic experimental conditions. Moreover, in our control experiment coevolved bacteria did not show a significant increase in fitness after evolution in the absence of phages. This strongly suggests that absence of growth-beneficial mutations in coevolving hosts was not simply the result of a reduction in the rate of acquisition of beneficial mutations (through clonal interference [Felsenstein 1974; Gerrish and Lenski 1998] or reduced population size), but the result of negative epistasis between growth-promoting and resistance mutations. This negative epistasis might have arisen because resistance mutations may act as a limiting factor in maximizing growth rate (by, e.g., limiting the rate of uptake of key nutrients), hence increases in growth rate resulting from other mutations would have little effect. Although the operation of epistasis between resistance and other mutations is consistent with previous work, definitive proof of this hypothesis would require the reconstruction of genotypes with both the growth-promoting mutations and resistance mutations (Weinreich et al. 2006; Chou et al. 2011; Khan et al. 2011; Plucain et al. 2014), as well as detailed functional analyses of these mutations. Unfortunately, given the vast number of mutations observed here, these experiments are beyond the scope of this work.
The increased molecular evolution and among-replicate divergence of coevolved hosts is consistent with Van Valen’s “Red Queen” hypothesis (van Valen 1973, 1974) and associated empirical studies that show antagonistic coevolution accelerates molecular evolution (Hedrick 1994; Obbard et al. 2006; Paterson et al. 2010). The proximate mechanism for these findings in our study was likely to have been the increased mutation rates of most of the coevolved genotypes, as has been observed previously (Pal et al. 2007). The evolution of increased mutation rates during coevolution with phages is presumably because of linkage between mutator alleles and the adaptive resistance mutations that they rapidly generate (Pal et al. 2007). Crucially, the majority of mutations resulted in amino acid changes in genes with no obvious link to resistance in our T60 genotypes, suggesting a causal link between coevolution with parasites and functional changes in nonresistance traits. It is unclear what selective advantage, if any, these additional mutations might confer, as many are possibly deleterious, but some of them may buffer against the pleiotropic costs of resistance mutations; another example of epistasis (Maisnier-Patin and Andersson 2004; Poon et al. 2005). Comparable functional changes in nonresistance traits are likely to arise under conditions where coevolution has been shown to select for increased recombination in eukaryotic systems (Morran et al. 2011). Note that the increased divergence between coevolved replicates may also have been driven to some extent by genetic bottlenecks imposed by selective sweeps of resistant mutants (Buckling and Rainey 2002). In contrast, bottlenecks resulting from genetic drift are unlikely to have played a major role, as coevolved population sizes under almost identical experimental conditions were consistently high (never below 108), and populations were only diluted 100-fold at each transfer.
Finally, our results may also help to explain why bacteria appear to have an evolutionary advantage over phages in this system (Buckling and Rainey 2002). We have previously shown that there is strong positive correlation between the number of amino acid changes in phage infectivity loci and phage host range (Hall, Scanlan, and Buckling 2011; Scanlan et al. 2011), and that multiple mutations are required to infect certain highly resistant hosts. Our analyses of genetic data from bacteria (T2–T10) that had coevolved with previously characterized phage (Scanlan et al. 2011) show that the evolution of broad resistance range can occur much more readily, sometimes through single mutations, than the evolution of broad infectivity ranges.
Materials and Methods
Experimental Design
We established two treatments with six replicate microcosms per treatment from isogenic stocks of host bacterium P. fluorescens SBW25 and lytic viral parasite bacteriophage Phi2 (coevolution with phage and evolution with no phage) as outlined previously (Hall, Scanlan, Morgan, et al. 2011). In brief, microcosms containing 6 ml M9KB medium (M9 salt solution supplemented with 10 g L glycerol and 20 g L proteose peptone) were inoculated with approximately 108 cells of P. fluorescens SBW25 and for the coevolution treatment approximately 105 particles of bacteriophage Phi2 (Buckling and Rainey 2002; Hall, Scanlan, Morgan, et al. 2011). Six replicates for each treatment (coevolution and evolution) were maintained by serial transfer, with 100-fold dilution every 48 h, 48 h is the equivalent of one transfer (1T), and one transfer is equal to approximately seven bacterial generations. Microcosms were incubated statically at 28°C, and vortexed for 1 min (11,000 g) to homogenize the culture prior to 1% v:v transfer to fresh media. Populations were maintained by serial transfer for approximately 400 bacterial generations (Hall, Scanlan, Morgan, et al. 2011), and a sample of each was frozen at 80°C in 20% v:v glycerol every ten transfers.
Isolation of Bacteria and Phage
Bacteria and phage were isolated as described earlier (Hall, Scanlan, Morgan, et al. 2011) and all genetic and phenotypic analysis was conducted at the genotype level. For genetic and phenotypic analysis we isolated 24 bacteria representative of the diversity naturally occurring in this system; one from each population of the coevolution (n = 6) and control treatments at T60 (n = 6), one from each population of the coevolution treatment at T10 (n = 6), and one from T2, T4, T6, T8, T10, and T30 from a single population (n = 6). Host resistance assays, mutation rate analysis, WGS, and fitness assays were all conducted on these single bacterial genotypes, see methods below.
Host Resistance Assays
Host resistance assays were conducted according to previously optimized methods (Hall, Scanlan, Morgan, et al. 2011). Each T10 and T60 host genotype, together with the genotypes obtained from control populations, was tested for resistance against 180 different phage phenotypes (ten phage genotypes from each of the six populations at three different time-points 6 × 3 × 10 = 180). The resistance profile of each host was assayed using a pin replicator to apply phage to growing lawns of host bacteria that were made using the soft agar overlay method (each host was tested individually and in triplicate). Bacteria were scored as resistant if no plaques were observed in any of the three replicates. The phenotypes of bacteria from early coevolution (T2–T10 for population C6 only) were characterized in a similar manner in an earlier study (Scanlan et al. 2011).
Coevolution of Evolved Genotypes and Evolution of Coevolution Genotypes
We took the six single evolved and coevolved genotypes (i.e., those initially evolved for 60 transfers in the absence and presence of phages) isolated from our evolved (E1–E6) and coevolved (C1–C6) selection populations at T60 and used these to initiate our “Evolved–Coevolved” (n = 6) and Coevolved–Evolved (n = 6) experimental selection lines, by coevolving each of these genotypes with phage and without for ten transfers (∼70 bacterial generations), respectively, as described above. At the end of this experiment, a single genotype from each population was isolated and used to assess fitness.
Competition Experiments
Competition experiments were performed by inoculating microcosms with equal densities of a marked strain of ancestral P. fluorescens SBW25-lacZ and the competitor phenotype, and grown (competed) overnight at 28 °C (Hall, Scanlan, Morgan, et al. 2011). The numbers of both competitor and marked strains were enumerated by plating onto Luria–Bertani agar plates supplemented with X-gal at the start and end of the assay. The addition of X-gal allowed us to enumerate the marked strain of P. fluorescens SBW25-lacZ, which forms distinct blue colonies on this medium. The starting and final densities of both the marked strain and competing phenotype were calculated as CFUs/ml based on direct count data after 48 h incubation. Each assay was performed in triplicate and fitness (W) was taken as the ratio of the estimated Malthusian parameters (m) of each competing type, m = ln(Nf/N0), where N0 is the starting density and Nf is the final density (Lenski 1991).
Fluctuation Tests
We used fluctuation tests to estimate bacterial mutation rates for all isolates as previously described (Pal et al. 2007). Six microcosms per bacterial isolate were inoculated with 100–1,000 bacterial cells and were allowed to grow for 24-h shaking in a 28°C incubator. Final cell density was determined by plating dilutions on nonselective solid medium (KB). The number of mutants was estimated by plating 60 μl of each culture on solid selective medium (KB agar plates supplemented with rifampicin [100 µg ml−1] or streptomycin [50 µg ml−1]). Jones median estimator was used to calculate mutation rate from the average and median frequency of mutant colonies (Rosche and Foster 2000; Hall et al. 2009).
Bacterial WGS and Variant Detection
The 24 different bacterial genotypes that we had characterized phenotypically were used for whole genome sequence analysis. DNA was extracted from pure cultures using the Qiagen DNeasy Blood and Tissue Kit (Qiagen, UK) according to the manufacturer’s instructions for bacterial DNA extraction. DNA was eluted in sterile distilled water; DNA quality and quantity were checked by using a Nanodrop and agarose gel electrophoresis prior to sequencing.
Paired-end sequencing was carried out by Source Bioscience (Nottingham, UK) using the IlluminaHISeq2000 platform. Inevitable decay in sequence quality toward the end of a sequenced read can introduce higher frequencies of base-call errors, reducing the quality and number of reads that map to a reference sequence, and the efficacy of any downstream analysis. Initial inspection of the reads performed using the FastQC report tool (http://www.bioinformatics.bbsrc.ac.uk/projects/fastqc, last accessed September, 2013) showed that the base-call quality scores (supplementary fig. S4, Supplementary Material online; values calculated across all samples) increasingly dropped below the Q30 threshold value (indicating ≥ 0.001 probability of an incorrect base-call) as the read-length approached 60 bp. Reads were therefore trimmed to 55 bp prior to further analysis, to increase the percentage and overall quality of mappable reads. Trimmed reads were mapped to the complete SBW25 P. fluorescens reference genome (http://www.ncbi.nlm.nih.gov/nuccore/NC_012660.1, last accessed September, 2013) using BWA (Li and Durbin 2009) with default “aln” and “sampe” parameters. On average, 98.33 ± 1.7% (mean ± SD) of all reads were mapped, achieving 138.0 ± 49.64 × (mean ± SD) average coverage (supplementary table S4, Supplementary Material online). All sequence data are available upon request.
Mapped reads were then processed for variant detection. Potential polymerase chain reaction (PCR) duplicates were flagged and removed from the output using the MarkDuplicates command within the Picard toolkit (http://broadinstitute.github.io/picard/, last accessed September, 2013). Conversion to pileup format was carried out using samtools mpileup (http://samtools.sourceforge.net/, last accessed September, 2013). Taking pileup as input, a combination of samtools and Varscan (Koboldt et al. 2012) was then used to analyze the mapped reads in search of statistically significant differences to SBW25. VarScan (http://varscan.sourceforge.net/, last accessed September, 2013) calls variants using a heuristic method and statistical test based on the number of aligned reads supporting each genotype. The VarScan command mpileup2cns calls consensus genotypes at all positions with sufficient coverage (setting –variants 1 filters out nonvariant positions). Most parameters were kept at default, with the exception of –min-coverage (minimum number of reads to cover position [30]), –min-reads2 (minimum number of bases at that position that differ from the reference nucleotide [8]), –min-ave-qual (minimum average quality of the bases covering that position [20]), and –p-value (0.01, Fisher’s Exact Test). Results were exported in VCF format. In addition to using stringent thresholds to minimize any false positive single nucleotide polymorphism detection we used PCR (n = 60) followed by Sanger sequencing as a further control measure to verify the mutations that were called were true positives. We also selected a number of indels from our data set (n = 15) and verified their presence using PCR and Sanger sequencing as a quality control measure. All PCR verification checks were positive indicating that the number of false positives in the data set was minimal.
Sequence Analysis
Mutations and indel data were compiled and analyzed (including functional gene assignment) using a combination of Artemis, EXPasy portal tools, BLAST (Basic Local Alignment Search Tool), and data available from the Pseudomonas Genome Database (http://www.pseudomonas.com, last accessed March, 2014). To provide a visual overview of genetic distance at the nucleotide distance between different genotypes and to complement analysis of genetic divergence performed at the gene level (see Statistical Analyses), we constructed a simple distance tree using the Neighbor-Joining method (Saitou and Nei 1987). To create a data file for tree construction, we took every nucleotide position where a mutation was identified relative to the ancestral or wild type (WT) sequence for all T60 genotypes in the data set. For each genotype, this resulted in a contiguous nucleotide string with the mutation present in that genotype(s) or the corresponding WT base given for all other sequenced genotypes where this mutation was absent. This was done for all T60 sequenced genomes, n = 12. The tree is drawn to scale, with branch lengths in the same units as those of the evolutionary distances used to infer the phylogenetic tree. The evolutionary distances were computed using the number of differences method (Nei and Kumar 2000) and are in the units of the number of base differences per sequence. The analysis was conducted in MEGA5 and involved 13 nucleotide sequences with a total of 426 positions in the final data set. Circular genome plots (shown in fig. 4A and B) were constructed in DNAplotter.
Statistical Analyses
We tested whether treatment (coevolution/evolution) affected the types of mutations observed using permutational analysis of variance (Zapala and Schork 2006). For each gene, every genotype was scored as being mutated (1) or not mutated (0), before the Euclidean distance between each pair of genotypes was calculated (Excoffier et al. 1992). The probability that the observed ratio of average within- and between-group distances could arise by chance alone was assessed by F-test comparing observed values to random permutations of the raw data (Anderson 2001) using adonis {vegan in R v2.11.1}. All other statistical analyses were performed using R or SPSS. In cases where we made multiple tests, such as comparing fitness of control (evolved) bacteria to coevolved and ancestral bacteria separately, we only accepted statistical significance when P < α = 0.05 adjusted by sequential Bonferroni correction.
Structural Analysis of LPS
LPS was extracted from WT, coevolved and evolved genotypes using a hot-phenol method and analyzed as described in Davis and Goldberg (2012).
Supplementary Material
Acknowledgments
This work was funded by European Research Council and NERC (UK). The authors are also thankful to Steve Paterson for useful comments on the manuscript.
References
- Anderson MJ. A new method for non-parametric multivariate analysis of variance. Austral Ecol. 2001;26:32–46. [Google Scholar]
- Banemann A, Deppisch H, Gross R. The lipopolysaccharide of Bordetella bronchiseptica acts as a protective shield against antimicrobial peptides. Infect Immun. 1998;66:5607–5612. doi: 10.1128/iai.66.12.5607-5612.1998. [DOI] [PMC free article] [PubMed] [Google Scholar]
- Bohannan BJM, Lenski RE. Linking genetic change to community evolution: insights from studies of bacteria and bacteriophage. Ecol Lett. 2000;3:362–377. [Google Scholar]
- Brockhurst MA, Rainey PB, Buckling A. The effect of spatial heterogeneity and parasites on the evolution of host diversity. Proc Biol Sci. 2004;271:107–111. doi: 10.1098/rspb.2003.2556. [DOI] [PMC free article] [PubMed] [Google Scholar]
- Buckling A, Rainey PB. The role of parasites in sympatric and allopatric host diversification. Nature. 2002;420:496–499. doi: 10.1038/nature01164. [DOI] [PubMed] [Google Scholar]
- Buckling A, Wei Y, Massey RC, Brockhurst MA, Hochberg ME. Antagonistic coevolution with parasites increases the cost of host deleterious mutations. Proc Biol Sci. 2006;273:45–49. doi: 10.1098/rspb.2005.3279. [DOI] [PMC free article] [PubMed] [Google Scholar]
- Chen JC, Weiss DS, Ghigo JM, Beckwith J. Septal localization of FtsQ, an essential cell division protein in Escherichia coli. J Bacteriol. 1999;181:521–530. doi: 10.1128/jb.181.2.521-530.1999. [DOI] [PMC free article] [PubMed] [Google Scholar]
- Chou HH, Chiu HC, Delaney NF, Segre D, Marx CJ. Diminishing returns epistasis among beneficial mutations decelerates adaptation. Science. 2011;332:1190–1192. doi: 10.1126/science.1203799. [DOI] [PMC free article] [PubMed] [Google Scholar]
- Czyz A, Zielke R, Wegrzyn G. Rapid degradation of bacteriophage lambda O protein by ClpP/ClpX protease influences the lysis-versus-lysogenization decision of the phage under certain growth conditions of the host cells. Arch Virol. 2001;146:1487–1498. doi: 10.1007/s007050170073. [DOI] [PubMed] [Google Scholar]
- Davis MR, Jr, Goldberg JB. Purification and visualization of lipopolysaccharide from Gram-negative bacteria by hot aqueous-phenol extraction. J Vis Exp. 2012;63:3916. doi: 10.3791/3916. [DOI] [PMC free article] [PubMed] [Google Scholar]
- Excoffier L, Smouse PE, Quattro JM. Analysis of molecular variance inferred from metric distances among DNA haplotypes: application to human mitochondrial DNA restriction data. Genetics. 1992;131:479–491. doi: 10.1093/genetics/131.2.479. [DOI] [PMC free article] [PubMed] [Google Scholar]
- Felsenstein J. The evolutionary advantage of recombination. Genetics. 1974;78:737–756. doi: 10.1093/genetics/78.2.737. [DOI] [PMC free article] [PubMed] [Google Scholar]
- Fierer J, Guiney DG. Diverse virulence traits underlying different clinical outcomes of Salmonella infection. J Clin Invest. 2001;107:775–780. doi: 10.1172/JCI12561. [DOI] [PMC free article] [PubMed] [Google Scholar]
- Franco AV, Liu D, Reeves PR. The wzz (cld) protein in Escherichia coli: amino acid sequence variation determines O-antigen chain length specificity. J Bacteriol. 1998;180:2670–2675. doi: 10.1128/jb.180.10.2670-2675.1998. [DOI] [PMC free article] [PubMed] [Google Scholar]
- Garrett ES, Perlegas D, Wozniak DJ. Negative control of flagellum synthesis in Pseudomonas aeruginosa is modulated by the alternative sigma factor AlgT (AlgU) J Bacteriol. 1999;181:7401–7404. doi: 10.1128/jb.181.23.7401-7404.1999. [DOI] [PMC free article] [PubMed] [Google Scholar]
- Gerrish PJ, Lenski RE. The fate of competing beneficial mutations in an asexual population. Genetica. 1998;102–103:127–144. [PubMed] [Google Scholar]
- Hall BM, Ma C, Liang P, Singh KK. Fluctuation AnaLysis CalculatOR (FALCOR): a web tool for the determination of mutation rate using Luria-Delbruck fluctuation analysis. Bioinformatics. 2009;25:1564–1565. doi: 10.1093/bioinformatics/btp253. [DOI] [PMC free article] [PubMed] [Google Scholar]
- Hall AR, Scanlan PD, Buckling A. Bacteria-phage coevolution and the emergence of generalist pathogens. Am Nat. 2011;177:44–53. doi: 10.1086/657441. [DOI] [PubMed] [Google Scholar]
- Hall AR, Scanlan PD, Morgan AD, Buckling A. Host-parasite coevolutionary arms races give way to fluctuating selection. Ecol Lett. 2011;14:635–642. doi: 10.1111/j.1461-0248.2011.01624.x. [DOI] [PubMed] [Google Scholar]
- Hamilton WD, Axelrod R, Tanese R. Sexual reproduction as an adaptation to resist parasites (a review) Proc Natl Acad Sci U S A. 1990;87:3566–3573. doi: 10.1073/pnas.87.9.3566. [DOI] [PMC free article] [PubMed] [Google Scholar]
- Hedrick PW. Evolutionary genetics of the major histocompatibility complex. Am Nat. 1994;143:945–964. [Google Scholar]
- Hosseinidoust Z, van de Ven TG, Tufenkji N. Evolution of Pseudomonas aeruginosa virulence as a result of phage predation. Appl Environ Microbiol. 2013;79:6110–6116. doi: 10.1128/AEM.01421-13. [DOI] [PMC free article] [PubMed] [Google Scholar]
- Kashiwagi A, Yomo T. Ongoing phenotypic and genomic changes in experimental coevolution of RNA bacteriophage Qbeta and Escherichia coli. PLoS Genet. 2011;7:e1002188. doi: 10.1371/journal.pgen.1002188. [DOI] [PMC free article] [PubMed] [Google Scholar]
- Khan AI, Dinh DM, Schneider D, Lenski RE, Cooper TF. Negative epistasis between beneficial mutations in an evolving bacterial population. Science. 2011;332:1193–1196. doi: 10.1126/science.1203801. [DOI] [PubMed] [Google Scholar]
- Koboldt DC, Zhang Q, Larson DE, Shen D, McLellan MD, Lin L, Miller CA, Mardis ER, Ding L, Wilson RK. VarScan 2: somatic mutation and copy number alteration discovery in cancer by exome sequencing. Genome Res. 2012;22:568–576. doi: 10.1101/gr.129684.111. [DOI] [PMC free article] [PubMed] [Google Scholar]
- Koskella B, Brockhurst MA. Bacteria-phage coevolution as a driver of ecological and evolutionary processes in microbial communities. FEMS Microbiol Rev. 2014;38:916–931. doi: 10.1111/1574-6976.12072. [DOI] [PMC free article] [PubMed] [Google Scholar]
- Lasocki K, Bartosik AA, Mierzejewska J, Thomas CM, Jagura-Burdzy G. Deletion of the parA (soj) homologue in Pseudomonas aeruginosa causes ParB instability and affects growth rate, chromosome segregation, and motility. J Bacteriol. 2007;189:5762–5772. doi: 10.1128/JB.00371-07. [DOI] [PMC free article] [PubMed] [Google Scholar]
- Le S, Yao X, Lu S, Tan Y, Rao X, Li M, Jin X, Wang J, Zhao Y, Wu NC, et al. Chromosomal DNA deletion confers phage resistance to Pseudomonas aeruginosa. Sci Rep. 2014;4:4738. doi: 10.1038/srep04738. [DOI] [PMC free article] [PubMed] [Google Scholar]
- Lenski RE. Experimental studies of pleiotropy and epistasis in Escherichia coli. 1. Variation in competitive fitness among mutants resistant to virus-T4. Evolution. 1988;42:425–432. doi: 10.1111/j.1558-5646.1988.tb04149.x. [DOI] [PubMed] [Google Scholar]
- Lenski RE. Quantifying fitness and gene stability in microorganisms. Biotechnology. 1991;15:173–192. doi: 10.1016/b978-0-409-90199-3.50015-2. [DOI] [PubMed] [Google Scholar]
- Li H, Durbin R. Fast and accurate short read alignment with Burrows-Wheeler transform. Bioinformatics. 2009;25:1754–1760. doi: 10.1093/bioinformatics/btp324. [DOI] [PMC free article] [PubMed] [Google Scholar]
- Maisnier-Patin S, Andersson DI. Adaptation to the deleterious effects of antimicrobial drug resistance mutations by compensatory evolution. Res Microbiol. 2004;155:360–369. doi: 10.1016/j.resmic.2004.01.019. [DOI] [PubMed] [Google Scholar]
- Marston MF, Pierciey FJ, Jr, Shepard A, Gearin G, Qi J, Yandava C, Schuster SC, Henn MR, Martiny JB. Rapid diversification of coevolving marine Synechococcus and a virus. Proc Natl Acad Sci U S A. 2012;109:4544–4549. doi: 10.1073/pnas.1120310109. [DOI] [PMC free article] [PubMed] [Google Scholar]
- Meyer JR, Agrawal AA, Quick RT, Dobias DT, Schneider D, Lenski RE. Parallel changes in host resistance to viral infection during 45,000 generations of relaxed selection. Evolution. 2010;64:3024–3034. doi: 10.1111/j.1558-5646.2010.01049.x. [DOI] [PubMed] [Google Scholar]
- Morgan AD, Quigley BJ, Brown SP, Buckling A. Selection on non-social traits limits the invasion of social cheats. Ecol Lett. 2012;15:841–846. doi: 10.1111/j.1461-0248.2012.01805.x. [DOI] [PMC free article] [PubMed] [Google Scholar]
- Morran LT, Schmidt OG, Gelarden IA, Parrish RC, 2nd, Lively CM. Running with the Red Queen: host-parasite coevolution selects for biparental sex. Science. 2011;333:216–218. doi: 10.1126/science.1206360. [DOI] [PMC free article] [PubMed] [Google Scholar]
- Nei M, Kumar S. New York: Oxford University Press; 2000. Molecular evolution and phylogenetics; p. 333. [Google Scholar]
- Obbard DJ, Jiggins FM, Halligan DL, Little TJ. Natural selection drives extremely rapid evolution in antiviral RNAi genes. Curr Biol. 2006;16:580–585. doi: 10.1016/j.cub.2006.01.065. [DOI] [PubMed] [Google Scholar]
- Pal C, Macia MD, Oliver A, Schachar I, Buckling A. Coevolution with viruses drives the evolution of bacterial mutation rates. Nature. 2007;450:1079–1081. doi: 10.1038/nature06350. [DOI] [PubMed] [Google Scholar]
- Paterson S, Vogwill T, Buckling A, Benmayor R, Spiers AJ, Thomson NR, Quail M, Smith F, Walker D, Libberton B, et al. Antagonistic coevolution accelerates molecular evolution. Nature. 2010;464:275–278. doi: 10.1038/nature08798. [DOI] [PMC free article] [PubMed] [Google Scholar]
- Pirnay JP, De Vos D, Verbeken G, Merabishvili M, Chanishvili N, Vaneechoutte M, Zizi M, Laire G, Lavigne R, Huys I, et al. The phage therapy paradigm: pret-a-porter or sur-mesure? Pharm Res. 2011;28:934–937. doi: 10.1007/s11095-010-0313-5. [DOI] [PubMed] [Google Scholar]
- Plucain J, Hindre T, Le Gac M, Tenaillon O, Cruveiller S, Medigue C, Leiby N, Harcombe WR, Marx CJ, Lenski RE, et al. Epistasis and allele specificity in the emergence of a stable polymorphism in Escherichia coli. Science. 2014;343:1366–1369. doi: 10.1126/science.1248688. [DOI] [PubMed] [Google Scholar]
- Poon A, Davis BH, Chao L. The coupon collector and the suppressor mutation: estimating the number of compensatory mutations by maximum likelihood. Genetics. 2005;170:1323–1332. doi: 10.1534/genetics.104.037259. [DOI] [PMC free article] [PubMed] [Google Scholar]
- Qimron U, Marintcheva B, Tabor S, Richardson CC. Genomewide screens for Escherichia coli genes affecting growth of T7 bacteriophage. Proc Natl Acad Sci U S A. 2006;103:19039–19044. doi: 10.1073/pnas.0609428103. [DOI] [PMC free article] [PubMed] [Google Scholar]
- Rosche WA, Foster PL. Determining mutation rates in bacterial populations. Methods. 2000;20:4–17. doi: 10.1006/meth.1999.0901. [DOI] [PMC free article] [PubMed] [Google Scholar]
- Ryjenkov DA, Tarutina M, Moskvin OV, Gomelsky M. Cyclic diguanylate is a ubiquitous signaling molecule in bacteria: insights into biochemistry of the GGDEF protein domain. J Bacteriol. 2005;187:1792–1798. doi: 10.1128/JB.187.5.1792-1798.2005. [DOI] [PMC free article] [PubMed] [Google Scholar]
- Saitou N, Nei M. The neighbor-joining method: a new method for reconstructing phylogenetic trees. Mol Biol Evol. 1987;4:406–425. doi: 10.1093/oxfordjournals.molbev.a040454. [DOI] [PubMed] [Google Scholar]
- Scanlan PD, Buckling A. Co-evolution with lytic phage selects for the mucoid phenotype of Pseudomonas fluorescens SBW25. ISME J. 2012;6:1148–1158. doi: 10.1038/ismej.2011.174. [DOI] [PMC free article] [PubMed] [Google Scholar]
- Scanlan PD, Hall AR, Lopez-Pascua LD, Buckling A. Genetic basis of infectivity evolution in a bacteriophage. Mol Ecol. 2011;20:981–989. doi: 10.1111/j.1365-294X.2010.04903.x. [DOI] [PubMed] [Google Scholar]
- Schurr MJ, Yu H, Boucher JC, Hibler NS, Deretic V. Multiple promoters and induction by heat shock of the gene encoding the alternative sigma factor AlgU (sigma E) which controls mucoidy in cystic fibrosis isolates of Pseudomonas aeruginosa. J Bacteriol. 1995;177:5670–5679. doi: 10.1128/jb.177.19.5670-5679.1995. [DOI] [PMC free article] [PubMed] [Google Scholar]
- Tamaki S, Sato T, Matsuhashi M. Role of lipopolysaccharides in antibiotic resistance and bacteriophage adsorption of Escherichia coli K-12. J Bacteriol. 1971;105:968–975. doi: 10.1128/jb.105.3.968-975.1971. [DOI] [PMC free article] [PubMed] [Google Scholar]
- Thompson JN. Coevolution: the geographic mosaic of coevolutionary arms races. Curr Biol. 2005;15:R992–R994. doi: 10.1016/j.cub.2005.11.046. [DOI] [PubMed] [Google Scholar]
- van Valen L. A new evolutionary law. Evol Theory. 1973;1:1–30. [Google Scholar]
- van Valen L. Molecular evolution as predicted by natural selection. J Mol Evol. 1974;3:89–101. doi: 10.1007/BF01796554. [DOI] [PubMed] [Google Scholar]
- Wang Y, Xu J, Chen A, Wang Y, Zhu J, Yu G, Xu L, Luo L. GGDEF and EAL proteins play different roles in the control of Sinorhizobium meliloti growth, motility, exopolysaccharide production, and competitive nodulation on host alfalfa. Acta Biochim Biophys Sin (Shanghai). 2010;42:410–417. doi: 10.1093/abbs/gmq034. [DOI] [PubMed] [Google Scholar]
- Weinreich DM, Delaney NF, Depristo MA, Hartl DL. Darwinian evolution can follow only very few mutational paths to fitter proteins. Science. 2006;312:111–114. doi: 10.1126/science.1123539. [DOI] [PubMed] [Google Scholar]
- Weinreich DM, Watson RA, Chao L. Perspective: sign epistasis and genetic constraint on evolutionary trajectories. Evolution. 2005;59:1165–1174. [PubMed] [Google Scholar]
- Woolhouse ME, Webster JP, Domingo E, Charlesworth B, Levin BR. Biological and biomedical implications of the co-evolution of pathogens and their hosts. Nat Genet. 2002;32:569–577. doi: 10.1038/ng1202-569. [DOI] [PubMed] [Google Scholar]
- Zapala MA, Schork NJ. Multivariate regression analysis of distance matrices for testing associations between gene expression patterns and related variables. Proc Natl Acad Sci U S A. 2006;103:19430–19435. doi: 10.1073/pnas.0609333103. [DOI] [PMC free article] [PubMed] [Google Scholar]
- Zhang QG, Buckling A. Antagonistic coevolution limits population persistence of a virus in a thermally deteriorating environment. Ecol Lett. 2011;14:282–288. doi: 10.1111/j.1461-0248.2010.01586.x. [DOI] [PubMed] [Google Scholar]
Associated Data
This section collects any data citations, data availability statements, or supplementary materials included in this article.