Abstract
Objectives
Metabolic syndrome (MS) is the concurrence of at least three of five medical conditions: obesity, high blood pressure, insulin resistance, high serum triglyceride (TG) and low serum high-density lipoprotein levels. While fibrates are used to treat disorders other than the lowering serum TG, the mechanism by which fibrates decrease MS has not been established.
Methods
In this study, wild-type and Ppara-null mice fed a medium fat diet (MFD) were administered gemfibrozil and fenofibrate for three months, to explore the effect and action mechanism.
Key findings
In Ppara-null mice, MFD treatment increased body weight, adipose tissue, serum TG, and impared glucose tolerance. These phenotypes were attenuated in two groups treated with gemfibrozil and fenofibrate. The STAT3 pathway was activated in adipose and hepatic tissues in positive control, and inhibited in groups treated with gemfibrozil and fenofibrate. The above phenotypes and inflammation were not observed in any wild-type group. In 3T3-L1 adipogenic stem cells treated with high-glucose, STAT3 knockdown greatly decreased the number of lipid droplets.
Conclusions
Low dose of clinical fibrates was effective against MS development independent of PPARα, and this action was mediated by STAT3 signaling inhibition in adipose tissue, and to a lesser extent in hepatic tissues.
Keywords: PPARα, metabolic syndrome, gemfibrozil, fenofibrate, STAT3
Graphical abstract
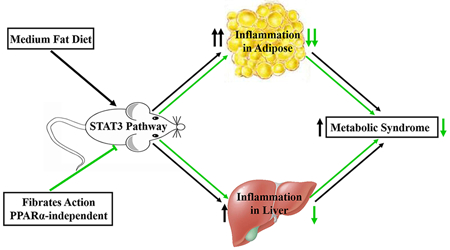
Proposed action mode of fibrates against metabolic syndrome independent of PPARα. Medium fat diet supplemented with low dose of fibrate gemfibrozil and fenofibrate respectively was administered to mice. In Ppara-null mice, not the wild-type mice, the STAT3 pathway inhibition by reduced the MS phenotypes and inflammation in adipose, and to a less extent in hepatic tissues. So low dose of clinical fibrates was effective against MS development independent of PPARα, and this action was mediated by STAT3 signaling inhibition.
Introduction
Metabolic syndrome (MS) is diagnosed by the concurrence of at least three of the following diseases: obesity, elevated blood pressure, insulin resistance, high serum triglyceride (TG) and low serum high-density lipoprotein-cholesterol (HDL-C). In the last decade, the prevalence of MS has markedly increased.[1] Both the unadjusted prevalence and age-adjusted prevalence significantly increased according to NHANES III and NHANES 1999–2006.[2] The MS events are closely related, and they frequently co-initiate and deteriorate in parallel. In MS patients, the risk of developing diabetes mellitus (DM) and cardiovascular diseases increased.[3] Morbidity and mortality associated with dyslipidemia in DM patients was 2 to 8 times higher than those in non-DM patients.[4] Pharmacological agents for treating MS symptoms are often co-administered. Metformin and the glitazone drugs have been used to treat DM in patients with or without MS,[5, 6] while statins and fibrates are classical choices for atherogenic dyslipidemia. However, when these agents were co-administered to treat MS symptoms, the toxicity risk is increased compared with single therapy.[1, 7]
MS was associated with various inflammatory signaling cascades. When put on a high-fat-diet (HFD, 60% kcal fat), IKK2 heterozygous mice developed obesity, but their glucose tolerance and basal glucose/insulin values improved, indicating a relationship between the NF-κB pathway and MS symptoms.[8] In JNK-deficient mice, treatment with HFD significantly decreased the body weight and protected against the development of insulin resistance.[9] Additionally, in both dietary and genetically obese mouse models, there was a significant increase of JNK activity in liver tissues. [10] These responses suggested that the JNK pathway was closely related to MS. In mice with hepatocyte-specific deletion of Janus kinase 2 (JAK2), HFD improved glucose-stimulated insulin secretion and increased the mass of pancreatic β-cells.[11] Disruption of JAK2 led to spontaneous steatosis and non-alcoholic fatty liver disease which were considered as hepatic manifestations of MS.[12, 13] In mice fed high fat diet, the STAT3 signaling inhibition by lycopene attenuated development of lipid accumulation, inflammation, insulin resistance and metabolic dysfunction.[14] In C57BL/6J mice treated with 30% fructose, when the JAK2/STAT3 was activated, the symptoms of NAFLD were improved.[15] In another mouse model treated with lipopolysaccharide, inhibiting STAT3 pathway led to alleviation of adipocyte inflammation.[16] These reports suggested that MS symptoms were associated with typical inflammation pathways NF-κB, JNK and STAT3. However, little is known which of the above pathways is critically important for MS development and treatment.
Clinically, fibrates are prescribed to treat dyslipidemia due to increased TG and/or decreased HDL-C.[17] The beneficial effects of gemfibrozil, fenofibrate and bezafibrate for glucose metabolism disorders were reported in mouse, rat models and in humans.[18–21] Additionally reduction of blood pressure is also associated with fibrate administration.[22] The in situ actions of fibrate drugs on vascular smooth muscle cells blood vessels and smooth muscles were recently reported.[23, 24] And the reduction of blood pressure was observed following fibrate treatment.[25, 26] Thus, besides the action of fibrates on lipid metabolism, the effects on glucose metabolism and blood pressure could be considered as a therapeutic option for MS. However, it was not established whether fibrates could inhibit MS development in an in vivo MS model.
Peroxisome proliferator-activated receptor α (PPARα) is a nuclear transcription factor regulating lipid metabolism in mammals.[27, 28] All the actions on cardiovascular system by fibrates are considered as down-stream events of PPARα activation. In mice fed a diet enriched with hydrogenated coconut oil, hyperinsulinemia was observed in wild-type mice, but not in Ppara-null mice.[29] In the Ppara-null mice treated with HFD, the concentrations of atherogenic lipoproteins were high, but insulin sensitivity, blood pressure and intimal lesion were all improved.[30] In a Ppara-null/Apoe-null mouse model the absence of PPARα led to a greater suppression of endogenous glucose production as revealed by a hyperinsulinemia clamp studies, indicating less insulin resistance in the absence of PPARα.[30] These studies suggest a role for PPARα in MS treatment, mechanism of which has not hitherto been explored.
In this study, an MS model was induced by MFD treatment to determine the role of PPARα in MS. Fenofibrate and gemfibrozil treatments were performed to observe the pharmacological actions of these PPARα agonists on MS. STAT3 was found to mediate the MS development and therapeutic actions by fibrates, which was validated in 3T3-L1 adipogenic stem cells using knockdown strategy.
Materials and methods
Chemicals and reagents
Gemfibrozil, fenofibrate, Oil Red O, dexamethasone, 3-isobutyl-1- methyl xanthine and bovine insulin were all obtained from Sigma-Aldrich (MO, USA). TC and TG assay kits were purchased from Ruiyuan Biotechnology (Ningbo, China). Antibodies against NFκB subunit p65 and active form phospho-p65 (p-p65), total STAT3 (t-STAT3), phospho-STAT3 (p-STAT3), phospho-JNK (p-JNK), phospho-ATF2 (p-ATF2) and GAPDH were acquired from Abcam (MA, USA). The reverse transcription kit and LightCycle 480 SYBR Green I Master Mix were obtained from Roche Diagnostics (Mannheim, Germany). Blood glucose meter test strips were bought from Johnson & Johnson Pharmaceuticals Ltd (USA). Ultrapure water was freshly prepared using a Milli-Q50 SP Water System (MA, USA). Medium-fat diet (MFD, 31% kcal fat) was obtained from SLACOM (Shanghai, China). All the other chemicals were of the highest grade available from commercial sources.
Animals and treatments
The wild-type and Ppara-null mice on the 129/Sv background were maintained under a standard 12 h light/12 h dark cycle with free access to water and a commercial diet. All mice were subject to acclimation for 7 days before the experiments. The procedures performed were in accordance with Institute of Laboratory Animal Resource Guidelines and the protocols approved by the Medical School of Ningbo University Animal Care and Use Committee. Both the wild-type and the Ppara-null mice were divided into 4 groups (n=5), vehicle/control (WT-Con, KO-Con), MFD/control (WT-MFD, KO-MFD), MFD/0.375% gemfibrozil (WT-MFD-G, KO-MFD-G), MFD/0.075% fenofibrate (WT-MFD-F, KO-MFD-F). The treatment was continued for three months. The nutrition components of the MFD were shown below in Supplementary table 2.
The body weights of all the mice were measured every week. Before the end of the experiment, an oral glucose tolerance test was performed. Specifically, after all mice were fasted for 12 h, the fasting blood glucose level was measured and the mice were orally challenged with a single dose of glucose solution (3 g/kg). During the test, the blood glucose was determined immediately after collection by tail bleeding every 30 min.
After the glucose tolerance test, the mice were allowed three days of recovery. Then all mice were weighed and killed by asphyxiation after blood collection. Adipose and liver tissues were harvested and weighed to calculate liver index and adipose index. Liver and adipose sections were cut and fixed in 10% formalin solution, and the remainders were immediately frozen on dry ice and stored at −80 °C.
Biochemical analysis and Histopathological assessment
TC and TG in serum were assayed by the Thermo Scientific Multiskan GO. The measurements were carried out following protocols supplied with the kits. The liver tissues (50 mg) from different groups were homogenized by MagNA Lyser (Roche, USA) in 150 μl physiological saline. The supernatant (80 μl) was used for assaying hepatic TC and TG by the same method as in the serum. The above determination of each marker was performed on the same 96 well plate to avoid systematic error. The concentrations of blood glucose were measured by use of a glucometer (Johnson & Johnson Ltd, USA). Formalinfixed liver and adipose tissues were dehydrated in alcohol and xylene following the standard procedures and embedded by paraffin for preparation of four-micrometer sections. After staining with hematoxylin and eosin, the liver sections were examined under a microscope. A total of 10 sections per preparation were imaged, and all images were analyzed blindly. To indicate the cell size of the adipose tissues, the diameter of fat cells was measured by Image J.
Q-PCR and Western blot analysis
Processing of liver and adipose samples followed previously published procedures. [31] The primer sequences, listed in Supplementary table 1, were extracted from http://mouseprimerdepot.nci.nih.gov. A 5 μl PCR system was designed for the 384 plate that included 1 μl of total cDNA, 2.5 μl of LightCycle 480 SYBR Green I Master Mix, 0.2 μl of forward and reverse primer, and 2 μl of nuclease-free water. The samples from 8 groups (WT-Con/KO-Con, WT-MFD/KO-MFD, WT-MFD-G/KO-MFD-G, WT-MFD-F/ KO-MFD-F) for Q-PCR were determined in the same run on one 384-well plate. The procedures of western blot analysis also followed a previous study by our group [32].
STAT3 knockdown in 3T3-L1 adipogenic stem cells
3T3-L1 adipogenic stem cells were cultured in high-glucose (4.5 g/L) DMEM containing 10% fetal bovine serum (FBS) and penicillin/streptomycin (both at 100 U/ml) at 37°C with 5% CO2. To induce differentiation, the cells were cultured for 2 days after confluence and then treated with culture medium supplemented with 1.0 μM dexamethasone, 0.5 mmol/L 3-isobutyl-1- methyl xanthine and 5.0 μg/ml insulin for 48 h. The cells were cultured in DMEM/10% FBS supplemented with 5.0 μg/ml insulin for additional 6 days.
Two mouse Stat3 siRNAs (siStat3–1: 5’-CCAACGACCUGCAGCAAUATT-3’; siStat3–2: 5’-CUCCAACAUCUGUCAGAUGTT-3’) (GenePharma, Shanghai) were transfected into the cells using lipofectamine RNAiMAX before induction of differentiation. GL3 siRNA (siGL3: 5’-CUUACGCUGAGUACUUCGATT-3’) was used as a control. Seventy-two hours after induction, the cells were collected for Western-blot analysis. After 8 days of induction, monolayers of differentiated 3T3-L1 adipocytes were washed twice with PBS and fixed with 4% paraformaldehyde for 30 min at room temperature. The cells were then stained with 0.5% Oil Red O in isopropanol for 1 h at room temperature. After staining, the cells were washed with 60% isopropanol and then with PBS. Finally, the stained lipid droplets were visualized and photographed using light microscopy.
Statistical analysis
All the data were expressed as the mean ± SD. The statistical analysis of biochemical markers and Q-PCR data was performed among wild-type groups and Ppara-null groups respectively. No comparison between wild-type and Ppara-null mice was done. SPSS 17.0 for Windows was used for the data analysis. Differences among multiple groups were tested using one-way analysis of variance followed by Dunnett’s post-hoc comparisons. Differences were considered significant when p<0.05 and was marked with asterisks and carets in the graphs accordingly.
Results
Fibrates inhibit the MS phenotype in Ppara-null mice
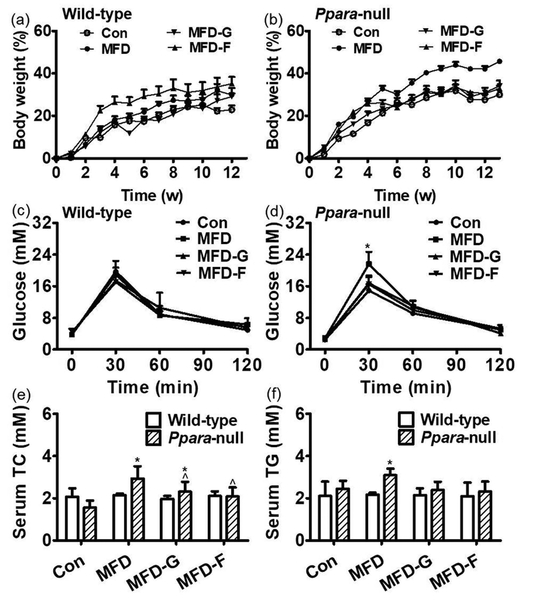
Body weights in the wild-type mice on a MFD increased gradually but there was no significant difference among the four groups (Figure 1a). However, in the Ppara-null mouse group, by the 5th week, the MFD group body weights increased more than the other three groups. At the end of treatment, the body weights of the KO-MFD group increased by 46% which was significantly higher than those in the other three groups (31% for KO-Con, 34% for KO-MFD-G and 32% for KO-MFD-F) (Figure 1b). Glucose tolerance test revealed that the blood glucose uptake was similar among the four wild-type groups (Figure 1c). However, in Ppara-null mice, the serum glucose level at 30 min after the glucose challenge in the KO-MFD group was significantly higher than that in the control group (21.6 ± 3.08 mmol/L vs 14.9 ± 1.6 mmol/L). Those in the KO-MFD-G and KO-MFD-F groups were almost normalized (16.8 ±1.58 mmol/L and 16.6 ±2.1 mmol/L). At the other three-time points (0 min, 60 min, 120 min), no significant differences were observed among the four Pparα-null groups (Figure 1d).
Figure 1.
Body weight gain was differentially accelerated by MFD in wild-type and Ppara-null mice. (a) Body weight increasing percent compared with control group in wild-type mice during the 3 months. (b) Body weight increasing percent compared with control group in Ppara-null mice over the course of 3 months. (c) The insulin resistance in the wild-type mice. (d) The insulin resistance in the Ppara-null mice. (e) The serum TC in the wild-type and Ppara-null mice. (f) The serum TG in the wild-type and Ppara-null groups. (n=5; *: compared with WT-Con or KO-Con respectively ^: compared with WT-MFD or KO-MFD groups respectively).
Serum TC and TG were not changed in the WT-MFD, WT-MFD-G and WT-MFD-F groups in comparison with the wild-type mouse control group. In Ppara-null mice, the TC and TG in the KO-MFD group were increased by 0.9-fold and 0.14-fold respectively. In the KO-MFD-G mice, the TC and TG were lower by 54% and 29% compared with the KO-MFD group. In the KO-MFD-F mice, TC and TG levels were lower by 58% and 38% respectively (Figure 1e and 1f).
Histopathology of hepatic and adipose tissues
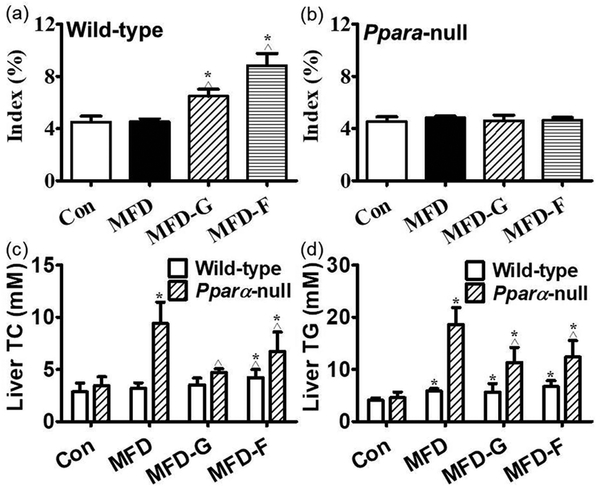
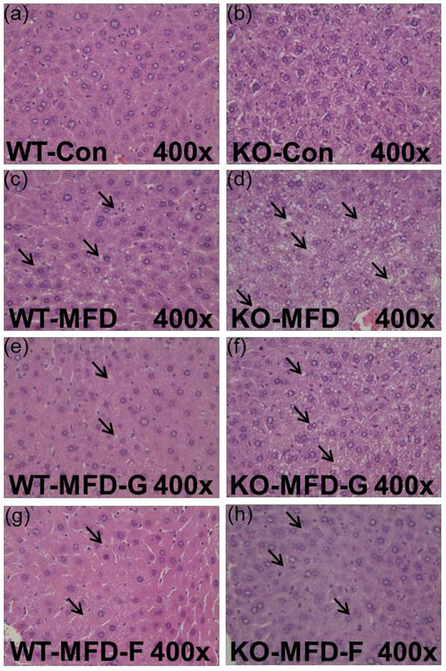
The liver index in wild-type mice was increased by fibrate treatment and no modification was observed in Ppara-null mice (Figure 2a and 2b). For the hepatic lipid levels, there were no obvious differences among the four groups in the wild-type mice for both TG and TC. In the Ppara-null mice, the TC and TG were increased by 1.73-fold and 3.1-fold respectively in the KO-MFD groups. By contrast, they were decreased by 50%, 40% in KO-MFD-G and 29%, 33% in KO-MFD-F group. This tendency was the same as that of the serum lipid, fatty liver and the pathological observations (Figure 2c and 2d). These data accorded with the histopathological results. In the wild-type groups, there was no difference among the four groups. In the KO mice, the KO-MFD group exhibited more fat vacuoles than the WT-MFD group, suggesting the occurrence of fatty liver. This was significantly attenuated in the KO-MFD-G and KO-MFD-F groups (Figure 3).
Figure 2.
Hepatic index and biochemistry indicating the difference between wild-type and Ppara-null mice. (a) Liver tissue index in wild-type mice. (b) Liver tissue index in Ppara-null mice. (c, d) The TC, TG in the liver tissues of wild-type and Ppara-null mice respectively and the results expressed as mean ± SD. (n=5; *: compared with WT-Con or KO-Con respectively ^: compared with WT-MFD or KO-MFD groups respectively).
Figure 3.
Hepatic histopathology indicating the steatosis and the protective role of gemfibrozil and fenofibrate in Ppara-null mice. (a, c, e, g) Histopathology image in the Con, MFD, MFD-G and MFD-F in the wild-type mice. (b, d, f, h) Histopathology image in the Con, MFD, MFD-G and MFD-F in the Ppara-null mice. The results were expressed as mean ± SD (n=5; *: compared with WT-Con or KO-Con respectively; ^: compared with WT-MFD or KO-MFD groups respectively)
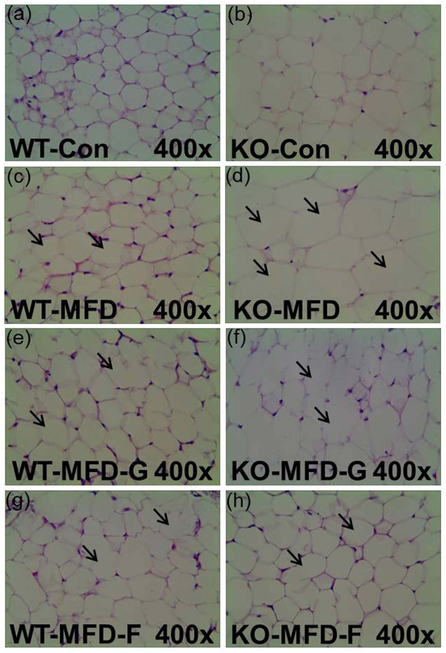
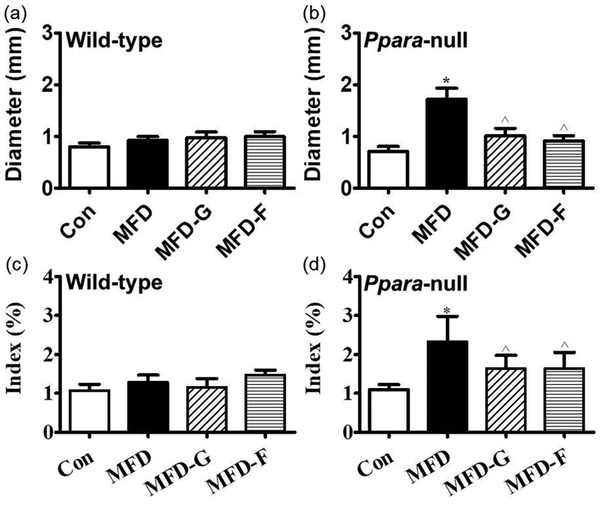
In the adipose tissues, the volume of the fat cells in adipose tissues was much larger and the shape was more irregular than in the KO-MFD mice. In KO-MFD-G and KO-MFD-F treated with the gemfibrozil and fenofibrate, the size modification of fat cells was normalized, similar to the tendency of the above fat vacuoles (Figure 4). For the fat cell diameter, there was no difference among wild-type groups, but it was increased by 1.41-fold in KO-MFD, which higher than that in the KO-MFD-G and KO-MFD-F (0.41-fold, 0.28-fold) (Figure 5a and 5b). Similarly the adipose indexes among the four wild-type groups were not different from each other (Figure 5c). However, in the Ppara-null mice MFD group, it was increased by 2.14-fold, much higher than that in the KO-MFD-G (0.50-fold) and KO-MFD-F (0.52-fold), showing the same tendency as that of the body weight (Figure 5d).
Figure 4.
Histopathology of adipose tissues indicating the adipose swollen and the protective role of gemfibrozil and fenofibrate in Ppara-null mice. (a, c, e, g) Histopathology image the Con, MFD, MFD-G and MFD-F in the wild-type mice. (b, d, f, h) Histopathology image in the Con, MFD, MFD-G and MFD-F in the Ppara-null mice. The results were expressed as mean ± SD (n=5; *: compared with WT-Con or KO-Con respectively; ^: compared with WT-MFD or KO-MFD groups respectively).
Figure 5.
The cell diameter and adipose tissue weight proved the difference between wild-type and Ppara-null mice. (a) The fat cell diameter measured in wild-type mice. (b) The fat cell diameter measured in Ppara-null mice. (c, d) Adipose tissue index in wild-type and Ppara-null mice respectively and the results expressed as mean ± SD. (n=5; *: compared with WT-Con or KO-Con respectively; ^: compared with WT-MFD or KO-MFD groups respectively).
Inflammation in hepatic and adipose tissues was inhibited by fibrates
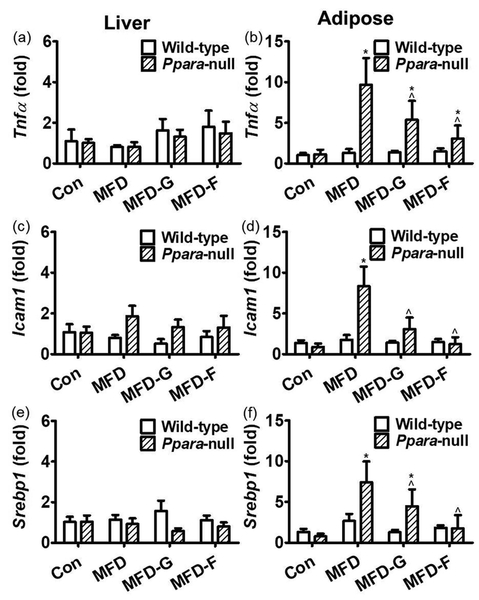
Tnfa, Srebf1 and Icam1 are pro-inflammatory factors which were often used to explore the inflammation status.[33, 34] In the liver tissues, the Tnfa, Srebf1 and Icam1 mRNA levels showed no difference between the wild-type mice or in the Ppara-null mice indicating no extensive inflammation in the liver tissue associated with MS (Figure 6a, 6c and 6e). In adipose tissues of the wild-type mice, no modification of Tnfa, Srebf1 and Icam1 mRNAs was observed. However, in Ppara-null mice, Tnfa, Srebf1 and Icam1 mRNAs in the KO-MFD group were increased by 6.6-fold, 7.7-fold and 7.6-fold, respectively, compared with the control group. In the KO-MFD-G and KO-MFD-F groups, these increases were attenuated and some were normalized (Figure 6b, 6d and 6f).
Figure 6.
General inflammation marker genes were differentially regulated between two mouse lines. (a) Tnfa mRNA in the liver tissues of wild-type and Ppara-null mice respectively. (b) Tnfa mRNA in the adipose tissues of the wild-type and Ppara-null mice respectively. (c, d) Icam1 mRNA level in the adipose and liver. (e) Srebp1 mRNA in the liver tissues of wild-type and Ppara-null mice respectively. (f) Srebp1 mRNA in the adipose tissues of the wild-type and Ppara-null mice respectively. The mRNA levels were measured by and normalized by 18S rRNA. The mRNA levels in the vehicle-treated control mice were set as 1 and the results expressed as mean ± SD (n=5, *: compared with WT-Con or KO-Con respectively; ^: compared with the WT-MFD or KO-MFD groups respectively)
In wild-type mice, the expression of three PPARα target gene mRNAs (Ehhadh, Cyp4a10 and Acox1) were increased by 47-fold, 34-fold, 8.6-fold in WT-MFD-G and 54-fold, 39-fold, 4.4-fold in WT-MFD-F mice. In contrast, no change in the WT-Con and WT-MFD groups were observed. In Ppara-null mice, none of these PPARα target genes was activated among the four groups (Supplementary figure 1). So the above phenotype modifications and fibrate actions in Ppara-null mice were independent of PPARα.
STAT3 pathway mediates MS development and the actions by fibrates
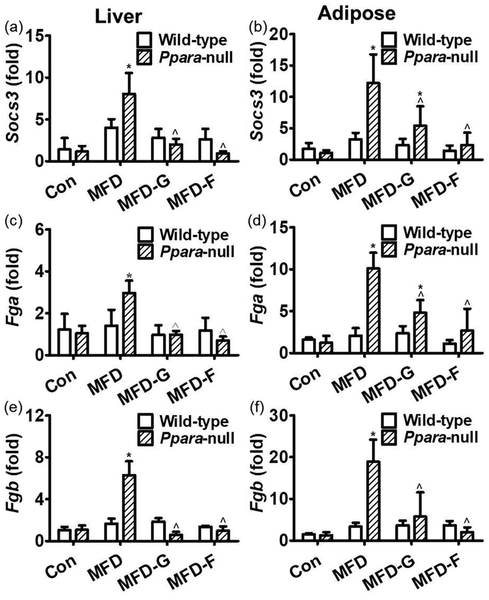
The expression of Socs3, Fga and Fgb were very specifically regulated by STAT3 pathway and were considered as STAT3 target genes to indicate the activation of this pathway [35]. In the liver tissues of the wild-type mice, there was no obvious difference of the Socs3, Fga and Fgb mRNA levels among the four groups. In the Ppara-null mice, Socs3 mRNA in the KO-MFD group was increased by 5.7-fold compared with the control group. Fga and Fgb mRNAs were increased by 2-fold and 4.7-fold, respectively, suggesting slight activation of the STAT3 pathway (Figure 7a, 7c and 7e). In adipose tissue, the Socs3, Fga and Fgb mRNAs were not changed in the WT-HF, WT-MFD-G and WT-MFD-F groups, suggesting that the STAT3 pathway was not activated in the wild-type mice. In Ppara-null mice, Socs3, Fga and Fgb mRNAs were increased by 10.3-fold, 7.4-fold and 13.5-fold, respectively, in the KO-MFD group. In the KO-MFD-G group, Socs3, Fga and Fgb mRNAs were decreased by 56%, 52%, and 70%, respectively, and in KO-MFD-F group they were decreased by 81%, 73%, 89%, respectively, indicating that the STAT3 pathway was strongly activated by MFD but inhibited by gemfibrozil and fenofibrate (Figure 7b, 7d and 7f).
Figure 7.
differential expressions of STAT3 target genes between two mouse lines. (a, b) Socs3 mRNA levels in the liver and adipose tissues respectively. (c, d) Fga mRNA levels in the wild-type and Ppara-null mice respectively. (e) Fgb mRNA in the liver tissues of wild-type and Ppara-null mice respectively. (f) Fgb mRNA in the adipose tissues of the wild-type and Ppara-null mice respectively. The mRNA levels were measured and normalized by 18S rRNA. The mRNA levels in the vehicle-treated control mice were set as 1 and the results expressed as mean ± SD (n=5, *: compared with the WT-Con or KO-Con groups respectively; ^: compared with the WT-MFD or KO-MFD groups respectively).
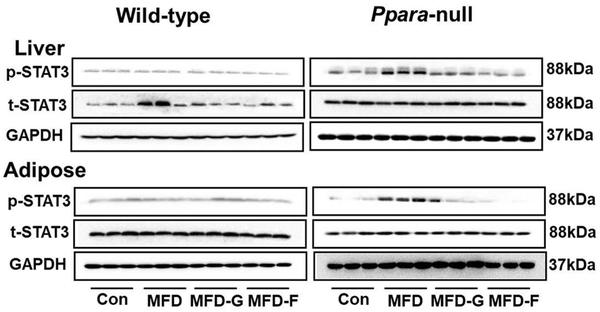
Western-blot analysis of the liver tissues revealed that the p-STAT3 pathway was not activated in livers of the wild-type groups. In Ppara-null mice, activation of p-STAT3 was clearly observed in the KO-MFD group. The inhibition was also observed in the KO-MFD-G and KO-MFD-F groups. In adipose tissue, the p-STAT3 pathway was not activated in the wild-type mice, but was significantly activated in the Ppara-null mice, and inhibited in the KO-MFD-G and KO-MFD-F mice (Figure 8). The NF-κB and JNK inflammatory pathways were also examined, but no activation was observed among the four groups in either mouse line (Supplementary figure 2).
Figure 8.
Western-blot analysis of STAT3 signaling in the liver and adipose tissue in two mouse lines. Data were from adipose samples collected 5 days after experience and 3/5 of the adipose tissues were randoly selected for western-blot analysis. GAPDH was used as a loading control.
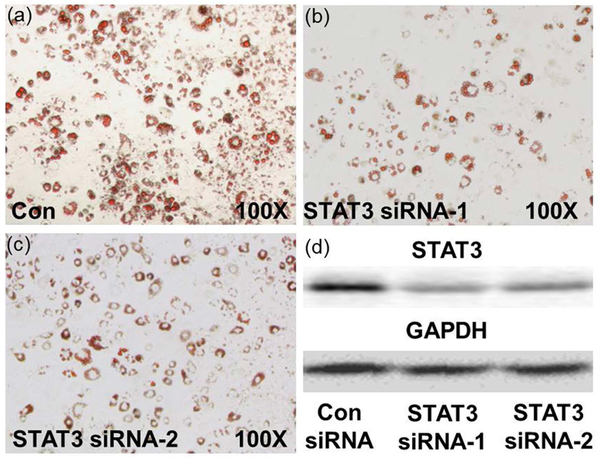
In 3T3-L1 adipogenic stem cells, Stat3 siRNA decreased the expression of STAT3 induced by the high glucose environment (Figure 9). As expected, a marked decrease in the number and volume of lipid droplets was observed when less STAT3 expression was found in fat cells. These data support a relationship between STAT3 activity and lipid accumulation in vivo (Figure 9a, 9b and 9c).
Figure 9.
STAT3 knockdown attenuated adipogenesis in 3T3-L1 adipogenic stem cells. (a, b, c) Oil red O staining of siRNA-transfected 3T3-L1 cells after 8 days of differentiation. (d) Reduction of STAT3 was confirmed by western-blot analysis 72 h after siRNA introduction.
Discussion
Presently, MS cannot be effectively treated with a single agent in the clinic. Physical exercise and diet control are the main strategies for MS prevention. The clinical agents including antihypertensive drugs, thiazolidinediones, sulfonylureas, statins, and fibrates have been used to treat individual MS symptom in single or combination therapy.[36] However, this treatment strategy increased the risk of side effects and drug-drug interactions.[1] Besides the action on lipid metabolism, fibrates were effective for improving glucose metabolism and decreasing blood pressure. In this study, gemfibrozil and fenofibrate were found to be effective for preventing MS development in the Ppara-null mouse model, as indicated by the inhibitory effects on the body weight, glucose tolerance, serum TG and TC, as well as the inflammation. This action of fibrates suggested their therapeutic potential for patients with high risk of MS development, independent of PPARα.
Few studies could be found regarding simultaneous treatment of all MS symptoms by fibrates. Most studies only investigated the effect against single MS symptom and their doses were designed based on clinical application (100 mg bid or tid, or 100–200 mg/kg).[37–39] In this study, gemfibrozil (0.375%) and fenofibrate (0.075%) were found to be effective against MS development. This dose was only 1/3–1/2 of the clinical dose level by comparing the trough concentration between mouse model and the clinical data.[40] Risk of adverse reactions would be considerably decreased if this low dose is proven to be effective as well in the clinic. So the dose-effect relationship found in this study was quite clinical relevant.
HFD (60% kcal fat) is the typical diet used to induce metabolic disease in mouse models.[29, 41] Sex difference, baseline fat mass and calorie levels (10% and 45% kcal fat) also affect body weight.[42] The reported roles of PPARα in development of MS symptoms under different treatment regimens were not the same. In a Sv/129 mouse model treated with HFD containing 27% safflower oil (59% kcal fat), the impaired insulin resistance in Ppara-null mice was twice that of wild-type mice.[43] However, in C57BL/6N mice fed a diet enriched with hydrogenated coconut oil, hyperinsulinemia was observed in wild-type mice, but not in Ppara-null mice.[44] In this study, the MFD exhibited discriminative power between two mouse lines in a 3-month study. Only Ppara-null mice developed MS as indicated by the changes in body weight, glucose tolerance, and serum and hepatic lipids. These responses were not observed in wild-type mice, supporting the view that PPARα is a protective factor in MS development. However, it remains to be investigated whether the different roles of PPARα in MS development are related with nutrition, genetic background or other unknown factors.
In C57BL/6 mice fed high fat diet, the hyperinsulinemia was lowered by the PPARα activator fenofibrate and ciprofibrate.[21] In Zucker diabetic fatty rats treated with fenofibrate, the insulin responses were improved.[19] These study illustrated the activation of PPARα can protect the MS symptom development. In Ppara-null mice and wild-type (C57BL/6N) mice treated with cholic acid, the bile acid homeostasis was disrupted in Ppara-null mice, indicating the protective role of basal PPARα.[45] In mice treated with ANIT, the liver inflammation lower in wild-type compared with that in Ppara-null mice, also suggesting the protective function of basal PPARα.[32] In mice fed a diet enriched with hydrogenated coconut oil, hyperinsulinemia was observed in wild-type mice, but not in Ppara-null mice. [29] In Ppara-null mice treated with HFD, the insulin sensitivity, blood pressure and intimal lesion were all improved.[46] In these studies, PPARα knockout became protective. Thus, the role of PPARα in MS development was controversial. In this study, all the results in the MFD groups of two mouse lines indicated that the basal PPARα played a protective role against MS development.
STAT3 plays a key role in body weight regulation and glucose homeostasis. Disruption of mouse neural STAT3 caused obesity, diabetes and thermal dysregulation.[47] In liver tissues of STAT3-deficient mice, insulin resistance was associated with increased expression of gluconeogenic genes. Restoration of hepatic STAT3 corrected the metabolic abnormalities and the alterations of hepatic expression of these genes. [48] Mice with an adipocyte-specific disruption of the STAT3 displayed increased adiposity and adipocyte hypertrophy, indicating a role for STAT3 in regulating body weight homeostasis.[49] In this study, by screening the inflammation pathways associated MS, no activation of NF-κB and JNK pathways were observed. Only STAT3 activation, its target gene expression, the inflammation in hepatic and adipose tissues correlated well with the MS symptoms between the wild type and Ppara-null mice, or among the four Ppara-null groups. The other pro-inflammatory pathways analyzed did not respond in any group of the two mouse lines. In 3T3-L1 adipogenic stem cells, Stat3 knockdown caused a decrease of lipid-containing droplets. Thus, it was quite reasonable to suppose the contributing role STAT3 signaling in MS development.
Fibrate effects for dyslipdemia were classically considered dependent on PPARα, however, PPARα-independent actions were reported recently. In streptozotocin-induced diabetic apolipoprotein-deficient mice receiving gemfibrozil, the anti-atherogenic action was found to be independent on changes of cholesterol and glucose metabolism.[26] In isolated mouse aortas and middle cerebral arteries, the tension of middle cerebral arteries was inhibited by GW7647, WY14643 and gemfibrozil. But it was negative in PPARα deficient mice, demonstrating that actions were PPARα-independent.[50] In mice treated with a PPARα activator, the smooth muscle cell proliferation, tissue factor expression and neointimal formation were observed only in Ppara-null mice.[51] In this study, MS symptoms developed in Ppara-null mice and they were inhibited by low dose of gemfibrozil and fenofibrate, respectively. These data suggested that the PPARα-independent mechanism of fibrate agents might be as important as the PPARα-dependent mechanisms, in agreement with previous reported viewpoint. [52]
One might suspect the clinical relevance of this study because wild type mouse did not develop MS and the effect could not be validated for clinical scenario. It usually took 3–6 months to induce MS using HFD in rodent models.[8, 9] This study not only found the PPARα-independent action against MS by fibrates, but also revealed the differentiation potential of MFD in wild-type and Ppara-null mice suggesting different sensitivity of tow mouse lines. If stronger or longer induction was challenged to wild-type mice, they were expected to develop MS and the effect of fibrates in this study would be probably observed. Fibrates will act against MS development when risk factors exist in the clinic, because the action was independent of PPARα.
Conclusion
Conclusively, wild-type and Ppara-null mice were treated with fibrates to investigate the action of fibrates on MS with the underlying mechanism being explored. The data suggested a protective role for PPARα against MS development via inhibition of STAT3 signaling. More importantly, low dose of clinical fibrate gemfibrozil and fenofibrate could inhibit MS development independent on PPARα. Considering the species-related difference of PPARα, investigations are warranted to prove this action of fibrates for clinical therapeutics.
Supplementary Material
Acknowledgments
This work was supported by the Ningbo Natural Science Foundation (Grant 2018A610253, 2018A610384); the K.C.Wong Magna Fund in Ningbo University and the National Cancer Institute Intramural Research Program.
Abbreviations
- DM
diabetes mellitus
- Fga
fibrinogen alpha chain
- Fgb
fibrinogen alpha chain
- GAPDH
glyceraldehyde-3-phosphate dehydrogenase
- HFD
high-fat diet
- HDL-C
high-density lipoprotein-cholesterol
- Icam1
intercellular adhesion molecule 1
- JAK2
Janus kinase 2
- MFD
medium-fat diet
- MS
metabolic syndrome
- p65
NF-κB p65 subunit
- PPARα
peroxisome proliferator-activated receptor α
- p-JNK
phosphor-c-Jun N-terminal kinase JNK
- p-p65
phosphor-hypothetical protein
- p-STAT3
phosphor-signal transducer and activator of transcription 3
- Socs3
suppressor of cytokine signaling 3
- Srebf1
sterol regulatory element binding transcription factor 1
- STAT3
signal transducer and activator of transcription 3
- T2DM
type 2 diabetes mellitus
- Tnfa
tumor necrosis factor
- TC
total cholesterol
- TG
triglycerides
- t-STAT3
total signal transducer and activator of transcription 3
- VSMCs
vascular smooth muscle cells
Footnotes
Declarations
Conflict of interest
The authors declare no conflicts of interest.
References
- 1.Lim S et al. Pharmacological treatment and therapeutic perspectives of metabolic syndrome. Rev Endocr Metab Disord 2014; 15: 329–41. [DOI] [PubMed] [Google Scholar]
- 2.Mozumdar A et al. Persistent increase of prevalence of metabolic syndrome among U.S. adults: NHANES III to NHANES 1999–2006. Diabetes Care 2011; 34: 216–9. [DOI] [PMC free article] [PubMed] [Google Scholar]
- 3.Ford ES et al. Prevalence of the metabolic syndrome among US adults: findings from the third National Health and Nutrition Examination Survey. Jama 2002; 287: 356–9. [DOI] [PubMed] [Google Scholar]
- 4.Howard BV et al. Prevention Conference VI: Diabetes and Cardiovascular disease: Writing Group I: epidemiology. Circulation 2002; 105: e132–7. [DOI] [PubMed] [Google Scholar]
- 5.Investigators DO et al. Long-term effect of rosiglitazone and/or ramipril on the incidence of diabetes. Diabetologia 2010; 54: 487–495. [DOI] [PubMed] [Google Scholar]
- 6.Defronzo RA et al. Pioglitazone for diabetes prevention in impaired glucose tolerance. N Engl J Med 2011; 364: 1104–1115. [DOI] [PubMed] [Google Scholar]
- 7.Lim S et al. Pharmacological treatment and therapeutic perspectives of metabolic syndrome. Reviews in Endocrine & Metabolic Disorders 2014; 15: 329–41. [DOI] [PubMed] [Google Scholar]
- 8.Catrysse L et al. Inflammation and the Metabolic Syndrome: The Tissue-Specific Functions of NF-κB. Trends in Cell Biology 2017; 27: 417–429. [DOI] [PubMed] [Google Scholar]
- 9.Han MS et al. JNK expression by macrophages promotes obesity-induced insulin resistance and inflammation. Science 2013; 339: 218–22. [DOI] [PMC free article] [PubMed] [Google Scholar]
- 10.Hirosumi J et al. A central role for JNK in obesity and insulin resistance. Nature 2002; 420: 333–6. [DOI] [PubMed] [Google Scholar]
- 11.Shi SY et al. Hepatocyte-specific deletion of Janus kinase 2 (JAK2) protects against diet-induced steatohepatitis and glucose intolerance. J Biol Chem 2012; 287: 10277–88. [DOI] [PMC free article] [PubMed] [Google Scholar]
- 12.Sos BC et al. Abrogation of growth hormone secretion rescues fatty liver in mice with hepatocyte-specific deletion of JAK2. Journal of Clinical Investigation 2011; 121: 1412–23. [DOI] [PMC free article] [PubMed] [Google Scholar]
- 13.Socha P et al. Nonalcoholic fatty liver disease as a feature of the metabolic syndrome. Rocz Panstw Zakl Hig 2007; 58: 129–37. [PubMed] [Google Scholar]
- 14.Zeng Z et al. Lycopene Improves Insulin Sensitivity through Inhibition of STAT3/Srebp-1c-Mediated Lipid Accumulation and Inflammation in Mice fed a High-Fat Diet. Exp Clin Endocrinol Diabetes 2017; 125: 610–617. [DOI] [PubMed] [Google Scholar]
- 15.Chen HL et al. Kefir peptides prevent high-fructose corn syrup-induced non-alcoholic fatty liver disease in a murine model by modulation of inflammation and the JAK2 signaling pathway. Nutr Diabetes 2016; 6: e237. [DOI] [PMC free article] [PubMed] [Google Scholar]
- 16.Gan L et al. Foxc2 coordinates inflammation and browning of white adipose by leptin-STAT3-PRDM16 signal in mice. 2018; 42: 252–259. [DOI] [PubMed] [Google Scholar]
- 17.MacDonald ML et al. Despite antiatherogenic metabolic characteristics, SCD1-deficient mice have increased inflammation and atherosclerosis. Arterioscler Thromb Vasc Biol 2009; 29: 341–7. [DOI] [PMC free article] [PubMed] [Google Scholar]
- 18.Noguchi T et al. Comparison of effects of bezafibrate and fenofibrate on circulating proprotein convertase subtilisin/kexin type 9 and adipocytokine levels in dyslipidemic subjects with impaired glucose tolerance or type 2 diabetes mellitus: results from a crossover study. Atherosclerosis 2011; 217: 165–70. [DOI] [PubMed] [Google Scholar]
- 19.Dana SL et al. Peroxisome proliferator-activated receptor subtype-specific regulation of hepatic and peripheral gene expression in the Zucker diabetic fatty rat. Metabolism Clinical & Experimental 2001; 50: 963. [DOI] [PubMed] [Google Scholar]
- 20.Song D et al. Gemfibrozil not fenofibrate decreases systemic glucose level via PPARalpha. Pharmazie 2016; 71: 205–12. [PubMed] [Google Scholar]
- 21.Guerremillo M et al. Peroxisome proliferator-activated receptor alpha activators improve insulin sensitivity and reduce adiposity. Journal of Biological Chemistry 2000; 275: 16638–16642. [DOI] [PubMed] [Google Scholar]
- 22.Phelps LE et al. Evidence of direct smooth muscle relaxant effects of the fibrate gemfibrozil. J Smooth Muscle Res 2010; 46: 125–42. [DOI] [PubMed] [Google Scholar]
- 23.Liu A et al. Relaxation of rat thoracic aorta by fibrate drugs correlates with their potency to disturb intracellular calcium of VSMCs. Vascul Pharmacol 2012; 56: 168–75. [DOI] [PubMed] [Google Scholar]
- 24.Phelps LE et al. Evidence of direct smooth muscle relaxant effects of the fibrate gemfibrozil. Journal of smooth muscle research = Nihon Heikatsukin Gakkai kikanshi 2010; 46: 125–42. [DOI] [PubMed] [Google Scholar]
- 25.Zhao X et al. PPAR-alpha agonist fenofibrate induces renal CYP enzymes and reduces blood pressure and glomerular hypertrophy in Zucker diabetic fatty rats. American Journal of Nephrology 2008; 28: 598. [DOI] [PubMed] [Google Scholar]
- 26.Calkin AC et al. Gemfibrozil decreases atherosclerosis in experimental diabetes in association with a reduction in oxidative stress and inflammation. Diabetologia 2006; 49: 766–74. [DOI] [PubMed] [Google Scholar]
- 27.Li F et al. Potential role of CYP1B1 in the development and treatment of metabolic diseases. Pharmacol Ther 2017; 178: 18–30. [DOI] [PMC free article] [PubMed] [Google Scholar]
- 28.Ning LJ et al. Nutritional background changes the hypolipidemic effects of fenofibrate in Nile tilapia (Oreochromis niloticus). Sci Rep 2017; 7: 41706. [DOI] [PMC free article] [PubMed] [Google Scholar]
- 29.Guerre-Millo M et al. PPAR-alpha-null mice are protected from high-fat diet-induced insulin resistance. Diabetes 2001; 50: 2809–14. [DOI] [PubMed] [Google Scholar]
- 30.Tordjman K et al. PPARα deficiency reduces insulin resistance and atherosclerosis in apoE-null mice. Journal of Clinical Investigation 2001; 107: 1025. [DOI] [PMC free article] [PubMed] [Google Scholar]
- 31.Tan Z et al. Geniposide Inhibits Alpha-Naphthylisothiocyanate-Induced Intrahepatic Cholestasis: The Downregulation of STAT3 and NF[Formula: see text]B Signaling Plays an Important Role. Am J Chin Med 2016; 44: 721–36. [DOI] [PubMed] [Google Scholar]
- 32.Dai M et al. Targeted Metabolomics Reveals a Protective Role for Basal PPARalpha in Cholestasis Induced by alpha-Naphthylisothiocyanate. 2018; 17: 1500–1508. [DOI] [PMC free article] [PubMed] [Google Scholar]
- 33.Zhang P et al. PIAS3, SHP2 and SOCS3 Expression patterns in Cervical Cancers: Relevance with activation and resveratrol-caused inactivation of STAT3 signaling. Gynecol Oncol 2015; 139: 529–35. [DOI] [PubMed] [Google Scholar]
- 34.Liu A et al. Saikosaponin d protects against acetaminophen-induced hepatotoxicity by inhibiting NF-kappaB and STAT3 signaling. Chem Biol Interact 2014; 223: 80–6. [DOI] [PMC free article] [PubMed] [Google Scholar]
- 35.Yuan Y et al. STAT3 stimulates adipogenic stem cell proliferation and cooperates with HMGA2 during the early stage of differentiation to promote adipogenesis. Biochem Biophys Res Commun 2017; 482: 1360–1366. [DOI] [PubMed] [Google Scholar]
- 36.Gandhi N et al. Effect of fibrate treatment on liver function tests in patients with the metabolic syndrome. SpringerPlus 2014; 3: 14. [DOI] [PMC free article] [PubMed] [Google Scholar]
- 37.Ueno H et al. Fenofibrate ameliorates insulin resistance, hypertension and novel oxidative stress markers in patients with metabolic syndrome. Obesity Research & Clinical Practice 2011; 5: e267. [DOI] [PubMed] [Google Scholar]
- 38.Liu SN et al. Long-term fenofibrate treatment impaired glucose-stimulated insulin secretion and up-regulated pancreatic NF-kappa B and iNOS expression in monosodium glutamate-induced obese rats: Is that a latent disadvantage? Journal of Translational Medicine 2011; 9: 176. [DOI] [PMC free article] [PubMed] [Google Scholar]
- 39.Š V et al. Hepatotoxic effects of fenofibrate in spontaneously hypertensive rats expressing human C-reactive protein. Physiological Research 2016; 65: 891. [DOI] [PubMed] [Google Scholar]
- 40.Dai M et al. Inhibition of JNK signalling mediates PPARalpha-dependent protection against intrahepatic cholestasis by fenofibrate. Br J Pharmacol 2017; 174: 3000–3017. [DOI] [PMC free article] [PubMed] [Google Scholar]
- 41.Jiang C et al. Disruption of hypoxia-inducible factor 1 in adipocytes improves insulin sensitivity and decreases adiposity in high-fat diet-fed mice. Diabetes 2011; 60: 2484–95. [DOI] [PMC free article] [PubMed] [Google Scholar]
- 42.Yang Y et al. Variations in body weight, food intake and body composition after long-term high-fat diet feeding in C57BL/6J mice. Obesity (Silver Spring) 2014; 22: 2147–55. [DOI] [PMC free article] [PubMed] [Google Scholar]
- 43.Neschen S et al. n-3 Fatty acids preserve insulin sensitivity in vivo in a peroxisome proliferator-activated receptor-alpha-dependent manner. Diabetes 2007; 56: 1034–41. [DOI] [PubMed] [Google Scholar]
- 44.Guerremillo M et al. PPAR-α–Null Mice Are Protected From High-Fat Diet–Induced Insulin Resistance. Diabetes 2001; 50: 2809. [DOI] [PubMed] [Google Scholar]
- 45.Li F et al. Metabolomics reveals an essential role for peroxisome proliferator-activated receptor alpha in bile acid homeostasis. J Lipid Res 2012; 53: 1625–35. [DOI] [PMC free article] [PubMed] [Google Scholar]
- 46.Tordjman K et al. PPARalpha deficiency reduces insulin resistance and atherosclerosis in apoE-null mice. J Clin Invest 2001; 107: 1025–34. [DOI] [PMC free article] [PubMed] [Google Scholar]
- 47.Gao Q et al. Disruption of Neural Signal Transducer and Activator of Transcription 3 Causes Obesity, Diabetes, Infertility, and Thermal Dysregulation. Proceedings of the National Academy of Sciences of the United States of America 2004; 101: 4661–6. [DOI] [PMC free article] [PubMed] [Google Scholar]
- 48.Inoue H et al. Role of STAT3 in regulation of hepatic gluconeogenic genes and carbohydrate metabolism in vivo. Nature Medicine 2004; 10: 168–174. [DOI] [PubMed] [Google Scholar]
- 49.Cernkovich ER et al. Adipose-specific disruption of signal transducer and activator of transcription 3 increases body weight and adiposity. Endocrinology 2008; 149: 1581–90. [DOI] [PMC free article] [PubMed] [Google Scholar]
- 50.Silswal N et al. PPARalpha-Independent Arterial Smooth Muscle Relaxant Effects of PPARalpha Agonists. PPAR Res 2012; 2012: 302495. [DOI] [PMC free article] [PubMed] [Google Scholar]
- 51.Peng Y et al. Peroxisome Proliferator-Activated Receptor alpha Plays an Important Role in the Expression of Monocyte Chemoattractant Protein-1 and Neointimal Hyperplasia after Vascular Injury. PPAR Res 2012; 2012: 970525–970525. [DOI] [PMC free article] [PubMed] [Google Scholar]
- 52.Chen H et al. Geniposidic acid protected against ANIT-induced hepatotoxity and acute intrahepatic cholestasis, due to Fxr-mediated regulation of Bsep and Mrp2. J Ethnopharmacol 2016; 179: 197–207. [DOI] [PubMed] [Google Scholar]
Associated Data
This section collects any data citations, data availability statements, or supplementary materials included in this article.


