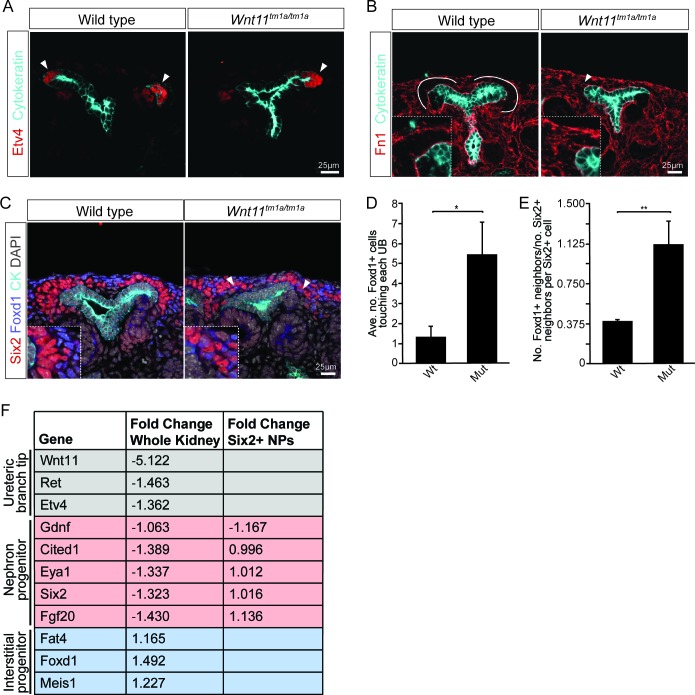
Figure 4. Nephron progenitors intermix with interstitial progenitors but no significant changes in gene expression are observed.
(A) E15.5 kidneys were sectioned and immunostained for the tip marker Etv4 (red) and cytokeratin (cyan). Distinct ureteric branch tip domains are still present in Wnt11 mutants as indicated (arrowheads). (B) E15.5 sections were stained for the matrix protein fibronectin (Fn1; red) and cytokeratin (cyan). Note the exclusion of fibronectin from the nephron progenitor niche in wild type animals (line marks boundary between the nephron progenitors and interstitial progenitors). In Wnt11tm1a/tm1a kidneys the fibronectin boundary is disrupted and staining observed in the nephron progenitor niche (arrowheads). Insets show zoomed view of the progenitor niche. (C) Immunolocalization of Foxd1 +interstitial progenitors (blue) in conjunction with Six2 +nephron progenitors (red) at E15.5 reveals mixing of the two cell populations in Wnt11 mutant kidneys (insets show zoomed view of cell mixing). Foxd1 +cells can infiltrate (arrowheads) the nephron progenitor niche and are found near the ureteric branch tips (cyan). (D) Quantitation of tissue sections immunostained for both Six2, Foxd1, and cytokeratin. There is an increase in the number of Foxd1 +cells touching the ureteric branch tips in Wnt11 mutants. 30 ureteric tip domains from n = 3 biological replicates were quantified. (E) Quantitation of Six2 cell neighbors. The number of Foxd1 +cells touching a Six2 +cell is divided by the number of Six2 +cells touching the same cell. In Wnt11 mutants a Six2 +cell is just as likely to have as many Foxd1 +neighbors as Six2 +neighbors. Three biological replicates were quantified, 10 Six2 +cells per sample. (F) Fold-changes associated with RNA-seq of either whole kidneys or Six2 +cells from wild type and Wnt11 mutant kidneys. The fold-change was calculated from the average of n = 6 for each genotype in whole kidney analysis and n = 3 for each genotype in the nephron progenitor analysis. Example genes which define each progenitor population (ureteric branch tip, nephron progenitor, and interstitial progenitor) are shown. No significant changes (>1.5 fold change) are observed. All error bars represent SEM. All significance values were determined by t-test. ns = p > 0.05, * = p < 0.05, ** = p < 0.01, *** = p < 0.001.


