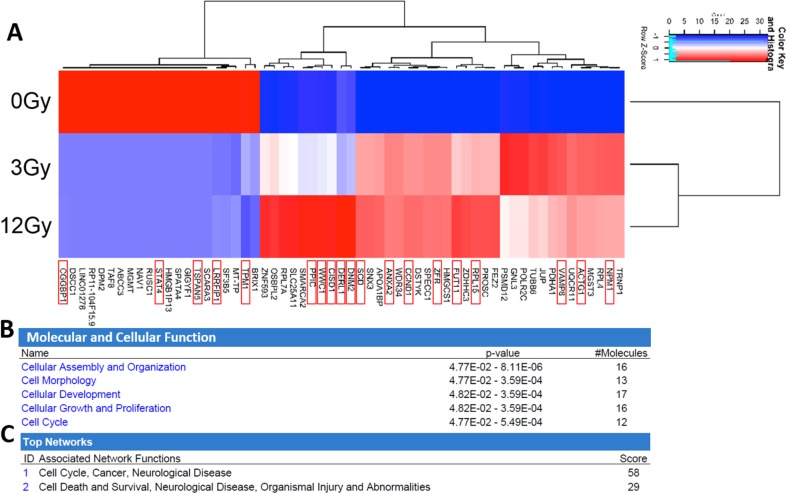
Figure 7. Analysis and comparison of mRNA contents within the non-radiation and radiation derived glioma exosomes.
(A) The change in expression levels of 59 mRNA were identified following irradiation (p<0.05). Distinct heat map profiles were generated for exosomes derived from cells exposed to 0Gy (control glioma exosomes), 3Gy (low radiation), and 12Gy (high radiation). mRNA that have been demonstrated to have oncogenic or tumor suppressive functionality are highlighted with a red box. There is clearly a dose response to the patterns of expression. Panels B-C: Ingenuity Pathway Analysis and comparison of mRNA contents within the non-radiation and radiation derived glioma exosomes. (B) Molecular and cellular function pathways most highly represented in the radiation derived exosomes (C) The mRNA networks most represented in the radiation derived exosomes.

