

Summary
How mitochondrial metabolism is altered by oncogenic tyrosine kinases to promote tumor growth is incompletely understood. Here, we show that oncogenic HER2 tyrosine kinase signaling induces phosphorylation of mitochondrial creatine kinase 1 (MtCK1) on tyrosine 153 (Y153) in an ABL-dependent manner in breast cancer cells. Y153 phosphorylation, which is commonly upregulated in HER2+ breast cancers, stabilizes MtCK1 to increase the phosphocreatine energy shuttle and promote proliferation. Inhibition of the phosphocreatine energy shuttle by MtCK1 knockdown or with the creatine analogue cyclocreatine decreases proliferation of trastuzumab-sensitive and -resistant HER2+ cell lines in culture and in xenografts. Finally, we show that cyclocreatine in combination with the HER2 kinase inhibitor lapatinib reduces the growth of a trastuzumab-resistant HER2+ patient-derived xenograft. These findings suggest that activation of the phosphocreatine energy shuttle by MtCK1 Y153 phosphorylation creates a druggable metabolic vulnerability in cancer.
In Brief:
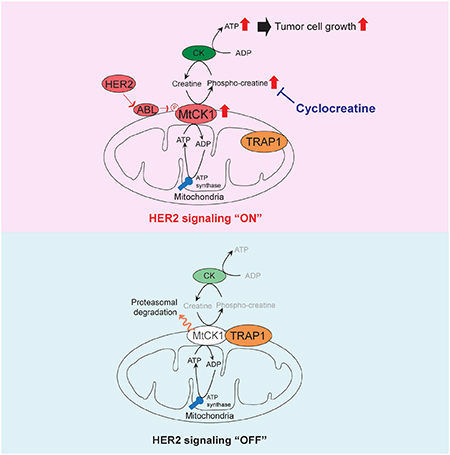
Kurmi et al. report that the phosphocreatine (PCr) energy shuttle is important for breast tumor metabolism and growth. This energy shuttle is activated through MtCK1 Y153 phosphorylation by HER2/ABL signaling axis. Using a creatine analogue cyclocreatine that inhibits the PCr energy shuttle, they demonstrate reduced growth of trastuzumab-resistant breast tumors in mice.
Introduction
Many important metabolic processes such as energy homeostasis, regulation of reactive oxygen species (ROS) levels, production of signaling metabolites, and synthesis of precursors for macromolecules occur in mitochondria (Wallace, 2012). Based on the concept that oncogene activation may upregulate mitochondrial metabolic pathways to meet cellular bioenergetic and biosynthetic needs in cancer cells as compared to normal cells, several drugs targeting mitochondrial metabolism are currently being assessed in clinical trials as potential anticancer agents (Weinberg and Chandel, 2015). However, targeting mitochondrial metabolism in cancer has been challenging due to toxicity in normal cells, which also depend on mitochondrial metabolism. Therefore, identifying tumor-specific mitochondrial metabolic alterations could aid in the design of drugs that can selectively target cancer cells while sparing normal tissue.
A variety of studies have shown that dysregulation of oncogenic tyrosine kinase (OTK) signaling can phosphorylate and activate a subset of cytosolic metabolic enzymes that promote tumor growth (Hitosugi and Chen, 2014). In contrast, few studies have explored the role of OTKs in regulating mitochondrial enzyme function to enhance tumor growth. A recent study reported that HER2, a member of the epidermal growth factor receptor (EGFR) family that is overexpressed and amplified in many types of human cancers (Scholl et al., 2001), alters mitochondrial metabolism (Ding et al., 2012), suggesting that HER2 might regulate mitochondrial enzymes. What remained unclear, however, is which mitochondrial protein(s) is a downstream target of HER2 signaling, how HER2 relays its signals to the mitochondria, and how the resulting mitochondrial changes contribute to cancer cell proliferation.
Mitochondrial creatine kinase 1 (MtCK1) is a mitochondrial protein that facilitates the phosphocreatine energy shuttle by transferring a phosphate group from mitochondrial ATP to the relatively smaller metabolite creatine (Cr). The resulting phosphocreatine (PCr), which can easily pass through the mitochondrial membrane, plays an important role in maintaining adequate phosphoryl energy reserves during energy fluxes in metabolically active cells (Wallimann et al., 2011). In particular, during high energy demand PCr can be quickly converted to ATP and Cr by cytosolic Cr kinase (CK) (Wallimann et al., 2011).
Here, we report that HER2 signaling, acting through ABL tyrosine kinase, induces MtCK1 tyrosine 153 (Y153) phosphorylation, which stabilizes MtCK1 and is upregulated in HER2+ breast cancer patient-derived xenografts (PDXs). Inhibition of MtCK1 by shRNA reduces PCr levels and proliferation in breast cancer cell lines and suppresses tumor formation in vivo. Although the HER2-directed monoclonal antibody trastuzumab has substantial activity against HER2+ breast cancer, intrinsic and acquired resistance to this agent remain problematic, underscoring the need to develop new therapeutic approaches. We now show that a small molecule, cyclocreatine, inhibits the HER2-activated PCr energy shuttle and exhibits antitumor activity against trastuzumab-resistant and -sensitive HER2+ breast cancers in vitro and in vivo. We also show that combined treatment of cyclocreatine with lapatinib is more effective than either cyclocreatine or lapaninb alone in patient-derived HER2+ trastuzumab-resistant xenograft tumor model in mice, providing a proof-of-concept that targeting tumor mitochondrial energy transfer could be an effective strategy not only to treat trastuzumab-resistant breast cancer but also to enhance the efficacy of lapatinib.
Results
HER2 signaling increases MtCK1 Y153 phosphorylation and MtCK1 levels
To identify potential metabolic targets of HER2 signaling in mitochondria, we combined two approaches: targeted metabolite profiling and organelle-specific phospho-proteomic analysis. To identify metabolites altered by HER2 signaling, we adapted a previously published HPLC-based method that detected high-energy phosphate metabolites (Vogt et al., 1998). We specifically focused on high-energy phosphate metabolites because 1) mitochondria produce many kinds of high-energy phosphate metabolites; and 2) we found that treatment of HER2+ BT474 cells with a small-molecule HER2 kinase inhibitor lapatinib (Arteaga et al., 2012) decreased ATP levels, suggesting that HER2 signaling may alter the levels of other energy metabolites (Figure S1A). HPLC analysis identified two peaks, which were preliminarily identified as PCr and ATP based on their reported retention time (Vogt et al. 1998), that were reduced by more than 20% with lapatinib treatment (Figure 1A). The peak assignment was then confirmed by spiking samples with authentic PCr and ATP standards (Figure S1B and S1C). We further validated our HPLC results with sensitive and comprehensive whole cell metabolomics analyses using high sensitivity capillary electrophoresis mass spectrometry. These steady-state metabolomic analyses showed that inhibition of HER2 with lapatinib significantly decreased PCr levels while the levels of arginine, which is a precursor of creatine metabolism, were increased by lapatinib treatment (Figures S1D and S1E and Tables S1 and S2). These results suggested that one or more of the metabolic steps that convert arginine to PCr, a high-energy phosphate metabolite, may be activated by HER2 signaling.
Figure 1. MtCK1 Y153 phosphorylation and levels are modulated by HER2 signaling.

(A) Chromatograms of BT474 cellular metabolites extracted from control and lapatinib (1 μM) treated cells for 2 hours at 37°C. Representative of three independent experiments, all of which showed similar results. (B) Cr kinase enzyme activity assays from the fractionated lysates of BT474 cells treated with vehicle control or 1 μM lapatinib for 2 hours at 37°C. The corresponding immunoblotting (WB) results of the fractionated samples with antibodies against MtCK1, anti-phospho-tyrosine (pTyr), PDHK1 (mitochondria marker), and β-actin (cytosol marker) are also shown. (C) Top: Immunoblots of lysates from 293T cells expressing vector control (−) and HER2 WT. Bottom: qRT-PCR results of MtCK1 mRNA in 293T cells expressing vector control (−) or HER2 WT. (D) Immunoblots of anti-Flag immunoprecipitates from cells expressing Flag-MtCK1 WT and Y153F mutant. (E) Immunoblots of cells treated with 1 μM lapatinib for 2 hours at 37°C. MtCK1 total protein levels were normalized between the control and lapatinib-treated samples to compare the levels of phospho-Y153 MtCK1 between the samples. All results are representative experiments of three independent replicates and P values were determined by a two-tailed Student’s t test (**P<0.01).
Next, to identify mitochondrial proteins phosphorylated on tyrosine, we performed a phosphoproteomic analysis on isolated mitochondria from BT474 cells and found that MtCK1 was phosphorylated on Y153 (Figure S1F and S1G), which is conserved across mammalian species such as monkey, rat, mouse, and dog (Figure S1H). Taken together, these observations raised the possibility that HER2 regulates PCr and ATP levels by phosphorylating MtCK1, which maintains energy metabolism by providing PCr from mitochondria to the cytosol.
To assess whether HER2 signaling affects MtCK1 functions, we analyzed MtCK1 levels and enzymatic activity in fractionated lysates from BT474 cells. These studies showed that lapatanib decreased MtCK1 levels and enzyme activity in the mitochondria-enriched fraction (Figure 1B). Conversely, overexpression of wild-type HER2 increased MtCK1 levels without increasing MtCK1 mRNA levels (Figure 1C), whereas kinase-dead HER2 (D845N) had no impact on MtCK1 levels (Figure S1I). These results showed that oncogenic HER2 signaling modulates MtCK1 protein levels.
To facilitate further analysis of the relationship between Y153 phosphorylation and MtCK1 action, we developed a phospho-Y153 (pY153) MtCK1 antibody and validated its specificity by showing that it recognizes 1) phosphorylated but not non-phosphorylated Y153 MtCK1 peptide (Figure S1J), and 2) Flag-MtCK1 WT but not Flag-MtCK1 Y153F immunoprecipitated from two HER2+ cell lines (Figure S1K). Importantly, an anti-pan-phosphotyrosine (pTyr) antibody failed to react with anti-Flag immunoprecipitates of MtCK1 Y153F from BT474 and SKBR3 cells, suggesting that MtCK1 Y153 is a major tyrosine phosphorylation site in these cell lines (Figure 1D). In further studies, lapatinib diminished the pY153 MtCK1 signal in both cell lines (Figure 1E), confirming that this site is phosphorylated as a consequence of HER2 signaling.
Y153 phosphorylation increases MtCK1 stability independent of MtCK1 catalytic activity
The results in Figures 1B and 1C showed that HER2 signaling modulates MtCK1 levels. To assess whether this was due to MtCK1 Y153 phosphorylation, we examined the effect of HER2 expression on levels of MtCK1 WT and MtCK1 Y153F in 293T cells. Immunoblotting showed that HER2 increased Flag-MtCK1 WT but not MtCK1 Y153F levels (Figure 2A and S2A). Consistent with this result, cycloheximide chase experiments demonstrated a reduced half-life for Flag-MtCK1 Y153F compared to Flag-MtCK1 WT in HER2+ SKBR3 cells (Figure 2B). HER2 expression also stabilized MtCK1 mutated to Phe (F) at Y158 (Y158F, Figure S2B), a site previously identified as an MtCK1 tyrosine phosphorylation site (Hornbeck et al., 2015), further indicating that Y153 is the key tyrosine phosphorylation site that regulates MtCK1 levels.
Figure 2. Stability of MtCK1 is enhanced by HER2 signaling independent of MtCK1 enzymatic activity.

(A) Top: Immunoblots of lysates from 293T cells co-expressing Flag-MtCK1 WT or Y153F along with vector control (−) or HER2 WT. Bottom: Densitometric quantification of four independent anti-Flag and anti-β-actin immunoblots based on the densitometric analysis showing a dose-dependent linear correlation of anti-Flag and anti-β-actin immunoblots of the lysates (Figure S2A). (B) Top: Immunoblots of SKBR3 cells stably expressing Flag-MtCK1 WT or Y153F that were treated with 200 μg/ml cycloheximide (CHX) for the indicated times. Bottom: Densitometric quantification of three independent anti-Flag and anti-β-actin immunoblots. (C) Left: MtCK1 enzyme activity in anti-Flag immunoprecipitates from 293T cells co-expressing Flag-MtCK1 WT, MtCK1 Y153F or MtCK1 E227L and HER2. Right: Immunoblots of the corresponding anti-Flag immunoprecipitates (IP) and whole-cell lysates (WCL) from 293T cells. (D) Immunoblots of 293T cells co-expressing either vector control (−) or HER2 and Flag-MtCK1 E227L. All results are representative experiments of three independent replicates. P values were determined by a two-tailed Student’s t test (*P<0.05, **P<0.01, ***p < 0.001).
Having demonstrated that Y153 phosphorylation affects MtCK1 stability, we next asked whether this phosphorylation also affects MtCK1 catalytic activity. Flag-tagged MtCK1 WT, MtCK1 Y153F, and catalytically inactive MtCK1 E227L (Eder et al., 2000), along with HER2, were ectopically expressed in 293T cells, immunopurified, and analyzed for MtCK1 catalytic activity and Y153 phosphorylation. Immunopurified Flag-MtCK1 WT and MtCK1 Y153F exhibited similar levels of enzymatic activity in an enzyme-coupled reaction and PCr production in vitro even though Flag-MtCK1 WT, but not Y153F, was tyrosine phosphorylated at Y153 (Figure 2C and S2C), suggesting that Y153 phosphorylation does not affect the enzymatic activity of MtCK1. Conversely, immunopurified Flag-MtCK1 E227L was tyrosine phosphorylated on Y153 (Figure 2C right) and upregulated by HER2 expression (Figure 2D) even though this mutant had little enzymatic activity and did not increase PCr production in vitro (Figure 2C left and S2C). These results indicate that Y153 phosphorylation stabilizes MtCK1 independent of MtCK1 catalytic activity.
Y153 phosphorylation disrupts TRAP1/MtCK1 interaction to prevent MtCK1 proteasomal degradation
To gain further mechanistic insight into how Y153 phosphorylation regulates MtCK1 stability, we generated “rescued” BT474 cell lines in which endogenous MtCK1 was stably depleted with shRNA and shRNA-resistant Flag-MtCK1 WT and -MtCK1 Y153F were stably expressed at endogenous levels (Figure 3A, left). Consistent with the results in Figure 2A, the level of Flag-MtCK1 WT was higher than Flag-MtCK1 Y153F despite similar mRNA levels (Figure 3A, left and right). Using these cells, we examined whether MtCK1 Y153F degradation is mediated through autophagic and/or proteasomal degradation pathways, two major pathways that contribute to mitochondrial protein degradation (Dikic, 2017). When rescued BT474 cells were treated with the autophagy inhibitors ammonium chloride (NH4Cl) or chloroquine, both of which blocked the degradation of autophagosomal marker LC3-II, the levels of MtCK1 WT and MtCK1 Y153F were unaffected (Figure S2D). This suggests that autophagy is not involved in MtCK1 Y153F degradation. To examine whether MtCK1 Y153F was degraded by the proteasome, we treated rescued BT474 cells expressing Flag-MtCK1 WT or MtCK1 Y153F with the proteasome inhibitor MG132, which increased MtCK1 Y153F but not MtCK1 WT levels (Figure 3B). Similar results were obtained with rescued SKBR3 cells (Figure S2E). These observations suggested that Y153 phosphorylation prevents MtCK1 degradation by the proteasome system.
Figure 3. MtCK1 Y153 phosphorylation promotes TRAP1 dissociation and protection from proteasomal degradation.

(A) Immunoblots of lysates (left) and qRT-PCR for MtCK1 mRNA (right) from “rescued” BT474 cells that stably express Flag-MtCK1 WT or Y153F with stable knockdown of endogenous MtCK1. (B) Immunoblots of “rescued” BT474 cells expressing Flag-MtCK1 WT and Y153F after treatment with MG132 for 6 h. (C) Immunoblots of anti-Flag immunoprecipitates and whole-cell lysates (WCL) from Flag-MtCK1 WT and Y153F “rescued” BT474 cells. (D) Immunoblots (WB) of anti-TRAP1 or anti-IgG immunoprecipitates and whole-cell lysates (WCL) from BT474 cells with or without lapatinib treatment (500 nM, 6 h). (E) Immunoblots (WB) of anti-Flag immunoprecipitates and WCL from 293T cells expressing Flag-MtCK1 WT expressing control vector (−) or HER2. (F) Immunoblots of lysates (left) and PCr levels (right) from 293T cells expressing vector control (−) or HER2 with or without stable knockdown of endogenous TRAP1. All results are representative experiments of three independent replicates. P values were determined by a two-tailed Student’s t test (*P<0.05).
Because polyubiquinitation can lead to proteasomal degradation, we next examined ubiquitination of Flag-MtCK1 WT and MtCK1 Y153F following MG132 exposure. If MtCK1 Y153F were degraded in a ubiquitin-dependent manner, ubiquitinated MtCK1 Y153F should accumulate in the presence of MG132. Contrary to this prediction, ubiquitinated MtCK1 was not detected (Figure S2F), suggesting that MtCK1 Y153F might be degraded by a ubiquitin-independent proteasomal process.
Proteins can be degraded in a ubiquitin-independent manner by 20S or 26S proteasome complexes if accessory proteins recognize and target substrates to the proteasome (Ben-Nissan and Sharon, 2014). To search for an accessory protein that binds to MtCK1 Y153F, we immunopurified Flag-MtCK1 WT and Flag-MtCK1 Y153F from rescued BT474 cells and performed LC-MS to identify associated proteins. This analysis showed that MtCK1 is associated with proteasome subunits, with MtCK1 Y153F preferentially binding many proteasome subunits (Table S3). In addition to the proteasome subunits, Flag-MtCK1 Y153F preferentially co-purified with TNF Receptor Associated Protein 1 (TRAP1), a mitochondrial protein previously reported to interact with the proteasome (Amoroso et al., 2012) and regulate turnover of the mitochondrial enzyme succinate dehydrogenase (SDH) (Rizza et al., 2016).
To verify the LC-MS data, we immunoprecipitated Flag-MtCK1 WT and Flag-MtCK1 Y153F from rescued BT474 cells and found that MtCK1 Y153F co-precipitated more endogenous TRAP1 than MtCK1 WT (Figure 3C and S2G). Consistent with this result, lapatinib also increased the interaction between endogenous MtCK1 and TRAP1 (Figure 3D), whereas HER2 overexpression increased MtCK1 Y153 phosphorylation and diminished the interaction between Flag-MtCK1 WT and TRAP1 in 293T cells (Figure 3E). Collectively, these data suggest that MtCK1 Y153 phosphorylation inhibits the MtCK1/TRAP1 interaction.
To further investigate the role of TRAP1 on MtCK1 stability, we knocked down TRAP1 with shRNA in 293T cells and examined MtCK1 levels in the absence and presence of HER2. TRAP1 knockdown increased the levels of endogenous MtCK1 (Figure 3F left) and Flag-MtCK1 (Figure S2H) in the absence of HER2 and abolished the HER2-dependent increase in endogenous MtCK1 and Flag-MtCK1 WT levels. Consistent with these results, TRAP1 knockdown augmented PCr levels idependent of HER2 expression (Figure 3F right). These findings suggest that TRAP1 is an accessory protein that regulates MtCK1 and PCr levels through the proteasome complex. However, knockdown of TRAP1 did not alter cell proliferation (Figure S2I), possibly because TRAP1 has multiple functions that both promote and suppress tumorigenesis in different contexts (Kang et al., 2007; Yoshida et al., 2013).
Collectively, the results in Figures 3 and S2 suggest that HER2-dependent phosphorylation of MtCK1 at Y153 leads to disruption of the MtCK1-TRAP1 interaction, thereby stabilizing MtCK1 by preventing its ubiquitin-independent proteasomal degradation.
ABL is the intermediate kinase that directly tyrosine phosphorylates MtCK1
To determine which tyrosine kinase phosphorylates MtCK1 to disrupt the TRAP1 interaction, we initially tested whether HER2 can directly phosphorylate MtCK1. Surprisingly, recombinant HER2 did not tyrosine phosphorylate purified MtCK1 (Figure S3A), raising the possibility that an intermediate tyrosine kinase catalyzes this modification.
To identify a potential intermediate kinase, we re-examined the mitochondrial phospho-proteomic data specifically looking for tyrosine kinases, and we found the highest peptide counts from ABL compared to other tyrosine kinases LYN, FYN and PTK6 (data not shown). To determine which of these kinases phosphorylates MtCK1, we performed in vitro tyrosine kinase assays with bacterially expressed and purified MtCK1 and recombinant tyrosine kinases purified from insect cells. Only ABL directly phosphorylated MtCK1 in vitro as detected by anti-pTyr as well as anti-pY153 MtCK1 antibodies, and blocking ABL catalytic activity with imatinib diminished Y153 phosphorylation in vitro (Figure 4A). Additional ABL in vitro kinase assays revealed that Flag-MtCK1 Y153F was phosphorylated by ABL on not only Y153 but also other tyrosines (Figures 4B and S3B). However, because Y153 was the major phosphorylation site in HER2+ cancer cells (Figure 1D), these additional phosphorylation events that occur in vitro are likely due to the fact that the normal regulatory constraints on ABL activity in cells have been lost in the in vitro assay reaction.
Figure 4. ABL directly phosphorylates MtCK1 at Y153.

(A) Immunoblots of an in vitro tyrosine kinase assay using recombinant ABL with purified recombinant MtCK1 WT protein. (B) Immunoblots of in vitro ABL kinase assay using recombinant ABL and MtCK1 WT or Y153F proteins. (C) Immunoblots of anti-Flag immunoprecipitates and WCL from 293T cells co-expressing Flag-MtCK1 WT and vector control (−), HER2 WT or ABL. (D) Immunoblots of BT474 cells treated with DMSO, or imatinib (20 βM), or lapatinib (500 nM) for 6 h. (E) Immunoblots of anti-Flag immunoprecipitates and WCL from BT474 cells treated with imatinib (10 βM) overnight. (F) Immunoblots of anti-TRAP1 or anti-IgG immunoprecipitates and WCL from BT474 cells with or without imatinib treatment (20 βM) for 6 h. (G) Immunoblots of anti-IgG control and anti-MtCK1 antibody immunoprecipitates and input lysate from BT474 cells. (H) Isolated mitochondria from BT474 cells were treated with 5 μg/mL proteinase K in the absence and presence of 1% Triton X-100 and immunoblotted for the indicated proteins. All immunoblots results are representative experiments of three independent replicates.
To examine whether ABL can phosphorylate other creatine kinase isoenzymes, we also performed in vitro ABL kinase assay with recombinant cytosolic creatine kinase (CKB); however, we did not observe any tyrosine phosphorylation of CKB (Figure S3C). Consistent with this result, Y153 is not conserved in cytosolic CKB or cytosolic CKM, both of which have have a negatively charged aspartic acid (D) in the corresponding position (Figure S3D), or in sarcomeric MtCK2, which has a charge-neutral glutamine (Q) in that position (Figure S3D). These results suggest that MtCK1 is the only creatine kinase isoenzyme that is regulated by Y153 phosphorylation.
Given that ABL is activated downstream of HER2 in breast cancer cells (Greuber et al., 2013), we further explored the role of ABL in the phosphorylation and regulation of MtCK1. ABL overexpression in 293T cells increased MtCK1 Y153 phosphorylation and MtCK1 levels compared to vector control cells (Figure 4C). Conversely, the ABL inhibitor imatinib was as effective as lapatinib in reducing endogenous MtCK1 levels in BT474 (Figure 4D) and SKBR3 cells (Figure S3E). Consistent with this finding, overexpression of wild-type ABL increased PCr levels and prevented the lapatinib-induced decrease in PCr in SKBR3 cells (Figure S3F). Imatinib also decreased Flag-MtCK1 WT Y153 phosphorylation in BT474 cells (Figure 4E) and blocked HER2-mediated MtCK1 upregulation in 293T cells (Figure S3G). These results demonstrate that the HER2-driven increase in MtCK1 levels requires ABL as an intermediate tyrosine kinase that phosphorylates MtCK1 on Y153.
Consistent with our observation that imatinib blocked MtCK1 Y153 phosphorylation, an event that disrupts the MtCK1-TRAP1 interaction, imatinib also induced MtCK1 binding to TRAP1 in BT474 cells (Figure 4F). Moreover, lapatanib and imatinib did not reduce MtCK1 levels in 293T cells expressing HER2 when TRAP1 was knocked down (Figure S3H), demonstrating that TRAP1 is required for MtCK1 loss when the HER2-ABL pathway is blocked. These findings further indicate that HER2- and ABL-dependent MtCK1 Y153 phosphorylation leads to TRAP1 dissociation and MtCK1 stablization.
To address how ABL phosphorylates MtCK1 in mitochondria, we performed two studies. First, we showed that endogenous ABL and MtCK1 co-immunoprecipitated with one another (Figure 4G and S3I). Second, we analyzed whether MtCK1, ABL and TRAP1 were localized in the same mitochondrial compartment by performing a proteinase K protection experiment using purified mitochondria from BT474 cells (Figure 4H). As controls for this experiment, we showed that the outer membrane marker TOM40 was completely digested by proteinase K in both the presence and absence of Triton X-100, whereas the inner membrane marker COX IV was only digested after solubilization of mitochondrial membranes with Triton X-100 (Figure 4H). Analysis of mitochondrial ABL and TRAP1 demonstrated, that in the absence of Triton X-100, both proteins were completely digested by proteinase K, indicating that ABL and TRAP1 are localized in the outer mitochondrial membrane. In the same experiments, MtCK1 was partially digested by proteinase K in the absence of Triton X-100 and completely digested in the presence of Triton X-100 (Figure 4H), indicating that some portion of the total MtCK1 protein was also localized in the outer mitochondrial membrane. Taken together, these results suggest that a portion of total MtCK1 is accessible to cytosolic or mitochondrial outer membrane-localized ABL.
To examine whether cytosolic ABL can phosphorylate MtCK1 Y153, we expressed BCR-ABL fusion kinase, which is localized exclusively in the cytosol (Wetzler et al., 1993), with Flag-MtCK1 in 293T cells and examined Y153 phosphorylation. Unlike ABL, BCR-ABL did not phosphorylate Y153 (Figure S3J), suggesting that cytosolic ABL does not contribute to Y153 MtCK1 phosphorylation. Therefore, it is likely that Y153 phosphorylation is mediated through the direct interaction of MtCK1 and ABL in the outer mitochondrial membrane.
To further study the mitochondrial localization of ABL and MtCK1, we performed confocal microscopy experiments on BT474 cells stained with mitotracker (red), anti-ABL antibody (green) and anti-MtCK1 antibody (blue) (Figure S3K). The mitotracker and ABL imaging results showed that ABL is localized to the mitochondria (Figure S3K, top panels) and the RGB merged image showed multiple white dots representing co-localization of ABL and MtCK1 with mitotracker (Figure S3K, bottom panel), further supporting our finding that ABL binds to MtCK1 in the outer mitochondrial membrane.
MtCK1 Y153 phosphorylation enhances bioenergetics and proliferation in HER2+ breast cancer cells
To assess whether MtCK1 has a role in cancer cell proliferation, we downregulated MtCK1 and assessed proliferation and PCr levels. We found that MtCK1 knockdown decreased PCr levels and reduced the proliferation of BT474 and SKBR3 cells, two cell lines with high HER2 expression (Figure 5A and S4A). We also found that the proliferation defect was rescued by the addition of PCr to the culture media (Figure 5B), demonstrating that antiproliferative effects of MtCK1 knockdown are due to reduced PCr levels. Knockdown of MtCK1 also decreased the mitochondrial oxygen consumption rate (OCR) under basal conditions as well as the maximum mitochondrial respiratory capacity assessed by measuring OCR after stimulation with the uncoupling agent carbonyl cyanide-p-trifluoromethoxyphenylhydrazone (FCCP) (Figure 5C). Steady state ATP levels, but not ADP levels, were also decreased by MtCK1 knockdown (Figures 5D and 5E). These findings demonstrate that MtCK1 promotes cell proliferation and mitochondrial respiration.
Figure 5. MtCK1 and its phosphorylation at Y153 is important for PCr levels, mitochondrial respiration and proliferation.

(A) Left: HPLC analysis of PCr levels with or without MtCK1 knockdown in BT474 cells with the corresponding immunoblots. Right: Proliferation of cells with or without MtCK1 knockdown. (B) Proliferation assay results of BT474 with or without knockdown of MtCK1 culture with addition of H2O or 0.5 mM PCr in the culture media for 5 days. (C) Mitochondrial oxygen consumption rate (OCR) of BT474 cells with or without MtCK1 knockdown under basal conditions and in response to oligomycin (1 μM), FCCP (1 μM) and rotenone/antimycin A (1 μM). (D & E) HPLC analysis of ATP levels (D) and ADP levels (E) in BT474 cells with or without MtCK1 knockdown. (F) HPLC analysis of cellular PCr levels in Flag-MtCK1 WT and Y153F “rescued” BT474 cells. (G) Proliferation of Flag-MtCK1 WT and Y153F “rescued” BT474 cells along with vector control BT474 cells. (H & I) Immunoblots of lysates (H) and HPLC analysis of cellular PCr levels (I) from BT474 and BT474-R cells. All results represent experiments of three independent replicates with error bars ± standard deviation of 3 independent measurements. P values were determined by a two-tailed Student’s t test. *P<0.05, **P<0.01.
We next investigated the role of Y153 phosphorylation on the PCr energy shuttle and on cancer cell proliferation using the rescued BT474 cell lines with Flag-MtCK1 WT and MtCK1 Y153F (see Figure 3A). Cells expressing Flag-MtCK1 Y153F contained lower levels of PCr and grew more slowly compared to cells expressing Flag-MtCK1 WT (Figures 5F and 5G). These observations, along with the results in Figure 3, suggest that MtCK1 Y153 phosphorylation stabilizes MtCK1, which increases PCr levels and promotes proliferation in HER2+ breast cancer cells.
To investigate the role of MtCK1 in trastuzumab-resistant breast cancer cells, we created two trastuzumab-resistant cell line models by exposing BT474 and SKBR3 cells to increasing concentrations of trastuzumab (Figure S4B). Analyses showed that the BT474-R cells had increased levels of phosphorylated HER2 and total MtCK1 (Figure 5H), as well as a corresponding increase in PCr (Figure 5I) compared to parental BT474 cells. In contrast, the levels of p-HER2 and MtCK1 were not altered in SKBR3-R cells compared to parental SKBR3 cells (Figure S4C), indicating that the mechanism of resistance is not through an increase in HER2 signaling. Nonetheless, SKBR3-R cells exhibited increased levels of both basal and maximum mitochondrial respiratory capacities (Figure S4D).
To examine whether MtCK1 is still necessary for proliferation of trastuzumab-resistant cell lines, we depleted MtCK1 from BT474-R and SKBR3-R cells. We also depleted MtCK1 in MDA-MB-453 cells, which are intrinsically resistant to trastuzumab and displayed diminished phosphorylation of EGFR Y1173 and HER3 Y1289 upon trastuzumab exposure (Wang et al., 2011), suggesting an alternative mode of resistance to trastuzumab in MDA-MB-453 cells. In all three trastuzumab-resistant cell lines, MtCK1 depletion reduced proliferation, suggesting that MtCK1 is important for proliferation in HER2+ breast cancer cell lines that have acquired trastuzumab by different mechanisms (Figures S4E–G).
MtCK1 Y153 is phosphorylated in HER2+ breast cancer clinical samples
To determine whether MtCK1 Y153 is phosphorylated in HER2+ breast cancers, we examined total MtCK1 and phospho-Y153 levels in a panel of HER2+ trastuzumab-sensitive and -resistant breast cancer patient-derived xenograft (PDX) tumors by immunoblotting (Figure 6A). We also included normal breast tissues and triple-negative breast cancer PDX tumors for comparison. This analysis yielded several important observations. First, MtCK1 was highly expressed in five of the six HER2+ PDX tumors and in some triple-negative PDX tumors, whereas there was no detectable MtCK1 in any of the normal breast samples (Figure 6A). Second, MtCK1 Y153 was highly phosphorylated in all HER2+ PDX tumors that expressed MtCK1, but not in triple-negative PDX tumors (Figure 6A), suggesting that MtCK1 Y153 phosphorylation is specific to HER2+ PDX tumors. Third, HER2+ PDX tumors #4–7, which were generated from patients whose tumors were resistant to trastuzumab, exhibited higher MtCK1 Y153 phosphorylation (Figure 6A).
Figure 6. The PCr energy shuttle is a metabolic vulnerability in HER2+ breast cancer.

(A) Immunoblots of three normal breast tissue lysates (#1-#3), six HER2+ patient-derived xenograft (PDX) tumor lysates (#4-#9), five TNBC PDX tumor lysates (#10-#14). (B) Tumor volumes in NSG mice (N=5) with PDX #4 cells with or without MtCK1 knockdown. Each dot represents tumor volume in an individual mouse with error bars ± standard deviation. Immunoblots of lysates from the corresponding cells are also shown. (C) Structures of Cr and Cyclo-Cr. (D) HPLC analysis of metabolites extracted from SKBR3-R cells treated with either water or Cyclo-Cr (1 mM) overnight. The experiment shown is representative of three independent experiments, all of which showed similar results. (E) Clonogenic assay results of breast cancer cell lines treated with Cyclo-Cr. (F) Cell proliferation assay results of SKBR3-R treated with Cyclo-Cr and/or PCr. (G) Cell proliferation assay results of normal primary mammary epithelial cells up to 6 mM of CCr. Error bars in E-G ± standard deviation of 3 independent measurements. P values were determined by a two-tailed Student’s t test. ***P<0.001.
To examine the effect of MtCK1 knockdown on proliferation in vitro and tumor growth in vivo, we used trastuzumab-resistant HER2+ PDX #4, which exhibited the highest MtCK1 Y153 phosphorylation (Figure 6A). MtCK1 knockdown reduced proliferation of PDX #4 in cell culture and suppressed the growth of this PDX tumor in mice (Figure S5A and 6B), suggesting the importance of MtCK1 in trastuzumab-resistant breast cancer growth. In contrast to PDX #4, MtCK1 knockdown in triple-negative breast cancer PDX #14, which expressed MtCK1 (Figure 6A), did not decrease cell proliferation (Figure S5B), suggesting that the PCr energy shuttle pathway is not necessary for proliferation in this tumor model. Taken together, these results raise the possibility that MtCK1 Y153 phosphorylation regulates a metabolic pathway that is important in HER2+ breast cancers.
Cyclocreatine disrupts the PCr energy shuttle in cells
The observation that knocking down MtCK1 reduced the proliferation of HER2+ cell lines and PDX models, prompted us to ask whether it is possible to therapeutically target the PCr energy shuttle. To address this question, we first treated trastuzumab-sensitive and -resistant BT474 and SKBR3 cells with β-guanidinopropionic acid (β-GPA) (Figure S5C), a Cr analogue frequently reported to inhibit Cr metabolism (Oudman et al., 2013). β-GPA decreased proliferation of these cell lines, but only at millimolar concentrations, likely due to low cell penetrance caused by the hydrophilic carboxylic group (Figures S5C and S5D). A membrane permeable ethyl ester of β-GPA showed increased cell permeability (Figure S5E) and a 3-fold lower IC50 against breast cancer cell lines (Figure S5F). However, the inhibitory effect of β-GPA on cell proliferation was not rescued by PCr (Figure S5G), suggesting that β-GPA might be decreasing proliferation through off-target effects.
We next tested cyclocreatine (Cyclo-Cr, Figure 6C), another Cr analogue that blocks Cr metabolism and that accumulates in cells at concentrations similar to the Cyclo-Cr concentrations in the culture media (data not shown). Our analysis indicated that Cyclo-Cr is an excellent substrate for MtCK1 in vitro (Figure S5H). Consistent with an earlier report showing that phospho-cyclocreatine (pCyclo-Cr), the product of the reaction, acts as a pseudosubstrate inhibitor for CK that disrupts the PCr energy transfer (Boehm et al., 1996) (Figure S5I), we observed that pCyclo-Cr accumulated and PCr levels dramatically decreased in cells treated with Cyclo-Cr (Figure 6D).
The PCr energy shuttle is a metabolic vulnerability in trastuzumab-sensitive and -resistant HER2+ breast cancers
We first assessed the effects of Cyclo-Cr on the proliferation of trastuzumab-sensitive and -resistant HER2+ breast cancer cells. Using BT474-R, SKBR3-R and MDA-MB-453 cells, we observed that all three trastuzumab-resistant lines (Figure S4B) were more sensitive to Cyclo-Cr than the trastuzumab-sensitive cells (Figure 6E). Importantly, the proliferation defects in Cyclo-Cr-treated cells were rescued by adding PCr to the culture media (Figure 6F), indicating that the inhibitory effect of Cyclo-Cr was due to the inhibition of the PCr energy shuttle. We also tested Cyclo-Cr in a 3-dimensional organoid culture with trastuzumab-resistant PDX #4 and found that Cyclo-Cr inhibited organoid growth of PDX #4 with an IC50 of 1.74 mM (Figure S5J). Notably, normal breast epithelial cells were not affected by up to 6 mM Cyclo-Cr (Figure 6G), suggesting that blocking the PCr energy shuttle may have selective antitumor activity against HER2+ tumors.
Next, we performed a whole-cell steady state metabolomic analysis of BT474 cells under acute (4 hr) and prolonged (24 hr) Cyclo-Cr exposure and measured the concentrations of 116 metabolites involved in creatine, glycolytic, pentose phosphate, tricarboxylic acid (TCA) cycle, nucleotide synthesis, urea cycle pathways, as well as metabolites involved in polyamine, glutathione, nicotinamide, choline, and amino acid metabolism. This analysis showed a time-dependent decrease in the phosphocreatine energy shuttle and in TCA cycle metabolites similar to what we observed in lapatinib-treated BT474 cells, demonstrating the importance of MtCK1 in the bioenergetics of cancer cells and suggesting that lapatinib’s effects on these metabolic events are largely due to altering MtCK1 functions (Tables S1 and S2). As shown in Figure S6A, ATP and PCr levels were significantly decreased by Cyclo-Cr. Consistent with this, we found that Cyclo-Cr caused a time-dependent decrease in the basal and maximum respiratory capacities of BT474 cells (Figure S6B). Similar results were obtained from trastuzumab-resistant SKBR3-R and MDA-MB-453 cells (Figures S6C and S6D). These results show that Cyclo-Cr inhibits the PCr energy shuttle pathway and reduces mitochondrial respiratory activity in trastuzumab-sensitive and -resistant breast cancer cells.
To examine whether the difference in Cyclo-Cr sensitivity of HER2+ breast cancer cells also occurred in a triple-negative breast cancer cell line we examined MDA-MB-468 cells. We found that MtCK1 levels were lower, while MtCK1 mRNA levels were higher, in MDA-MB-468 cells compared to BT474 cells, suggesting that MtCK1 is stabilized in HER2+ BT474 cells compared to triple-negative MDA-MB-468 cells (Figure S6E). Consistent with these findings, we observed that BT474 cells were more sensitive to the antiproliferative effects of cyclocreatine compared to MDA-MB-468 cells (Figure S6F). These results support the observation that HER2 signaling creates a metabolic dependency, which can be targeted with cyclocreatine, by increasing MtCK1 stability in breast cancer cells.
The PCr energy shuttle is important for trastuzumab-resistant HER2+ breast cancers in vivo
To build on the previous results, we assessed whether Cyclo-Cr has antitumor activity in trastuzumab-resistant BT474-R cell line xenografts and in HER2+ PDX models. Based on our HPLC analysis results showing that Cyclo-Cr is stable in water for at least 5 days (data not shown), Cyclo-Cr was administered via drinking water at a concentration of 0.3% (w/v), which is equivalent to 500 mg/kg/day. Cyclo-Cr treatment significantly inhibited growth of the trastuzumab-resistant BT474-R and PDX #4 tumor models in mice (Figure 7A and 7B, top), which was accompanied by the accumulation of 2.0 ± 0.1 mM Cyclo-Cr in the BT474-R tumor and a decrease in intratumoral PCr levels (Figure 7A, bottom). Notably, the intratumoral Cyclo-Cr concentration was close to the IC50 of Cyclo-Cr in BT474-R cells as assessed in clonogenic assays (Figure 6E). Similarly, the Cyclo-Cr concentration in PDX #4 tumors reached 3.1± 0.24 mM, while intratumoral PCr levels were significantly decreased upon Cyclo-Cr treatment (Figures 7B, bottom). There was no weight loss in mice over the 40-day treatment period (Figure S6G), and complete blood count (CBC) analyses showed no hematological toxicity (Tables S4 and S5).
Figure 7. PCr energy shuttle is a metabolic vulnerability in HER2+ breast cancer cells in vivo.

(A) Tumor growth in nude mice with BT474-R tumors treated with 0.3% Cyclo-Cr in drinking water versus regular drinking water. The Cyclo-Cr and PCr concentrations in the harvested BT474-R tumors determined by HPLC analysis are also shown below. N=8 in each group. (B) Tumor growth of HER2+ PDX #4 in NSG mice treated with 0.3% Cyclo-Cr in drinking water versus regular drinking water. The Cyclo-Cr and PCr concentrations in harvested PDX #4 tumors determined by HPLC analysis are also shown below. N=6 in each group. (C) Left: Tumor growth in NSG mice with trastuzumab-resistant HER2+ PDX #4 under various drug combinations (a total of 6 groups; control, Cyclo-Cr alone, lapatinib alone, Cyclo-Cr plus PCr, Cyclo-Cr plus lapatinib, and Cyclo-Cr plus lapatinib plus PCr). Cyclo-Cr was administered in drinking water at 0.3%, lapatinib was administrated orally at 50 mg/kg/day and PCr was administered at 400 mg/kg/day intraperitoneally. Right: Bar graphs represent tumor volume in mice with various treatments at day 20. N=9 in each group. P values were determined by a two-tailed Student’s t test. *P<0.05, **P<0.01, ***P<0.001.
Next, we tested the antitumor activity of Cyclo-Cr with lapatinib on trastuzumab-resistant HER2+ PDX #4 tumors. Also, to evaluate specificity of the antiproliferative effects of Cyclo-Cr, we assessed whether PCr supplementation reversed the activity of Cyclo-Cr in this PDX model. HER2+ PDX #4 tumors were established in mice and were treated with vehicle control, Cyclo-Cr alone, lapatinib alone, Cyclo-Cr plus PCr, Cyclo-Cr plus lapatinib, and Cyclo-Cr plus lapatinib plus PCr. Cyclo-Cr was administered in drinking water at 0.3%, lapatinib was administrated orally at 50 mg/kg/day and PCr was administered at 400 mg/kg/day intraperitoneally. Combined treatment with lapatinib and Cyclo-Cr was significantly more effective than either Cyclo-Cr or lapatinib alone. Importantly, PCr reversed the antiproliferative effects of Cyclo-Cr as a single agent and in combination with lapatinib (Figure 7C). Overall, these preclinical studies suggest that the PCr energy shuttle may be a druggable metabolic dependency in HER2+ breast cancer.
Discussion
Activation of MtCK1 and the PCr energy shuttle may be a common event in tumors. Indeed, a recent report showed that the oncogene EVI-1 transcriptionally upregulates MtCK1 to enhance leukemia cell survival and that down regulation of creatine metabolism suppressed mitochondrial respiration, ATP production, and leukemic cell growth (Fenouille et al., 2017). In that study, knockdown of MtCK1 altered a set of metabolites in leukemia cells that was similarly altered in our study when HER2+ breast cancer cells were treated with Cyclo-Cr (Table S2). For example, in both leukemia and HER2+ breast cancer cells, inhibition of MtCK1 decreased nucleoside triphosphates such as ATP, GTP, and UTP, but not nucleoside monophophates such as AMP and GMP. This might be due to the fact that inhibition of MtCK1 disrupts high-energy phosphate transfer system in cells. In addition, levels of a TCA metabolite malate were decreased by inhibition of MtCK1 in both cancer types, which might be because of the decreased mitochondrial respiratory capacity in cells with Cyclo-Cr treatment or MtCK1 knockdown.
Additionally, analysis of the TCGA and GTEx datasets from 33 different types of cancer using GEPIA (Gene Expression Profiling Interactive Analysis), a web-based tool (Tang et al., 2017), showed that MtCK1 genes (CKMT1A or CKMT1B) are transcriptionally upregulated in multiple cancers, including breast invasive carcinoma (BRCA), bladder urothelial carcinoma (BLCA), lung adenocarcinoma and small cell carcinomas (LUAS and LUSC), stomach adenocarcinoma (STAD), and ovarian cancer (OV) (Figure S7A). Finally, in breast, lung, and gastric cancers, increased CKMT1A mRNA and MtCK1 protein or activity levels are associated with a poor prognosis (Cimino et al., 2008; DeLuca et al., 1981; Kanemitsu et al., 1984; Qian et al., 2012).
Our findings suggest that the PCr energy shuttle is a commonly activated metabolic pathway in HER2+ breast cancer cells that sustains energy levels for rapid growth and proliferation. While many types of cancer exhibit the Warburg effect, which consists of increased glucose uptake, enhanced lactate production, and decreased tricarboxylic acid oxidation in mitochondria despite the presence of oxygen, recent studies have shown the importance of mitochondrial ATP production in breast cancer cells (Cazzaniga and Bonanni, 2015; Diers et al., 2012). Our findings indicate that once ATP is produced in mitochondria, it is equally important for breast cancer cells to transfer energy from mitochondria to the cytosol for maintenance of various biochemical processes.
In summary, our study revealed that MtCK1 stabilization by Y153 phosphorylation is a key molecular mechanism underlying the intersection between HER2 signaling and mitochondrial energy metabolism and also showed that the resulting enhanced PCr energy transfer creates a druggable metabolic liability in HER2+ breast cancer (Figure S7B).
Limitations of study
As our study has been performed in breast cancer cells, it still remains unclear whether Y153 phosphorylation-dependent regulation of MtCK1 occurs in other types of cancers. Also, it is possible that other signaling pathways than HER2/ABL signaling may contribute to increase in PCr energy shuttle, which is not evaluated in this study. Lastly, even though Cyclo-Cr has been used as a dietary sport supplement, with healthy individuals ingesting grams of Cyclo-Cr in sports drinks, its maximum tolerated dose has not yet been determined in human. We observed anti-tumor activity of Cyclo-Cr at relatively higher concentration in vitro (sub-millimolar to millimolar) and in vivo (approximately 500 mg/kg) as a single agent compared to conventional anti-cancer drugs. Therefore, it is important to conduct clinical studies to examine whether such high concentration of Cyclo-Cr can be achieved in human without obvious toxicity. Another path for future clinical trials might be to combine lower doses of Cyclo-Cr with other drugs that can potentially synergize its anti-tumor activity, as we demonstrated that Cyclo-Cr treatment enhances the efficacy of lapatinib in mice.
STAR Methods:
KEY RESOURCES TABLE
| REAGENT or RESOURCE | SOURCE | IDENTIFIER |
|---|---|---|
| Antibodies | ||
| Mouse monoclonal anti-β-actin antibody | Sigma | Cat# A1978, RRID:AB_47669 |
| Mouse monoclonal ANTI-FLAG® M2 antibody | Sigma | Cat# F3165, RRID:AB_259529 |
| Mouse monoclonal anti-c-Abl antibody | Sigma | Cat# A5844, RRID:AB_258262 |
| Rabbit Polyclonal Anti-CKMT1A Antibody | Proteintech | Cat# 15346–1-AP, RRID:AB_2081073 |
| Rabbit Polyclonal Anti-CKB Antibody | Proteintech | Cat# 15137–1-AP, RRID:AB_2080878 |
| Rabbit Polyclonal Anti-CoxIV Antibody | Proteintech | Cat# 11242–1-AP, RRID:AB_2085278 |
| Mouse monoclonal anti-MtCK 1 antibody | MyBioSource | Cat# MBS 475046 |
| Mouse monoclonal anti-HER2/Neu antibody | Calbiochem | Cat# OP15, RRID:AB_2099416 |
| Mouse monoclonal anti-p-Tyr (PY99) antibody | Santa Cruz Biotechnology | Cat# sc-7020, RRID:AB_628123 |
| Mouse monoclonal anti-Ub (P4D1) antibody | Santa Cruz Biotechnology | Cat# sc-8017, RRID:AB_628423 |
| Mouse monoclonal anti-c-Abl (24–11) antibody | Santa Cruz Biotechnology | Cat# sc-23, RRID:AB_626775 |
| Mouse monoclonal anti-uMtCK (C-8) antibody | Santa Cruz Biotechnology | Cat# sc-374080, RRID:AB_10917038 |
| Rabbit polyclonal anti-Fyn (FYN3) antibody | Santa Cruz Biotechnology | Cat# sc-16, RRID:AB_631528 |
| Mouse monoclonal anti-Tom40 (D-2) antibody | Santa Cruz Biotechnology | Cat# sc-365467, RRID:AB_10847086 |
| Rabbit monoclonal anti-LC3B (D11) antibody | Cell Signaling Technology | Cat# 3868, RRID:AB_2137707 |
| Rabbit monoclonal anti-PDHK 1 antibody | Cell Signaling Technology | Cat# 3820, RRID:AB_1904078 |
| Rabbit polyclonal anti-phospho-HER2/ErbB2 (Tyr1248) antibody | Cell Signaling Technology | 2247S, RRID:AB_331725 |
| Mouse monoclonal anti-TRAP 1 antibody | Millipore | Cat#MABS1276 |
| Rabbit polyclonal anti-phospho-MtCK1 (Tyr153) | This paper | N/A |
| Biological Samples | ||
| Patient derived xenografts (PDX) | Mayo Clinic | https://www.mayoclinic.org/ |
| Chemicals, Peptides, and Recombinant Proteins | ||
| Trastuzumab | Mayo Clinic Pharmacy | N/A |
| Recombinant rabbit lactate dehydrogenase | Millipore | Cat# 427217-25KU |
| Recombinant HER2 protein | Life Technologies | Cat# PV3366 |
| Recombinant ABL1 protein | Life Technologies | Cat# P3049 |
| Lapatinib | LC Laboratories | Cat# L4899 |
| Cycloheximide | Alfa Aesar | Cat# J66901 |
| Phosphoenolpyruvic acid monopotassium salt | Alfa Aesar | Cat# B20358 |
| MG132 | Thermo Fisher | Cat# 508338 |
| Cyclocreatine | Santa Cruz | Cat# sc-217984 |
| Cyclocreatine | Toronto Research Chemicals | Cat# C982200 |
| Imatinib mesylate | Sigma | Cat# SML1027 |
| Ammonium chloride | Sigma | Cat# A9434 |
| Chloroquine | Sigma | Cat# C6628–25G |
| 3-guanidinopropionic acid (β-GPA) | Sigma | Cat# G6878 |
| Creatine | Sigma | Cat# C0780 |
| Phosphocreatine | Sigma | Cat# P1937 |
| Tetrabutylammonium bisulfate | Sigma | Cat# 86853 |
| β-estradiol | Sigma | Cat# E2758 |
| 3 × Flag peptide | Sigma | Cat# F4799 |
| ATP disodium trihydrate | BioWORLD | Cat# 40190020–1 |
| β-GPA ethyl ester | This paper | N/A |
| Experimental Models: Cell Lines | ||
| Human BT474 cell line | Laboratory of Matthew Goetz | N/A |
| Human SKBR3 cell line | Laboratory of Matthew Goetz | N/A |
| Human MDA-MB-453 cell line | Laboratory of Matthew Goetz | N/A |
| Human MDA-MB-468 cell line | Laboratory of Liewei Wang | N/A |
| Human 293T cell line | Laboratory of Yuichi Machida | N/A |
| Human primary mammary epitherial cells normal | ATCC | Cat# PCS-600–010 |
| Experimental Models: Organisms/Strains | ||
| Mouse: NOD.Cg-PrkdcscId Il2rg?tmlWjl/SzJ (NSG) | The Jackson Laboratory | Stock# 005557 |
| Mouse: Athymic Nude-Foxnlnu | Envigo | Cat# 069(nu) |
| E. Coli: BL21(DE3)pLysS | Life Technologies | Cat# C606003 |
| Oligonucleotides | ||
| Primers for MtCKl, forward: 5’-CCTGCTAAGCAAAGATAGCC-3’, reverse: 5’-TAATGCTTGGTGTGGATGAC-3 ‘ | IDT | N/A |
| Primers for GAPDH, forward: 5’-CAATGACCCCTTCATTGACC-3’, reverse: 5’-GACAAGCTTCCCGTTCTCAG-3’. | IDT | N/A |
| Flag tag primer (5’-GAC TAC AAG GAC GAT GAC GAC AAG −3’) | IDT | N/A |
| Recombinant DNA | ||
| Human HER2 WT | Addgene | Plasmid # 16257 |
| Human c-ABL | Addgene | Plasmid # 23939 |
| cDNA human MtCKl | GE Dharmacon | Clone ID# 2820642 |
| cDNA human CKB | GE Dharmacon | Clone ID# 2823530 |
| Flag-MtCKl in pLHCX vector | This paper | N/A |
| pLKO human TRAP1 shRNA | GE Dharmacon | Cat# TRCN0000060673 |
| pLKO human MtCK 1 shRNA | GE Dharmacon | Cat# TRCN0000006055 |
| pLKO human MtCK 1 shRNA | GE Dharmacon | Cat# TRCN0000006057 |
| Software and Algorithms | ||
| Gold Nouveau software | Beckman | N/A |
| MasterHands ver.2.17.1.11 | Keio University | N/A |
| MassHunter Quantitative Analysis B.06.00 | Agilent Technologies | N/A |
| Sequest | Eng et al., 1994 | http://fields.scripps.edu/yates/wp/?pageid=17 |
| Ascore | Beausoleil et al., 2006 | http://ascore.med.harvard.edu/ |
| ImageJ | NIH | https://imagej.nih.gov/ij/ |
| Other | ||
| pENTRTM/TEV/D-TOPO cloning kit | Life Technologies | Cat# K240020SP |
| QuickChange II XL Site-Directed Mutagenesis kit | Agilent Technologies | Cat# 200517 |
| Gateway LR Clonase™ II kit | Life Technologies | Cat# 11791–020 |
| Anti-Flag M2 affinity gel beads | Sigma | Cat# A2220 |
| IgG conjugated agarose beads | Santa Cruz | Cat# sc-2343 |
| Protein G Sepharose beads | GE Healthcare | Cat# 17–0618-01 |
| 250 × 3 mm Luna 5μm C8 (2) 100 A° column | Phenomenex | Cat# 00G-4450-E0 |
| Sep-Pak C18 column | Waters | Cat# WAT036790 |
| P-Tyr-100 mouse antibody conjugated to Sepharose beads | Cell Signaling Technology | Cat# 9419 |
| C18 ZipTip | Millipore | Cat# ZTC18S008 |
| Rneasy Plus Mini Kit | Qiagen | Cat# 74134 |
| iTaq Universal SYBR Green One-Step Kit | Bio-Rad | Cat# 172–5150 |
| CyQUANT Cell Proliferation Assay Kit | Life Technologies | Cat# C35011 |
| CellTiter-Glo Luminescent Cell Viability Assay kit | Promega | Cat# G9681 |
| cOmplete™ EDTA-free protease inhibitor cocktail | Roche | Cat# 11836170001 |
CONTACT FOR REAGENT AND RESOURCE SHARING
Further information and requests for resources and reagents should be directed to and will be fulfilled by Taro Hitosugi (hitosugi.taro@mayo.edu).
EXPERIMENTAL MODEL AND SUBJECT DETAILS
Cell Lines
HER2+ breast cancer BT474, SKBR3, MDA-MB-453 cells were cultured in phenol red-free Dulbecco’s Modified Eagle Medium (DMEM)/Ham’s F12 medium with 10% fetal bovine serum (FBS), 100 U/mL penicillin G and 100 μg/mL streptomycin (P/S). Triple-negative breast cancer MDA-MB-468 cells were cultured in L-15 medium supplemented with 10% FBS and P/S. All the breast cancer cell lines were derived from human female breast cancers. Normal human female mammary epithelial cells were cultured in Mammary Epithelial Cell Basal Medium with growth components (ATCC). Female human embryonic kidney 293T cells were maintained in RPMI 1640 supplemented with 10% FBS and P/S. BT474-R and SKBR3-R cells were maintained in 10 μg/mL trastuzumab. BT474 derivatives stably expressing Flag-MtCK1 WT or Y153F with stable knockdown of endogenous MtCK1 were maintained in 100 μg/mL hygromycin and 1 μg/mL puromycin. 293T cells with stable knockdown of TRAP1 were maintained in 1 μg/mL puromycin. All the cells were cultured in 37°C humidified incubators with 5% CO2.
Breast Cancer PDX Model
Human biological samples used for this study followed the guidelines of the Declaration of Helsinki, and patient identity for pathological specimens remained anonymous in the context of this study. The breast cancer PDX models were generated using tumor samples from patients recruited in the Breast Cancer Genome Guided Therapy Study (BEAUTY) approved by Mayo Clinic institutional review board (Goetz et al., 2017; Yu et al., 2017). In brief, percutaneous needle biopsies (one to two cores from 14 gauge needles) from human female breast cancer patients were implanted with Matrigel (BD Biosciences, Heidelberg, Germany) within an hour of sample collection in the flanks of immunodeficient 4–6 week female NSG mice. When tumors grow to 1 cm in diameter, mice were sacrificed and tumors were dissected. All the paitent identification information except sex, breast cancer subtypes, and clinical response to trastuzumab are not available in this study because of patient confidentiality. All animal procedures were approved by the Mayo Clinic Institutional Animal Care and Use Committee (IACUC). All PDX tumors used in this study were confirmed pathologically as human breast tumor. In addition, biomarker expression for ER (estrogen receptor), PR (progesterone receptor), HER2 (human epidermal receptor) for the PDX tumors were confirmed by immunohistochemistry and showed that these PDX tumors have the same subtypes as their originating patient tumors (Goetz et al., 2017; Yu et al., 2017). Flash frozen samples were used for the Western blotting analysis.
3D Organoid Culture PDX Model
Method for 3D organoid cell culture was performed as described previously (Yu et al., 2018). Approximately 20,000 PDX cells were seeded per well of a low-binding 96 well nanoculture plate (Scivax Corporation) in 100 μl of DMEM media supplemented with 10% FBS, glutamax and NEAA. Organoids were treated for the duration of 2 week with various concentration of cyclocreatine (0–3mM). Viable cells were counted using CellTiter-Glo (Promega) Luminescent Cell Viability Assay kit.
Xenograft Model
Female 4–6 week old athymic nude mice (Athymic Nude-Foxn1nu) and NSG mice (NOD.Cg-Prkdcscid Il2rgtm1Wjl/SzJ) were purchased from Envigo and Jackson lab, respectively. All procedures were approved by the Mayo Clinic Institutional Animal Care and Use Committee (IACUC) conform to the federal guidelines for the care and maintenance of laboratory animals. Mice were housed under a 12 h light-dark cycle in plastic cages and fed an irradiated chow diet. Housing temperatures were kept within a range of 71–73°F (21.7–22.8°C). Water and cages were autoclaved. Cages were changed once weekly, and the health status of the mice was monitored using a dirty bedding sentinel program. For BT474-R xenograft study, athymic nude mice were subcutaneously inoculated with 5 × 10⁶ BT474-R cells (n = 16 mice) in PBS with 50% growth-factor-reduced, phenol red-free Matrigel (Corning). Estradiol was dissolved in drinking water at final concentration of 10 ng/L for the first 3 weeks after tumor innoculation. After tumors reached a volume of about 200 mm3, mice were randomized into two groups (control and treatment). For HER2+ PDX #4 xenograft, PDX tumor was first grown to 1 cm in diameter in NSG mice, after which the tumors were resected and dissected into 8 mm3 pieces and re-injected subcutaneously into NSG mice. Once average tumor volumes were approximately 100 mm3, mice were randomized into various groups as indicated in the figures. For treatment, Cyclo-Cr was administered in drinking water at 0.3%, lapatinib was administrated orally at 50 mg/kg/day in 0.5% hydroxypropylmethylcellulose/0.1% Tween 80 solution and PCr was administered at 400 mg/kg/day in water intraperitoneally. For controls, groups were supplied with either regular drinking water or 0.5% hydroxypropylmethylcellulose/0.1% Tween80 solution. There was no difference in water consumption between the control and treatment groups. Tumor growth was recorded by measurement of two perpendicular diameters of the tumor over the 40-day treatment course for BT474-R xenograft study and 20–21 days for PDX #4 xenograft using the formula 4π/3 × (W/2)2 × (L/2), where W represents width and L represents length. Mice were sacrificied at the end of treatment course and tumors were harvested for intratumoral metabolites analysis by HPLC as indicated. Blood from both control and 0.3% CCr treatment mice were collected for complete blood count (CBC) analyses at the day of sacrifice and measured using VetScan HM5 instrument (Abaxis Inc.). For tumor formation assay using PDX #4 cells with MtCK1 knockdown, NSG mice (Jackson laboratory) were inoculated subcutaneously with 3 × 10⁶ PDX #4 cells (N=5) in PBS with 50% growth-factor-reduced, phenol red-free Matrigel (Corning). Right flank were inoculated with PDX #4 cells with MtCK1 knockdown while the left flank was inoculated with the same number of vector control PDX #4 cells. Tumor volume was measured 10 days after inoculation using the formula 4π/3 × (W/2)2 × (L/2), where W represents width and L represents length. P values were determined by a two-tailed Student’s t test.
METHOD DETAILS
Plasmids and shRNA Constructs
Human MtCK1 cDNA (Gene ID: 548596) was purchased from GE Dharmacon (MGC Human CKMT1A sequence-verified cDNA Accession: BC001926, Clone ID: 2820642). Human CKB cDNA was purchased from GE Dharmacon (Accession: BC019281). The cDNAs were amplified by PCR and subcloned into pENTR shuttle vector using pENTR™/TEV/D-TOPO cloning kit (Life Technologies). Human HER2 WT (plasmid # 16257) and human c-ABL1 (plasmid # 23939) were purchased from Addgene. Flag tag (5’-GAC TAC AAG GAC GAT GAC GAC AAG −3’) was added to the C-terminus of MtCK1. QuickChange II XL Site-Directed Mutagenesis kit (Agilent) was used to generate Y153 MtCK1, Y158 MtCK1, E227L MtCK1, D845N HER2, shRNA resistant WT MtCK1 and shRNA resistant Y153F MtCK1 constructs. All constructs were sequence verified using Sanger sequencing. pENTR constructs were further subcloned into either pcDNA3.2 or pLHCX-hygro derived gateway destination vector using Gateway LR Clonase™ II kit (Invitrogen), and the constructs were verified by restriction digest analysis. For retrovirus production, pLCHX-hygro destination vectors were co-transfected with packaging plasmids (gag/pol expression vector, and VSV-G expression vector) into 293T cells using lipofectamine 2000 transfection reagent (Invitrogen). Retrovirus was harvested 48 h after transfection and subconfluent cells were infected with the virus in the presence of 8 μg/mL of polybrene. The infected cells were selected in 100 μg/mL hygromycin for 2 weeks.
The lentiviral human MtCK1 shRNA constructs (TRCN0000006055 and TRCN0000006057) and lentiviral human TRAP1 shRNA construct (TRCN0000060673) in pLKO.1-puro vectors were purchased from GE Dharmacon. For lentivirus production, shRNA plasmids were co-transfected into 293T cells along with lentiviral packaging plasmids (pHRCMV8.2ΔR and CMV-VSVG). Lentivirus was harvested 48 h after transfection. Subconfluent cells were infected with harvested lentivirus in the presence of 8 μg/mL of polybrene and selected in 1 μg/mL puromycin for 2 weeks. For transient transfection, pcDNA3.2 constructs (or vector controls) were transiently transfected into 293T cells using lipofectamine 2000 transfection reagent (Invitrogen) and analyzed 24–48 h after transfection.
Chemicals and Inhibitors
Lapatinib was purchased from Chemietek (Indianopolis, IN) or LC laboratories (Woburn, MA). Trastuzumab was purchased from the Mayo Clinic Pharmacy (Rochester, MN). Cycloheximide (J66901) and phosphoenolpyruvic acid monopotassium salt (B20358) were purchased from Alfa Aesar. MG132 (508338) was purchased from Thermo Fisher. Cyclocreatine was purchased from Santa Cruz (sc-217984) or Toronto Research Chemicals (C982200). Imatinib mesylate (SML1027), ammonium chloride (A9434), chloroquine (C6628–25G), 3-guanidinopropionic acid (β-GPA) (G6878), creatine (C0780), phosphocreatine (P1937), tetrabutylammonium bisulfate (86853), and β-estradiol (E2758) were purchased from Sigma. ATP disodium trihydrate (40190020–1) was purchased from bioWORLD.
Immunoblotting and immunoprecipitation (IP)
Cells were washed with PBS and lysed in NP-40 lysis buffer (10 mM HEPES, pH 7.5, 2 mM sodium orthovanadate, 5 mM sodium fluoride, 5 mM sodium pyrophosphate, 50 mM nicotinamide, 300 mM NaCl, 1% Nonidet P-40 and cOmplete™ EDTA-free protease inhibitor cocktail (Roche)) for 10 min at 4°C. Cell extracts were cleared by centrifugation at 13,000g for 10 min at 4°C and protein concentration was measured with Bio-Rad Bradford protein assay.
For immunoblotting, lysates were mixed with 6× SDS sample buffer, heated at 95°C for 5 min, resolved by SDS-PAGE, and electrophoretically transferred to nitrocellulose membranes. Membranes were blocked in Tris-buffered saline (TBST) buffer containing 5% (w/v) non-fat dry milk for 30 min and then incubated with specific primary antibody diluted in the blocking buffer at 4 ºC overnight. Membranes were washed three times for a total duration of 1 h, incubated with HRP-conjugated secondary antibody for 1 h at room temperature, washed three times for a total duration of 1 h, and visualized using a chemiluminescence substrate. The following commercial antibodies were used: anti-β-actin (A1978), anti-Flag (F3165), and anti-c-ABL (A5844) from Sigma; rabbit anti-MtCK1 (15346–1-AP), rabbit anti-CKB (15137–1-AP) and anti-COX IV (11242–1-AP) from Proteintech; mouse anti-MtCK1 (MBS 475046) from MyBioSource; anti-HER2 (OP15) from Calbiochem; pY99 (pTyr) antibody (sc-7020), anti-Ub (P4D1) (sc-8017), anti-c-Abl (24–11) antibody (sc-23), anti-uMtCK (C8) antibody (sc-374080), anti-Fyn (sc-16), and anti-Tom40 (sc-365467) from Santa Cruz; anti-LC3B (D11) (3868S), anti-PDHK1 (3820S), and anti-pHER2 (Y1248) (2247S) from Cell Signaling; and anti-TRAP1 (MABS1276) from Millipore. Anti-pY153-MtCK1 was custom ordered from Phosphosolutions.
For immunoprecipitation of Flag-tagged proteins, pre-cleared cell lysates were incubated with 40 μL of pre-washed anti-Flag M2 affinity gel beads (Sigma) or IgG conjugated agarose beads (Santa Cruz) for 2 h at 4 °C, washed three times with ice-cold TBS and incubated with elution solution containing 3× Flag peptide (Sigma) at a final concentration of 150 ng/L in TBS for 30 min at 4 ºC. Supernatants containing Flag-tagged proteins were obtained after centrifugation at 8000 × g for 1 min. For enzymatic assay, samples were assayed within 1 h of elution. For immunoblot analysis, 6× SDS sample buffer was added before samples were heated at 95 °C for 5 min.
For immunoprecipitation of endogenous proteins, pre-cleared cell lysates were incubated with 10 μg of appropriate antibody or IgG control for 1.5 h at 4°C. Sample were then incubated with 30 μL pre-washed Protein G Sepharose beads (GE Healthcare 17–0618-01) for an additional 2 h at 4°C. Samples were centrifuged at 10,000 × g at 4 °C for 2 min to pellet the beads, which were washed two times with NP-40 lysis buffer and once with 50 mM HEPES buffer. Finally, SDS-PAGE loading buffer was added to the beads, which were boiled for 5 min before the supernatant was collected and subjected to SDS-PAGE.
Metabolite Extraction and HPLC Analysis
Intracellular metabolites were extracted from cells using 50% ice-cold methanol, dried under a stream of nitrogen gas at 25°C, reconstituted in HPLC-grade water (Fisher), and a 10-μL of sample was injected for HPLC analysis. The chromatographic separation was performed using a 250 × 3 mm Luna 5μm C8 (2) 100 A° column (Phenomenex) on a Beckman System Gold HPLC with methods adapted from previous studies (Lv et al., 2013; Vogt et al., 1998). The mobile phase for the first 10 min consisted of buffer A (0.2% KH2PO4 and 0.07% tetrabutylammonium bisulfate at pH 3.0) run at a flow rate of 0.3 mL/min. After 10 min, buffer B (0.2% KH2PO4, 0.07% tetrabutylammonium bisulfate and 10% acetonitrile at pH 3.0) was run at 0.3 mL/min for 40 min. The column was equilibrated with buffer A for 10 min at a flow rate of 1 mL/min before second run. The detector monitored the peaks at wavelength of 210 nm for the first 10 min and was switched to 260 nm for the remainder of the run. The retention time and position of the peaks were confirmed using pure appropriate standard compounds freshly prepared in HPLC-grade water. Standard curves were obtained using known amounts of pure standard compound to calculate the detection range, accuracy and quantity. A known quantity of authentic pure standard compound was spiked into the sample to identity and quantify each metabolite of interest. The peak area/height was quantified by using Gold Nouveau software (Beckman).
Metabolome Profiles by CE-TOFMS and CE-QqQMS for Steady-State Analysis
Approximately 7 × 10⁶ BT474 cells were treated with different conditions and duration of time. Cells were then washed twice with 5% (w/w) mannitol solution and metabolites were extracted using appropriate volume of methanol and a suitable internal standard from the culture dish. The extracted solution was first centrifuged quickly at 2,300 × g at 4°C for 5min to remove insoluble and proteins precipitate and then passed through centrifugal filter for untrafiltration (the filters were centrifuge at 9,100 × g at 4ºC for approx. 3h). The metabolite filtrate were centrufugally concentrated and resuspended in 50 μl of ultrapure water immediately before the measurement. Cationic compounds were measured in the cation mode of metabolome analysis using CE-TOFMS system (Agilent Technologies), while anionic compunds were measured in the positive or negative mode of metabolome analysis using CE-QqMS. Peaks detected in CE-TOFMS analysis were extracted using automatic integration software (MasterHands ver.2.17.1.11) and those in CE-QqQMS analysis were extracted using automatic integration software (MassHunter Quantitative Analysis B.06.00). The peak area was converted to relative peak area by dividing the metabolite peak area by the internal standard peak area and normalization factor. The peaks were annotated based on the migration times in CE and m/z values determined by TOFMS. Putattive metabolites were then assigned from HMT metabolite database on the basis of m/z and migration time. The tolerance was ±0.5 min in migration time and ±10 ppm in m/z. A total of 116 metabolites (54 and 62 metabolites in the cation and anion mode, respectively) including the creatine pathway, glycolysis, pentose phosphate pathway, TCA cycle intermediates, amino acids, nucleic acids, urea cycle, and others were measured. All of the metabolites concentrations were calculated by normalizing the peak area of each metabolites with respect to the area of the internal standard and by using standard curves, which were obtained by three-point calibrations.
Mitochondrial Isolation and Proteinase K Assay
Cells were washed with PBS, suspended in mitochondrial buffer (20 mM HEPES, pH 7.5, 10 mM KCl, 220 mM mannitol, 70 mM sucrose, 1.5 mM MgCl2, 1 mM EDTA, and cOmplete™ EDTA-free protease inhibitor cocktail (Roche)), and homogenized using a manual glass/teflon homogenizer. Homogenates were first centrifuged at 800g for 10 min at 4°C to remove unbroken cells and nuclei. The supernatant was collected and centrifuged at 10,000g for 10 min at 4°C. The supernatant, which contained cytosolic proteins, was collected. The pellet, which contained the mitochondria was washed in mitochondrial buffer, centrifuged at 10,000g for 10 min at 4 °C to eliminate any cytosolic protein contamination, and sonicated. Protein concentrations in the cytosolic and mitochondrial fractions were determined using Bio-Rad Bradford protein assay, and the fractions were analyzed for MtCK1 enzymatic activity.
Proteinase K assays were performed in mitochondria buffer without cOmplete™ EDTA-free protease inhibitor cocktail (Roche). Mitochondrial fractions were incubated with 5 μg/mL Proteinase K with or without 1% Triton X-100 30°C for 30 min. Reactions were stopped by adding 6 × SDS-PAGE sample buffer and heating at 95 °C for 5 min, followed by immunoblotting.
Phospho-proteomics Analysis
Phospho-proteomic analyses of mitochondrial enriched fractions of HER2+ BT474 breast cancer cells were adapted from method previously described (Breitkopf and Asara, 2012). Mitochondria were isolated by homogenization from approximately 2 × 10⁹ cells using the mitochondrial isolation method described above with the addition of phosphatase inhibitors (5 mM sodium pyrophosphate, 5 mM sodium fluoride and 2 mM sodium orthovanadate) in the mitochondrial buffer. Crude mitochondrial pellets were then lysed in urea buffer (8 M Urea, 1.5 M thiourea, 20 mM HEPES, pH 8.0, cOmplete™ EDTA-free protease inhibitor cocktail and phosphatase inhibitor) and sonicated with 15W output (3 bursts for 30 seconds each) at 4°C. Next, cleared supernatant were adjusted to 4.5 mM dithiothreitol (DTT) and incubated for 30 min at 56°C for protein carboxamidomethylation. After cooling to RT, the solution was further adjusted to 11 mM of iodoacetamide (IAA) and incubated for additional 30 min at RT in the dark. The sample was then diluted 1:5 with water to final concentration of 1.6 M urea for trypsin digestion. Trypsin (1 μg/μL in 50 mM acetic acid, Promega) was added to the lysate at ~75:1 substrate/protease ratio. The lysates were digested overnight at 37°C with rotation (~450 rpm), acidified by adding 1/20 volume of 20% trifluoracetic acid (TFA), incubated for 10 min at 23°C, and centrifuged at 1,800 × g for 10 min at 15°C to remove precipitate and debris. The acidified, digested peptides were loaded onto a pre-wet Sep-Pak C18 column (pre-wetted with 3 ml 100% acetonitrile) and washed with 6 ml 0.1% TFA. The purified peptides were eluted with 3 mL of 0.1% TFA/40% acetonitrile. The sample was dried down in a SpeedVac with no heat. Next, the dried peptides were first dissolved in 1.4 mL of buffer (150 mM NaCl, 0.5% Nonidet P-40, 1% Triton-X, 50 mMTris-HCl, pH 7.4, 1 mM EDTA, pH 8, and 1 mM EGTA) and incubated for 30 min at RT with gentle shaking. The sample was centrifuged at 1,800g and the resulting cleared supernatant was incubated with phosphotyrosine P-Tyr-100 mouse antibody conjugated to Sepharose beads (Cell Signaling Technology, #9419) for 2 hr at 4ºC for immunoaffinity purification. The beads were washed 3 times with 1 mL of lysis and IP-buffer, followed by 2 washes with 1 mL water. A total of 100 μL of 0.15% TFA was added to the beads (50 μL at a time), mixed and incubated at RT for 10 min to elute the immunoprecipitated peptides. Eluate was collected by centrifugation at 2,500 × g. Finally, purification and concentration of the immunoprecipitated peptides was performed on C18 ZipTip (Millipore) before LC-MS analysis.
On the day of analysis, the samples were reconstituted in 5–10 μl of HPLC solvent A (2.5% acetonitrile, 0.1% formic acid). A nano-scale reverse-phase HPLC capillary column was created by packing 2.6 μm C18 spherical silica beads into a fused silica capillary (100 μm inner diameter × ~30 cm length) with a flame-drawn tip. After equilibrating the column each sample was loaded via a Famos auto sampler (LC Packings, San Francisco CA) onto the column. A gradient was formed and peptides were eluted with increasing concentrations of solvent B (97.5% acetonitrile, 0.1% formic acid). As each peptide was eluted they were subjected to electrospray ionization and then they entered into an LTQ Orbitrap Velos Pro ion-trap mass spectrometer (Thermo Fisher Scientific, San Jose, CA). Eluting peptides were detected, isolated, and fragmented to produce a tandem mass spectrum of specific fragment ions for each peptide. Peptide sequences (and hence protein identity) were determined by matching protein or translated nucleotide databases with the acquired fragmentation pattern by the software program, Sequest (ThermoFinnigan, San Jose, CA) (Eng et al., 1994). The modification of 79.9663 mass units to tyrosine was included in the database searches to determine phosphopeptides. Phosphorylation assignments were determined by the Ascore algorithm (Beausoleil et al., 2006). All databases include a reversed version of all the sequences and the data was filtered to between a one and two percent peptide false discovery rate.
Purification of Recombinant MtCK1 WT, MtCK1 Y153F and PKM1
Human MtCK1, CKB and PKM1 cDNAs were subcloned into pET53 Gateway destination vector from pENTR shuttle vector, which appends an N-terminal His6-tag as described previously (Hitosugi et al., 2012). In brief, transformed BL21(DE3)pLysS E. coli were grown to a density of 0.5 (OD600) at 37°C and induced with 1 mM IPTG for 4 h at 37°C. Cells were sonicated in native buffer (20 mM sodium phosphate, 0.5 M NaCl and 20 mM imidazole, pH 8.0) along with cOmplete™ EDTA-free protease inhibitor cocktail (Roche) and centrifuged at 4,800 × g for 15 min at 4°C. Clarified lysate was incubated with ProBond Resin His-tag beads (Life technologies) for 1 h at 4°C. The beads were washed with native buffer 5 times. Bound proteins were eluted in elution buffer (20 mM sodium phosphate, 0.5 M NaCl, and 250 mM imidazole, pH 8.0). Proteins were desalted on a PD-10 column and the purity/quantity of the protein was assessed by Coomassie blue staining. The purified recombinant proteins were mixed with glycerol (final concentration 20%) and were stored at −80°C until further analysis.
In vitro MtCK1 Enzyme Activity Assay
MtCK1 activity was measured using an enzyme coupled assay (Saks et al., 1975). Samples were adjusted to 250 mM sucrose, 20 mM Tris-HCl, pH 8.5, 7 mM MgSO4, 6.5 mM glutathione, 2 mM ATP, 0.8 mM phosphoenolpyruvate (PEP), 0.3 mM NADH, 0.5 unit/mL recombinant human pyruvate kinase M1 and 1 unit/mL rabbit muscle lactate dehydrogenase (EMD Millipore). Cr was added last to initiate the reaction at a final concentration of 2 mM. The decrease in autofluorescence (ex: 340 nm, em: 460 nm) due to NADH oxidation was measured as MtCK1 enzymatic activity.
In vitro Tyrosine Kinase Assay
Bacterially expressed, purified recombinant Flag-MtCK1 WT was incubated with 140 ng of recombinant ERBB2 (HER2) (Invitrogen, PV3366) for 30 min at 30ºC in HER2 kinase buffer (20 mM Tris, pH 7.5, 5 mM MnCl2, 1 mM EGTA, 0.5 mM Na3VO4, 5 mM β-glycerophosphate, 2 mM DTT, 0.01% NP-40 and 200 μM ATP). For ABL kinase assays, recombinant Flag-MtCK1 WT or Flag-MtCK1 Y153F or recombinant CKB were incubated with 100 ng of recombinant ABL1 (Invitrogen, P3049) for 30 min at 30°C in ABL kinase buffer (50 mM Tris, pH 7.5, 10 mM MgCl2, 1 mM DTT, 0.01% NP-40 and 200 μM ATP). Reactions were stopped by adding 6× SDS-PAGE sample buffer, heated at 95ºC for 5 min, and analyzed by immunoblotting.
Cell Proliferation Assay and Clonogenic Assay
Cell proliferation assay was performed using CyQUANT Cell Proliferation Assay Kit (Thermo Fisher Scientific). Cells were seeded in a 96-well plate, treated with the indicated agents, and cultured for the indicated period of time or 5 days, an equal volume of 2× detection reagent was added, and incubated for 60 min at 37°C. Fluorescence from the bottom of well was read using excitation/emission wavelengths at 508/527 nm. For clonogenic assays, cells were seeded on a 6-well plate and cyclocreatine was added the next day. Media with cyclocreatine added was changed every week, and the plates were cultured for 2–3 week. Colonies were stained with 0.1% Coomassie brilliant blue in 42% methanol and 16.8% acetic acid and counted using ImageJ macro Cell Colony Edge (Choudhry et al., 2016).
Mitochondrial Function Assay Using Extracellular Metabolic Flux Analyzer
The mitochondrial respiratory activity was assessed by measuring oxygen consumption rate (OCR) of cells using Agilent Seahorse XF analyzer. Briefly, cells were seeded at a optimal density in XF cell culture plates consisting of 80 μL of growth media and grown overnight. In case of Cyclo-Cr, cells were treated with the indicated concentration of Cyclo-Cr for 4 hr or 24 hr. Cells were then washed and incubated in XF base medium supplemented with glucose, glutamine and sodium pyruvate in a non-CO2 incubator to allow for pre-equilibration with the assay medium. In case of Cyclo-Cr treatment, Cyclo-Cr was included in the base medium along with glucose, glutamine and sodium pyruvate. The compounds (oligomycin, FCCP, and a mixture of rotenone and antimycin A) were serially injected to measure OCR under different conditions. Oligomycin (1 μM) was used to inhibit ATP synthase (complex V), while FCCP (1 μM) was used as an uncoupling agent that mimics a physiological “energy demand” and stimulates the respiratory chain to function at its maximal capacity. Rotenone and antimycin A (0.5 μM) inhibits complexes I and III respectively and were used to completely block the total mitochondrial respiration, which then enabled to measure nonmitochondrial respiration rate.
Quantitative Real-time PCR (q-PCR)
Total RNA was isolated from cells using Rneasy Plus Mini Kit (Qiagen, 74134) per manufacturer’s instructions. Reverse transcription-qPCR was performed using iTaq Universal SYBR Green One-Step Kit (Bio-Rad, 172–5150) and CFX96 Real-Time System equipped with C1000 thermal cycler (Bio-Rad). PCR reactions were carried out in triplicate and quantification of mRNA expression was calculated by the ΔCT method with GAPDH as reference gene. MtCK1 primers, forward: 5’- CCTGCTAAGCAAAGATAGCC-3’, reverse: 5’-TAATGCTTGGTGTGGATGAC-3’; GAPDH primers, forward: 5’-CAATGACCCCTTCATTGACC-3’, reverse: 5’-GACAAGCTTCCCGTTCTCAG-3’.
Synthesis of Ethyl 3-guanidinopropionate Hydrochloride (β-GPA ethyl ester)
In a 50-mL pressure tube, 1 g of guanidinopropionic acid was added with 1.25 M hydrogen chloride in 10 mL ethanol under argon atmosphere. The mixture was heated at 55ºC overnight after which all the volatile solvents were removed under reduced pressure. The resulting colorless oil was co-evaporated with 40 mL of ethanol twice and the residue was pumped in high vacuum to remove ethanol as much as possible to give product in quantitative yield. 1H NMR (DMSO-d6): 1.20 (t, J=7.0 Hz, 3H), 2.56 (t, J=6.5 Hz, 2H), 3.36 (t, J=6.5 Hz, 2H), 4.09 (q, J=7.0 Hz), 7.0–7.8 (br., 3H). 13C NMR (DMSO-d6): 171.4, 157.5, 60.8, 37.0, 33.7, 14.5.
Cell Proliferation Assay of PDXs with Genetic Inhibition of MtCK1
PDX #4 and #14 cells were purified using the protocol described previously (Gao et al., 2014). In brief, a portion of tumor tissue was dissected and cut into 2 mm3 sections in sterile PBS and incubated with 5 ml of the enzyme mix from a human Tumor Dissociation Kit (Miltenyi Biotech) prepared according to the manufacturer’s protocol. Tissue was digested at 37°C with rotation on a gentleMACS Dissociator (Miltenyi Biotech) program for “dissociation of tough tumors” according to the manufacturer’s protocol. The digested cell mixture was passed through a 70 μm MACS SmartStrainer, then a 40 μm MACS SmartStrainer to obtain the single-cell suspension. Dissociated cells were then spun down and washed with precooled washing buffer. Purified breast cancer tumor cells were obtained by removing the mouse cells using the Mouse Cell Depletion Purification Kit (Miltenyi Biotech) according to the manufacturer’s protocol. The obtained PDX cells were cultured in DMEM supplemented with 10% FBS, glutamax and NEA, infected with a lentivirus encoding human MtCK1 shRNA construct (TRCN0000006057), and selected with 1 μg/mL puromycin before tumor formation and cell proliferation assay started. For cell proliferation assay, CyQUANT Cell Proliferation Assay Kit (Thermo Fisher Scientific) was used as described in the above section.
Confocal microscopy
Cells were plated on coverslips in a 6-well plate and cultured overnight. Before fixation, cells were stained with 200 nM of MitoTracker Red (Life Technologies) in fresh media for 30min at 37°C. Cells were then washed three times with 1×PBS and fixed with 4% paraformaldehyde in PBS for 15 min at RT. After fixation, cells were rinsed with 1×PBS for three times and then permeabilized by incubating in PBS containing 0.3% Triton® X-100 for 10 min at RT. Cells were washed three times with 1×PBS and blocked with blocking buffer (10% normal goat serum, 1% glycerol, 0.1% Triton® X-100 and 0.04% sodium azide) for 2 hr at RT. Cells were then incubated with primary antibody diluted in blocking buffer overnight at 4°C. Next day cells were washed three times with 1×PBS (5 min each) and incubated with Alexa Fluor secondary antibody at 1:500 dilution for 1 hr at RT in dark. Cells were washed three times with 1×PBS (5 min each) and coverslips were mounted on a glass slide. Imaging was performed on a Nikon Eclipse TI E2 Inverted spinning disk confocal equipped with a CSU-X1 spinning disk (Yokogawa), an ORCA-R2 cooled CCD camera (Hamamatsu) and a Spectral Applied Research MLL-5 merge module including a solid-state 488nm (100mW), 561nm (100mW) and 642nm (100mW) lasers. Images were acquired with a 405/488/568/647 dichroic and ET525/50m, ET620/60m and ET700/75m emission filters and were analyzed using ImageJ software.
QUANTIFICATION AND STATISTICAL ANALYSIS
Statistical significance was tested using unpaired two-tailed Student’s t tests, assuming independent variables, normal distribution, and equal variance of samples. Data are presented as mean ± standard deviation (or ± standard error of mean in xenograft studies in Figure 7). The statistical parameters can be found within the figure legends. A p value < 0.05 was considered to indicate statistical significance. Statistical analyses were performed using Excel.
Supplementary Material
Highlights:
The HER2/ABL axis tyrosine phosphorylates MtCK1 at Y153 to stabilize MtCK1
ABL binds to MtCK1 in the outer mitochondrial membrane
Y153 phosphorylation of MtCK1 is commonly upregulated in HER2+ breast cancers
Inhibition of the PCr energy shuttle by cyclocreatine decreases tumor growth in vivo
Acknowledgements
This research was supported in part by NIH R01 CA225680 (T.H.), CA196648 (L.W.), Career Catalyst Research funding (CCR14300798) from the Susan G. Komen Foundation (T.H.), the Eagles Cancer Research Fund (T.H.), a Team Science Platform Award from the Mayo Clinic Center for Biomedical Discovery (T.H. and Z.L.), the Developmental Therapeutics Program from the Mayo Clinic Cancer Center (T.H.), the Minnesota Partnership for Biotechnology and Medical Genomics grant NP IF #16.09 (S.H.K), the Mayo Clinic Center for Individualized Medicine, Nadia’s Gift Foundation, John P. Guider, The Eveleigh Family, the Mayo Clinic Cancer Center grant CA15083–40A2 (M.P.G), George M. Eisenberg Foundation for Charities, the Prospect Creek Foundation, and the Randy Shaver Cancer Research and Community Fund, and the Mayo Clinic Breast SPORE P50CA 116201–10 (T.H. and M.P.G.). The content is solely the responsibility of the authors and does not necessarily represent the official views of the National Institutes of Health. K.K., E.K.W. and T.R.L. were supported by predoctoral fellowships from the Mayo Foundation for Education and Research. We thank the Mayo Clinic Cancer Center Pharmacology Shared Resource (supported by P30 CA15083–40) for providing tissue culture facilities and HPLC analytical expertise.
Footnotes
Publisher's Disclaimer: This is a PDF file of an unedited manuscript that has been accepted for publication. As a service to our customers we are providing this early version of the manuscript. The manuscript will undergo copyediting, typesetting, and review of the resulting proof before it is published in its final citable form. Please note that during the production process errors may be discovered which could affect the content, and all legal disclaimers that apply to the journal pertain.
Declaration of Interests
The authors declare no competing interests.
References:
- Amoroso MR, Matassa DS, Laudiero G, Egorova AV, Polishchuk RS, Maddalena F, Piscazzi A, Paladino S, Sarnataro D, Garbi C, et al. (2012). TRAP1 and the proteasome regulatory particle TBP7/Rpt3 interact in the endoplasmic reticulum and control cellular ubiquitination of specific mitochondrial proteins. Cell death and differentiation 19, 592–604. [DOI] [PMC free article] [PubMed] [Google Scholar]
- Arteaga CL, Sliwkowski MX, Osborne CK, Perez EA, Puglisi F, and Gianni L (2012). Treatment of HER2-positive breast cancer: current status and future perspectives. Nature reviews Clinical oncology 9, 16–32. [DOI] [PubMed] [Google Scholar]
- Beausoleil SA, Villén J, Gerber SA, Rush J, and Gygi SP (2006). A probability-based approach for high-throughput protein phosphorylation analysis and site localization. Nat Biotechnol 24, 1285–1292. [DOI] [PubMed] [Google Scholar]
- Ben-Nissan G, and Sharon M (2014). Regulating the 20S proteasome ubiquitin-independent degradation pathway. Biomolecules 4, 862–884. [DOI] [PMC free article] [PubMed] [Google Scholar]
- Boehm EA, Radda GK, Tomlin H, and Clark JF (1996). The utilisation of creatine and its analogues by cytosolic and mitochondrial creatine kinase. Biochimica et biophysica acta 1274, 119–128. [DOI] [PubMed] [Google Scholar]
- Breitkopf SB, and Asara JM (2012). Determining in vivo phosphorylation sites using mass spectrometry. Curr Protoc Mol Biol Chapter 18, Unit18.19.11–27. [DOI] [PMC free article] [PubMed] [Google Scholar]
- Cazzaniga M, and Bonanni B (2015). Breast Cancer Metabolism and Mitochondrial Activity: The Possibility of Chemoprevention with Metformin. BioMed Research International 2015, 1–9. [DOI] [PMC free article] [PubMed] [Google Scholar]
- Choudhry P, Carpenter A, Kaur A, Westermarck J, Abankwa D, and Muhlemann K (2016). High-Throughput Method for Automated Colony and Cell Counting by Digital Image Analysis Based on Edge Detection. PLoS One 11, e0148469. [DOI] [PMC free article] [PubMed] [Google Scholar]
- Cimino D, Fuso L, Sfiligoi C, Biglia N, Ponzone R, Maggiorotto F, Russo G, Cicatiello L, Weisz A, Taverna D, et al. (2008). Identification of new genes associated with breast cancer progression by gene expression analysis of predefined sets of neoplastic tissues. Int J Cancer 123, 1327–1338. [DOI] [PubMed] [Google Scholar]
- DeLuca M, Hall N, Rice R, and Kaplan NO (1981). Creatine kinase isozymes in human tumors. Biochem Biophys Res Commun 99, 189–195. [DOI] [PubMed] [Google Scholar]
- Diers Anne R., Broniowska Katarzyna A., Chang C-F, and Hogg N (2012). Pyruvate fuels mitochondrial respiration and proliferation of breast cancer cells: effect of monocarboxylate transporter inhibition. Biochem J 444, 561–571. [DOI] [PMC free article] [PubMed] [Google Scholar]
- Dikic I (2017). Proteasomal and Autophagic Degradation Systems. Annu Rev Biochem 86, 193–224. [DOI] [PubMed] [Google Scholar]
- Ding Y, Liu Z, Desai S, Zhao Y, Liu H, Pannell LK, Yi H, Wright ER, Owen LB, Dean-Colomb W, et al. (2012). Receptor tyrosine kinase ErbB2 translocates into mitochondria and regulates cellular metabolism. Nature communications 3, 1271. [DOI] [PMC free article] [PubMed] [Google Scholar]
- Eder M, Stolz M, Wallimann T, and Schlattner U (2000). A conserved negatively charged cluster in the active site of creatine kinase is critical for enzymatic activity. J Biol Chem 275, 27094–27099. [DOI] [PubMed] [Google Scholar]
- Eng JK, McCormack AL, and Yates JR (1994). An approach to correlate tandem mass spectral data of peptides with amino acid sequences in a protein database. J Am Soc Mass Spectrom 5, 976–989. [DOI] [PubMed] [Google Scholar]
- Fenouille N, Bassil CF, Ben-Sahra I, Benajiba L, Alexe G, Ramos A, Pikman Y, Conway AS, Burgess MR, Li Q, et al. (2017). The creatine kinase pathway is a metabolic vulnerability in EVI1-positive acute myeloid leukemia. Nat Med 23, 301–313. [DOI] [PMC free article] [PubMed] [Google Scholar]
- Gao D, Vela I, Sboner A, Iaquinta Phillip J., Karthaus Wouter R., Gopalan A, Dowling C, Wanjala Jackline N., Undvall Eva A., Arora Vivek K., et al. (2014). Organoid Cultures Derived from Patients with Advanced Prostate Cancer. Cell 159, 176–187. [DOI] [PMC free article] [PubMed] [Google Scholar]
- Goetz MP, Kalari KR, Suman VJ, Moyer AM, Yu J, Visscher DW, Dockter TJ, Vedell PT, Sinnwell JP, Tang X, et al. (2017). Tumor Sequencing and Patient-Derived Xenografts in the Neoadjuvant Treatment of Breast Cancer. Journal of the National Cancer Institute 109. [DOI] [PMC free article] [PubMed] [Google Scholar]
- Greuber EK, Smith-Pearson P, Wang J, and Pendergast AM (2013). Role of ABL family kinases in cancer: from leukaemia to solid tumours. Nature Reviews Cancer 13, 559–571. [DOI] [PMC free article] [PubMed] [Google Scholar]
- Hitosugi T, and Chen J (2014). Post-translational modifications and the Warburg effect. Oncogene 33, 4279–4285. [DOI] [PubMed] [Google Scholar]
- Hitosugi T, Zhou L, Elf S, Fan J, Kang HB, Seo JH, Shan C, Dai Q, Zhang L, Xie J, et al. (2012). Phosphoglycerate mutase 1 coordinates glycolysis and biosynthesis to promote tumor growth. Cancer cell 22, 585–600. [DOI] [PMC free article] [PubMed] [Google Scholar]
- Hornbeck PV, Zhang B, Murray B, Kornhauser JM, Latham V, and Skrzypek E (2015). PhosphoSitePlus, 2014: mutations, PTMs and recalibrations. Nucleic Acids Res 43, D512–D520. [DOI] [PMC free article] [PubMed] [Google Scholar]
- Kanemitsu F, Kawanishi I, Mizushima J, and Okigaki T (1984). Mitochondrial creatine kinase as a tumor-associated marker. Clin Chim Acta 138, 175–183. [DOI] [PubMed] [Google Scholar]
- Kang BH, Plescia J, Dohi T, Rosa J, Doxsey SJ, and Altieri DC (2007). Regulation of tumor cell mitochondrial homeostasis by an organelle-specific Hsp90 chaperone network. Cell 131, 257–270. [DOI] [PubMed] [Google Scholar]
- Lv L, Xi H, and Han G (2013). An Ion-Pair HPLC Method for Simultaneous Determination of Exogenous Phosphocreatine and Its Metabolite Creatine and Related ATP in Rabbit Plasma and RBC: Application to a Pharmacokinetic Study. Journal of Analytical Sciences, Methods and Instrumentation 03, 17–23. [Google Scholar]
- Oudman I, Clark JF, and Brewster LM (2013). The effect of the creatine analogue beta-guanidinopropionic acid on energy metabolism: a systematic review. PloS one 8, e52879. [DOI] [PMC free article] [PubMed] [Google Scholar]
- Qian X-L, Li Y-Q, Gu F, Liu F-F, Li W-D, Zhang X-M, and Fu L (2012). Overexpression of ubiquitous mitochondrial creatine kinase (uMtCK) accelerates tumor growth by inhibiting apoptosis of breast cancer cells and is associated with a poor prognosis in breast cancer patients. Biochem Biophys Res Commun 427, 60–66. [DOI] [PubMed] [Google Scholar]
- Rizza S, Montagna C, Cardaci S, Maiani E, Di Giacomo G, Sanchez-Quiles V, Blagoev B, Rasola A, De Zio D, Stamler JS, et al. (2016). S-nitrosylation of the Mitochondrial Chaperone TRAP1 Sensitizes Hepatocellular Carcinoma Cells to Inhibitors of Succinate Dehydrogenase. Cancer Res 76, 4170–4182. [DOI] [PubMed] [Google Scholar]
- Saks VA, Chernousova GB, Gukovsky DE, Smirnov VN, and Chazov EI (1975). Studies of energy transport in heart cells. Mitochondrial isoenzyme of creatine phosphokinase: kinetic properties and regulatory action of Mg2+ ions. Eur J Biochem 57, 273–290. [DOI] [PubMed] [Google Scholar]
- Scholl S, Beuzeboc P, and Pouillart P (2001). Targeting HER2 in other tumor types. Ann Oncol 12, S81–S87. [DOI] [PubMed] [Google Scholar]
- Tang Z, Li C, Kang B, Gao G, Li C, and Zhang Z (2017). GEPIA: a web server for cancer and normal gene expression profiling and interactive analyses. Nucleic Acids Res 45, W98–W102. [DOI] [PMC free article] [PubMed] [Google Scholar]
- Vogt AM, Ackermann C, Noe T, Jensen D, and Kübler W (1998). Simultaneous Detection of High Energy Phosphates and Metabolites of Glycolysis and the Krebs Cycle by HPLC. Biochem Biophys Res Commun 248, 527–532. [DOI] [PubMed] [Google Scholar]
- Wallace DC (2012). Mitochondria and cancer. Nature Reviews Cancer 12, 685–698. [DOI] [PMC free article] [PubMed] [Google Scholar]
- Wallimann T, Tokarska-Schlattner M, and Schlattner U (2011). The creatine kinase system and pleiotropic effects of creatine. Amino Acids 40, 1271–1296. [DOI] [PMC free article] [PubMed] [Google Scholar]
- Wang YC, Morrison G, Gillihan R, Guo J, Ward RM, Fu X, Botero MF, Healy NA, Hilsenbeck SG, Phillips GL, et al. (2011). Different mechanisms for resistance to trastuzumab versus lapatinib in HER2-positive breast cancers--role of estrogen receptor and HER2 reactivation. Breast cancer research : BCR 13, R121. [DOI] [PMC free article] [PubMed] [Google Scholar]
- Weinberg SE, and Chandel NS (2015). Targeting mitochondria metabolism for cancer therapy. Nat Chem Biol 11, 9–15. [DOI] [PMC free article] [PubMed] [Google Scholar]
- Wetzler M, Talpaz M, Van Etten RA, Hirsh-Ginsberg C, Beran M, and Kurzrock R (1993). Subcellular localization of Bcr, Abl, and Bcr-Abl proteins in normal and leukemic cells and correlation of expression with myeloid differentiation. J Clin Invest 92, 1925–1939. [DOI] [PMC free article] [PubMed] [Google Scholar]
- Yoshida S, Tsutsumi S, Muhlebach G, Sourbier C, Lee MJ, Lee S, Vartholomaiou E, Tatokoro M, Beebe K, Miyajima N, et al. (2013). Molecular chaperone TRAP1 regulates a metabolic switch between mitochondrial respiration and aerobic glycolysis. Proc Natl Acad Sci U S A 110, E1604–1612. [DOI] [PMC free article] [PubMed] [Google Scholar]
- Yu J, Qin B, Moyer AM, Nowsheen S, Liu T, Qin S, Zhuang Y, Liu D, Lu SW, Kalari KR, et al. (2018). DNA methyltransferase expression in triple-negative breast cancer predicts sensitivity to decitabine. J Clin Invest. [DOI] [PMC free article] [PubMed] [Google Scholar]
- Yu J, Qin B, Moyer AM, Sinnwell JP, Thompson KJ, Copland JA 3rd, Marlow LA, Miller JL, Yin P, Gao B, et al. (2017). Establishing and characterizing patient-derived xenografts using prechemotherapy percutaneous biopsy and post-chemotherapy surgical samples from a prospective neoadjuvant breast cancer study. Breast Cancer Res 19, 130. [DOI] [PMC free article] [PubMed] [Google Scholar]
Associated Data
This section collects any data citations, data availability statements, or supplementary materials included in this article.