Abstract
Chemically-induced vascular toxicity during embryonic development may cause a wide range of adverse effects. To identify putative vascular disrupting chemicals (pVDCs), a predictive pVDC signature was constructed from 124 U.S. EPA ToxCast high-throughput screening (HTS) assays and used to rank 1060 chemicals for their potential to disrupt vascular development. Thirty-seven compounds were selected for targeted testing in transgenic Tg(kdrl:EGFP) and Tg(fli1:EGFP) zebrafish embryos to identify chemicals that impair developmental angiogenesis. We hypothesized that zebrafish angiogenesis toxicity data would correlate with human cell-based and cell-free in vitro HTS ToxCast data. Univariate statistical associations used to filter HTS data based on correlations with zebrafish angiogenic inhibition in vivo revealed 132 total significant associations, 33 of which were already captured in the pVDC signature, and 689 non-significant assay associations. Correlated assays were enriched in cytokine and extracellular matrix pathways. Taken together, the findings indicate the utility of zebrafish assays to evaluate an HTS-based predictive toxicity signature and also provide an experimental basis for expansion of the pVDC signature with novel HTS assays.
Keywords: Angiogenic inhibition, predictive toxicology, zebrafish
Introduction
The cardiovascular system is the first functional organ system to develop in the mammalian embryo [1]. Because vascular development is sensitive to drug or chemical perturbation [2; 3; 4] and is a potential mechanism of teratogenesis [5], screening for vascular toxicity provides information relevant to the developmental toxicity profile of environmental chemicals. Despite these observations, data concerning chemical-target interactions underlying developmental vascular toxicity is limited. Previous studies have explored this issue utilizing experimental and computational models based on in vitro data from high-throughput screening (HTS) assays [2; 6; 7; 8; 9]. A multi-tiered approach, involving the integration of in vitro data with in silico models and in vivo apical endpoints is necessary to build insight into how chemical disruption of vascular development might ultimately lead to adverse outcomes.
A predictive signature of developmental vascular toxicity, termed the pVDC signature, was used to characterize the ToxCast chemical inventory based on a subset of human in vitro HTS assays that measure various endpoints in vasculogenesis or angiogenesis [7; 8]. This approach was based on an adverse outcome pathway (AOP) for vascular toxicity during development and enables ranking of 1060 ToxCast chemicals from high to low by their predicted potential to disrupt vascular development in a human system. Although this approach has utility in prioritizing chemicals for developmental toxicity evaluation, there are a number of caveats. First, in vitro and biochemical assays lack in vivo complexity including absorption, distribution, metabolism, and elimination that collectively influence toxicokinetics and systemic factors, like blood flow/shear stress during vascular development and patterning [10; 11]. Second, the signature was constrained by assay availability and, as a consequence, lacked key biological information like canonical Wnt [12], non-canonical Wnt [13], semaphorin/plexin [14], and BMP [15] pathways that invoke developmental angiogenesis. Third, some HTS data are derived from cell types not particularly relevant to endothelial cell specification and patterning during embryonic vascular development. Lastly, the database used to build the relevant gene list included in the predictive signature provides information on vascular-related or associated defects following functional inactivation of gene products in mice [8] and therefore may not capture those elements where partial loss of function or inappropriate activation results from exposure to exogenous chemicals.
To evaluate computational toxicology predictions derived from the pVDC signature, assays that address abovementioned shortcomings and capture the complexity of developmental angiogenesis are required. To that end, we deployed multiple angiogenesis assays in transgenic zebrafish embryos, a transparent vertebrate model with a rapid developmental profile and substantial genetic homology with humans, including robust conservation of human drug targets [16; 17]. Using the predictive signature to rank order 1060 ToxCast chemicals, a subset of pVDCs and non-pVDCs were used to test the hypothesis that transgenic zebrafish can be used to evaluate and refine a predictive signature of developmental toxicity derived from human HTS in vitro data.
Material and Methods
pVDC Signature Refinement and Chemical Test Set Selection:
The pVDC signature was constructed based on the published Adverse Outcome Pathway (AOP) for embryonic vascular disruption [6; 7; 8]. The previous iteration of the signature was expanded to include newly available ToxCast assay data on critical vascular developmental targets including assays that measure events along the estrogen receptor (ER) pathway such as binding, dimerization, and transcription that could be relevant to downstream VEGF production, as well as assays that measure inhibition of proliferation in human primary vascular (endothelial and smooth muscle) cells. The ToxCast Phase I/II libraries (1060 unique compounds) were ranked according to their cumulative activity across 124 signature assays and visualized using the Toxicological Prioritization Index (ToxPi) tool [8; 18; 19]. This approach functions to rank chemicals based on their putative ability to disrupt blood vessel development. Briefly, the ToxPi score provides a dimensionless index that combines diverse HTS data sources and allows a formalized, rational integration of information from the different platforms. Visually, ToxPi is represented as component slices of a unit circle, with each slice representing information on a particular vascular developmental target (1–17 assays per slice depending on the target). The slice distance from the origin is proportional to the normalized value (e.g., assay potency) of the data points composing that slice, and all slices were set to have equal weight. To normalize the output, the slice weights were scaled to have a net sum of 1, producing ToxPi scores for every chemical between 0 and 1, where a score of 1 would indicate the chemical had the highest possible potency against every assay/target in every slice. The highest ToxPi score for any ToxCast chemical was 0.498 and the lowest was 0. Compounds with a pVDC score of 0 are predicted to be negative for vascular toxicity in vivo. A test set of 37 compounds with a broad range of pVDC scores (0–0.461) was selected for targeted testing in zebrafish.
Conservation of pVDC Signature Targets:
Primary amino acid sequences from 30 human (H. sapiens) pVDC signature proteins corresponding to ToxCast assay targets (Table 1) were compared across species calculating a percent similarity based on previously published methods [20]. Briefly, the NCBI human protein accessions were queried using BLASTp (http://www.ncbi.nlm.nih.gov/Blast.cgi. An E-value cut-off of 0.01 was used to calculate percent similarity. To visualize conservation, data from primary amino acid (aa) sequence alignments were filtered to report percent similarity for human, rabbit (O. cuniculus), rat (R. norvegicus), mouse (M. musculus), chicken (G. gallus), African clawed frog (X. laevis), Western clawed frog (X. (Silurana) tropicalis), zebrafish (D. rerio), Japanese medaka (O. latipes), rainbow trout (O. mykiss), roundworm (C. elegans), and water flea (D. pulex). For each signature protein, functional domain accessions were identified using the NCBI Conserved Domain database (http://www.ncbi.nlm.nih.gov/cdd/; Table 1). The criteria for functional domain selection from the human primary amino acid sequences were: 1) at least one, but no more than three domains should be evaluated per target molecule; 2) specific hits (defined by NCBI CDD; E-value < 0.01) were preferred to non-specific hits (E-value > 0.01); and 3) in an effort to avoid duplication of the primary amino acid sequence comparison, it was desirable to have the combination of residues from selected functional domains cover <70% of the full sequence. Domain-specific sequences were compared using reverse position specific (RPS)-BLAST [21] and a percent similarity for each domain was calculated across species. Sequence similarity data were visualized with ToxPis.
Table 1:
Human query proteins and select functional domains for sequence similarity evaluation across species. aType of Domain Hit defined by the NCBI CDD: Specific hits (S) meet or exceed a domain-specific e-value threshold and represent a very high confidence that the query sequence belongs to the same protein family as the sequences used to create the domain model; non specific hits (N) meet or exceed the RPS-BLAST (reverse-position specific-Basic Local Alignment Search Tool) threshold for statistical significance (default E-value cutoff of 0.01). National Center for Biotechnology Information (NCBI); Conserved Domain Database (CDD); amino acid (aa).
| Target Molecule | NCBI Protein Accession | NCBI CDD Accession | Domain Description (Summary) | aType of Hit | Domain Length (Residues) | % of Primary aa Sequence Covered by Selected Domains |
|---|---|---|---|---|---|---|
| Aryl hydrocarbon receptor | NP_001612.1 | cd00083 | Helix-loop-helix domain, found in DNA-binding proteins that act as transcription factors | S | 42 | 5.0% |
| Caspase 8 | NP_203519.1 | cd00032 cd08333 |
Caspase, interleukin-1 beta converting
enzyme Death effector domain, repeat 1, of Caspase-8 |
S S |
253 82 |
69.9% |
| C-C motif chemokine 2 | NP_002973.1 | cd00272 | Chemokine_CC: 1 of 4 subgroup designations of two N-terminal cysteine residues | S | 58 | 58.6% |
| C-X-C motif chemokine 10 | NP_001556.2 | cd00273 | Chemokine_CXC: 1 of 4 subgroup designations of two N-terminal cysteine residues | S | 65 | 65.7% |
| C-X-C motif chemokine 9 | NP_002407.1 | cd00273 | Chemokine_CXC: 1 of 4 subgroup designations of two N-terminal cysteine residues | S | 63 | 50.4% |
| Ephrin type-A receptor 1 | EAL23789.1 | cd09542 cd05033 cd10479 |
SAM (sterile alpha motif) domain of
EPH-A1 Catalytic domain Ligand Binding Domain of Ephrin type-A Receptor 1 |
S N S |
63 266 177 |
51.8% |
| Ephrin type-A receptor 2 | NP_004422.2 | cd05063 cd09543 cd10480 |
SAM (sterile alpha motif) domain of
EPH-A2 Catalytic domain Ligand Binding Domain of Ephrin type-A Receptor 2 |
S S S |
269 70 174 |
52.6% |
| Ephrin type-B receptor 1 | NP_004432.1 | cd05065 cd09551 cd10476 |
Catalytic domain SAM (sterile alpha motif) domain of EPH-B1 Ligand Binding Domain of Ephrin type-B Receptor 1 |
S S S |
269 68 176 |
52.1% |
| Estrogen receptor alpha | NP_000116.2 | cd06949 cd07171 |
Ligand binding domain DNA-binding domain |
S S |
238 82 |
53.8% |
| Fibroblast growth factor receptor 1 | NP_075598.2 | cd05098 | Catalytic domain | S | 302 | 36.7% |
| Hypoxia-inducible factor 1 alpha | NP_001521.1 | cd00083 pfam08778 pfam11413 |
Helix-loop-helix domain, found in DNA-
binding proteins that act as transcription factors HIF-1 alpha C terminal transactivation domain Hypoxia-inducible factor-1 |
S S S |
54 40 34 |
15.5% |
| Interleukin 1, alpha | NP_000566.3 | cd00100 pfam02394 |
Interleukin-1 homologes Interleukin-1 propeptide |
S S |
135 109 |
90.0% |
| Interleukin 6 | NP_000591.1 | pfam00489 | Interleukin-6/G-CSF/MGF family | S | 154 | 42.6% |
| Interleukin 8 | NP_000575.1 | cd00273 | Chemokine_CXC: 1 of 4 subgroup designations of two N-terminal cysteine residues | S | 64 | 64.6% |
| Matrix metalloproteinase 2 | NP_004521.1 | cd04278 cd00062 |
Zinc-dependent metalloprotease Fibronectin Type II domain |
S S |
318 48 |
48.2% |
| Matrix metalloproteinase 9 | AAM97934.1 | cd04278 cd00062 |
Zinc-dependent metalloprotease Fibronectin Type II domain |
S S |
330 48 |
46.7% |
| Nuclear factor kappa-light-chain-enhancer of activated B cells | NP_068810.3 | cd07885 cd01177 |
N-terminal sub-domain of the Rel homology
domain (RHD) of RelA IPT domainof the transcription factor NFkappaB |
S S |
169 97 |
48.3% |
| Plasminogen activator inhibitor-1 | NP_000593.1 | cd02051 | Plasminogen activator inhibitor-1_like | N | 378 | 94.0% |
| Protein tyrosine phosphatase, non-receptor type 11 | NP_002825.3 | cd00047 cd10340 cd09931 |
Catalyze the dephosphorylation of
phosphotyrosine peptides N-terminal Src homology 2 (N-SH2) domain C-terminal Src homology 2 (C-SH2) domain |
S S S |
244 99 108 |
76.1% |
| Protein tyrosine phosphatase, non receptor type 12 | NP_002826.3 | cd00047 | Catalyze the dephosphorylation of phosphotyrosine peptides | S | 233 | 29.9% |
| T-box A2 | NP_005985.3 | cd00182 pfam12598 |
T-box DNA binding domain T-box transcription factor |
S S |
186 78 |
37.1% |
| Transforming growth factor beta | P01137.2 | pfam00019 pfam00688 |
Transforming growth factor beta like domain
TGF-beta propeptide |
S S |
101 234 |
85.9% |
| Angiopoietin-1 receptor | NP_000450.2 | cd05088 | Catalytic domain | S | 303 | 27.0% |
| Tumor necrosis factor alpha | NP_000585.2 | cd00184 | Tumor Necrosis Factor | S | 144 | 61.8% |
| Urokinase-type plasminogen activator receptor | NP_002650.1 | cd00117 | Ly-6 antigen / uPA receptor -like domain | S | 82 | 24.5% |
| Urokinase-type plasminogen activator isoform 1 | NP_002649.1 | cd00190 | Trypsin-like serine protease | S | 244 | 56.6% |
| Vascular cell adhesion molecule 1 | NP_001069.1 | cd07689 | Second immunoglobulin (Ig)-like domain | S | 99 | 13.4% |
| Vascular endothelial growth factor receptor 1 | NP_002010.2 | cd14207 cd07702 cd05742 |
Catalytic domain Second immunoglobulin (Ig)-like domain First immunoglobulin (Ig)-like domain |
S S S |
339 72 78 |
36.5% |
| Vascular endothelial growth factor receptor 2 | NP_002244.1 | cd05103 cd05862 cd05864 |
Catalytic domain Second immunoglobulin (Ig)-like domain First immunoglobulin (Ig)-like domain |
S S S |
342 88 70 |
36.9% |
| Vascular endothelial growth factor receptor 3 | NP_891555.2 | cd05102 cd05862 cd05863 |
Catalytic domain Second immunoglobulin (Ig)-like domain First immunoglobulin (Ig)-like domain |
S S S |
340 85 67 |
36.1% |
Fish care and husbandry:
Transgenic Tg(kdrl:EGFP) and Tg(fli1:EGFP) lines were used to visualize and quantify blood vessel formation during development following chemical exposures. Tg(kdrl:EGFP)s843 /+ (AB) strain zebrafish (D. rerio) embryos were obtained from the Zebrafish International Resource Center (ZIRC) and reared and bred in an Association for Assessment and Accreditation of Laboratory Animals accredited facility at the U.S. EPA according to approved Institutional Animal Care and Use Committee protocols. Adult fish were maintained on a 14 h light/10 h dark schedule on a recirculating water system at 28±1°C with a pH of 7.0±0.2. Tg(fli1:EGFP)y1 were maintained at University College Dublin and treated in accordance with institutional ethical approval. Adult fish were maintained on a 14 h light/10 h dark cycle on a recirculating water system at 28±1°C with a pH of 7.0±0.3 Mating tanks were set up the day prior to embryo collection using basic approved breeding protocols specific to each facility.
Chemical Preparation:
For the 37 member chemical test set, chemical samples were procured, diluted in dimethyl sulfoxide (DMSO) and plated by Evotec at a stock concentration of 20 mM. Analytical QC methods were applied to the test set and a summary is shown in Supplemental Table S1.
EPA Angiogenesis Toxicity Screen:
Tg(kdrl:EGFP)s843/+ (AB) strain embryos were collected at U.S. EPA facilities on day 0 and bleached at 3–4 hours post fertilization (hpf) [22]. Based on previous methods [9], bleached embryos were housed in 100 mm Petri dishes at 26°C overnight. At 24 hpf, embryos were enzymatically or manually dechorionated and statically exposed to test compounds from 26–72 hours post fertilization (hpf) in glass 96 well plates containing 500 μl of test chemical in 10% Hanks’ balanced salt solution [22] at a final concentration of 0.4% DMSO. Exposures were initiated by 26 hpf in order to directly precede intersegmental vessel sprouting and purposefully exclude the initial 24 hpf period to avoid earlier, non-vessel related teratogenesis. At 72 hpf, embryos were transferred to 96-well plates with 40 μm mesh inserts (Millipore), washed 3X in 10% Hanks’, and visually assessed to identify the lowest observable effect level (LOEL) for overt toxicity. Preliminary concentration response studies were performed beginning at 80 μM using semi-log spacing. Subsequent studies began at the overt toxicity LOEL and used decreasing concentrations at quarter-log spacing to assess vascular toxicity. Two embryos per concentration per plate were assessed and each exposure was repeated for a total of four embryos per concentration. Each plate contained fourteen DMSO control wells and two wells containing the positive control 0.4 μM PTK787 (Selleck Chem; CAS#: 212141–51-0), a potent inhibitor of vascular endothelial growth factor receptor 2 (VEGFR2). Vascular defects in positive controls and normal vascular morphology in >85% of negative controls were required for plate inclusion in the study. At 72 hpf, embryos were washed, visually assessed, then anesthetized in 600 μM Eugenol and imaged on a Nikon Eclipse Ti fluorescence microscope with a Photometrix Coolsnap camera at 4X magnification using a GFP 525/50 filter with a 3.5 s exposure. Specifically, intersegmental vessel (ISV), caudal vein (CV), sub-intestinal vessel (SIV), yolk vessel, and eye (E) vessel structures were assessed. To confirm findings, hits and a subset of negatives were rescreened and images were collected using a Nikon A1 laser scanning confocal microscope (n=2 embryos/concentration; 6 concentrations/chemical with semi-log spacing). Image stacks with a 20 μm step size were collected of specimens illuminated with 488 nm laser excitation and a 525/50 emission filter. Maximum intensity projections were created from the stacks, rotated to common alignment, and image histograms were adjusted as appropriate.
UCD Hyaloid Vessel (HV) Toxicity Screen:
The effect of the test set on ocular blood vessel development was assessed in a previously reported zebrafish larval hyaloid vasculature screen [23]. Five, 48 hpf Tg(fli1: EGFP) embryos were placed in wells of a 48-well plate containing test chemicals in 400 μl of embryo medium [22]. For the primary screen, the 37 member test set was screened at 10 μM and 80 μM. Chemicals that were overtly toxic at 10 μM and/or 80 μM were rescreened at reduced concentrations until LOELs were obtained. Positive compounds and a subset of negatives were rescreened at five concentrations starting at the LOEL for overt toxicity using quarter-log spacing. All stock solutions were prepared in <0.4% DMSO. Larvae were incubated at 28°C with DMSO vehicle or the test compound until 120 hpf, when larvae were euthanized, fixed in 4% paraformaldehyde overnight at 4°C, then washed three times in 1X PBS. One eye from each larva was enucleated and the lens was dissected and imaged using an Olympus SZX16 fluorescent microscope. Each lens was scored based on the number of GFP positive HVs extending from the optic disk. Concentration-response experiments were performed a minimum of three times. A one-way analysis of variance with a Bonferroni’s Multiple Comparison Test was used to determine significance (p < 0.05).
Univariate Analysis:
To identify univariate (assay to endpoint) statistical associations, results from individual ToxCast in vitro assays were analyzed for their association with the in vivo zebrafish vascular toxicity compound screening results based on previously published methods [24; 25]. Briefly, the log AC50 values for each of the 821 in vitro HTS assays were compared with zebrafish toxicity results (EPA or UCD platforms). Additional zebrafish angiogenic toxicity from McCollum et al. was also used in the analysis [26]. Results were evaluated using continuous (Student’s t-test and Pearson’s correlation test) and dichotomous (chi-squared test) statistical methodology, with the level of significance returned as p values. For each assay, the t- test compares the mean log AC50 values for each of the two chemical groups (positive vs. negative), and the correlation test looks at the differences between the distributions of log AC50 values for each of the two groups. The dichotomous chi-squared test used a 2×2 contingency table to compare positive/negative in vitro assay results (existence of an AC50 value) with in vivo positive/negative developmental toxicity across chemicals. In vitro assays significantly associated with zebrafish angiogenic developmental toxicity (minimum p value of 0.05 from any method, ≥3 true positives) were retained.
Results
Constructing a pVDC signature for developmental vascular toxicity.
A predictive signature for embryonic vascular disruption was developed that coarsely includes four molecular signaling pathways (angiogenic signaling, ECM remodeling, vessel stabilization and cytokine signaling) that, when perturbed singularly or in combination, may disrupt developmental angiogenesis [7; 8]. This approach was used to group ToxCast chemicals by their in vitro bioactivity profiles to identify signatures that may correlate with in vivo vascular toxicity. Here, we expanded the predictive signature to include four primary cell proliferation assays and newly available data on previously included signature targets (Supplemental Table S2). In vitro ToxCast data on 124 assays mapping to 30 molecular targets in the predictive signature (Supplemental Table S3) was visualized using a ToxPi organized by pathway into cytokine signaling (red hues), vessel stabilization (purple hues), angiogenic signaling (blue hues), and ECM remodeling (green hues) sectors (Figure 1A). ToxPi profiles for the ToxCast Library (Supplemental Figure S1) and the test set selected for model evaluation (Figure 1B) are shown.
Figure 1: An AOP for embryonic vascular disruption.
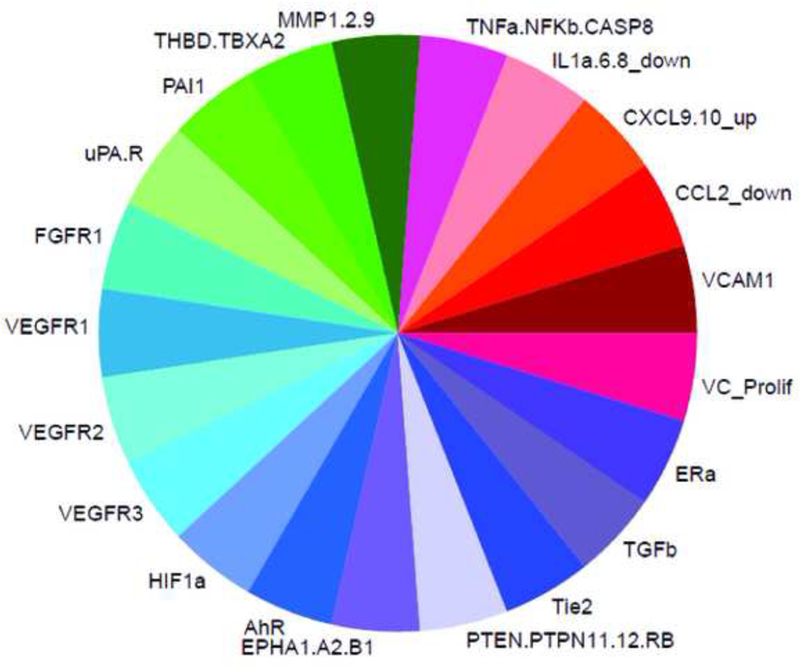
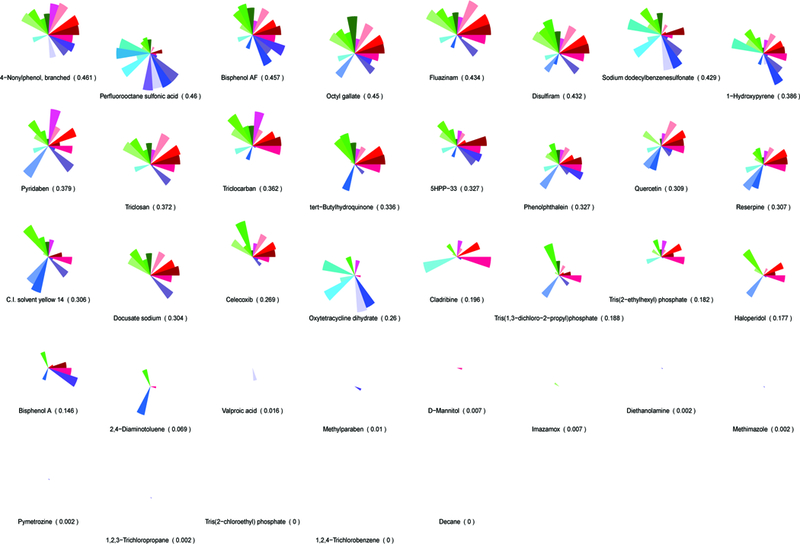
A predictive toxicity model was generated to group chemicals by their in vitro bioactivity profile and look for signatures that correlate with in vivo toxicity. (A) An AOP for embryonic vascular disruption was constructed by identifying initial molecular targets that are linked to developmental angiogenesis and coarsely map to 124/821 human in vitro ToxCast assays. ToxCast assays (124) mapping to 30 molecules are included in the ToxPi for putative vascular disrupting compounds (pVDCs). (B) The signature was used to rank order 1060 ToxCast chemicals and a 37 member chemical test set was selected. CASP8 (Caspase 8); CCL2 (chemokine (C-C motif) ligand 2); CXCL9.10 (C-X-C motif chemokine 9 and 10); EPHA1.A2.B1 (Ephrin receptor type A1, A2, and B2); ERa (Estrogen receptor alpha); FGFR (Fibroblast growth factor receptor); HIF1a (Hypoxia inducible factor 1 alpha); IL1a.6.8 (Interleukin 1a, 6, and 8); MMP1.2.9 (Matrix metalloproteinase 1, 2, and 9); NFkB (Nuclear factor kappa B); PAI1 (Plasminogen activator 1); PTEN (Phosphatase and tensin homolog); PTPN11.12 (Protein tyrosine phosphatase non-receptor type 11 and 12); PTPRB (Protein tyrosine phosphatase receptor type B); TBXA2 (Thromboxane A2): THBD (Thrombomodulin); Tie2 (TEK tyrosine kinase); TNFa (Tumor necrosis factor alpha); TGFb (Transforming growth factor beta); uPA (Urokinase-type plasminogen activator); uPAR (Urokinase receptor); VEGFR1.2.3 (Vascular endothelial growth factor receptor 1, 2, and 3); VCAM1 (vascular cell adhesion protein 1); VC_Prolif (Vascular cell proliferation).
Sequence similarity of the vascular toxicity predictive signature across model organisms.
The same 30 molecular targets in the pVDC signature were evaluated for protein sequence conservation compared to human, across commonly used model organisms, including zebrafish. Percent similarity for the entire primary amino acid sequence (Supplemental Figure S2 and Supplemental Table S4) and for key functional domains (Table 1, Figure 2B, and Supplemental Table S5) were used to evaluate signature conservation across model organisms. Zebrafish display high sequence similarity among proteins involved in the angiogenic and vessel remodeling pathways as compared to the ECM and cytokine pathways, demonstrated by the lack of identifiable orthologous zebrafish proteins representing IL1a and uPA and its receptor uPAR.
Figure 2: Sequence similarity of the vascular toxicity predictive signature across model organisms.
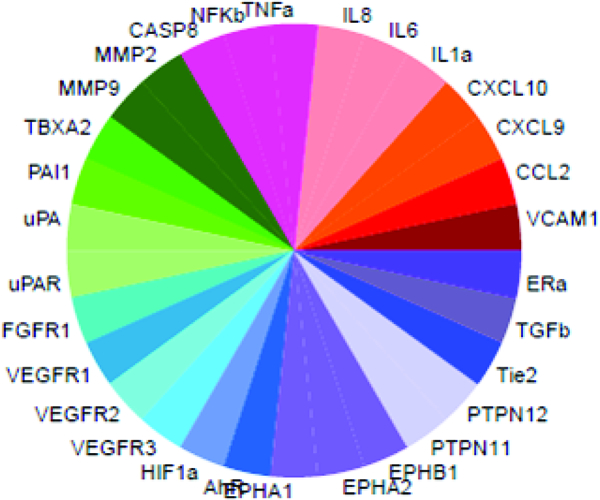
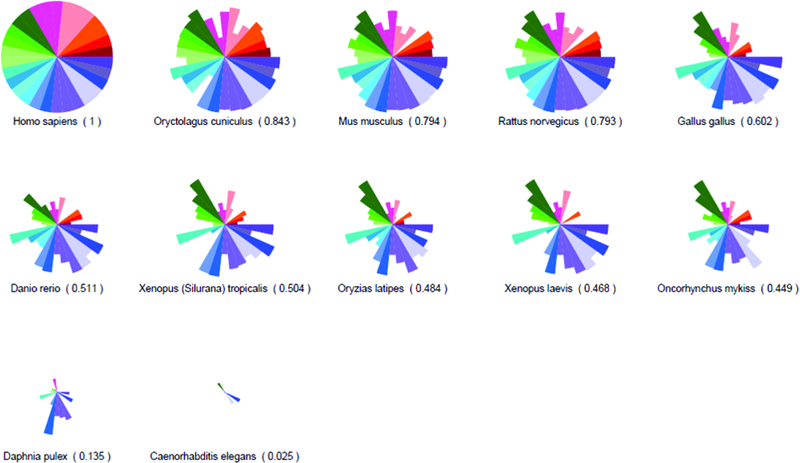
SeqAPASS was used to compare amino acid sequence conservation across common model organisms (relative to human) for each of the 30 molecules represented in the predictive signature. (A) ToxPi key with each protein represented by a single slice. (B) Percent similarity comparisons of selected key functional domains are shown. See Supplemental Table S4 and Supplemental Figure S2 for percent similarity comparisons across the entire primary amino acid sequences.
Identification of developmental angiogenesis inhibitors in zebrafish.
To identify angiogenic inhibitors, two zebrafish assays were used to evaluate different vessel structures during embryogenesis (Figure 3A). First, the pVDC test set was assessed in Tg(kdrl:EGFP) embryos exposed to test chemicals from 26–72 hpf and assessed for abnormal angiogenic development at 72 hpf (Figure 3A and [9]). In comparison to vehicle control larvae (Figure 3B), seven positives were identified: 1-hydroxypyrene and haloperidol (Figure 3C) and disulfiram, fluazinam, pyridaben, tert-butylhydroquinone, and triclocarban (Supplemental Figure S3). The remaining 30 test set compounds did not induce observable angiogenic inhibition in the absence of overt malformations, including bisphenol A and the thalidomide analog 5-HPP33 (Figure 3C). The seven active compounds affected multiple HTS targets in the predictive signature, with pVDC scores ranging from 0.145 to 0.434 (Table 2). Preliminary range-finding experiments revealed that all seven positive compounds produced overt embryotoxicity at higher concentrations (Figure 3C and Supplemental Figure S3). In addition, exposure to 50% (15/30) of the negatives also caused overt embryotoxicity demonstrating that the compound was transported into the embryo at sufficient concentrations to perturb development or viability.
Figure 3: Developmental angiogenesis toxicity assay.

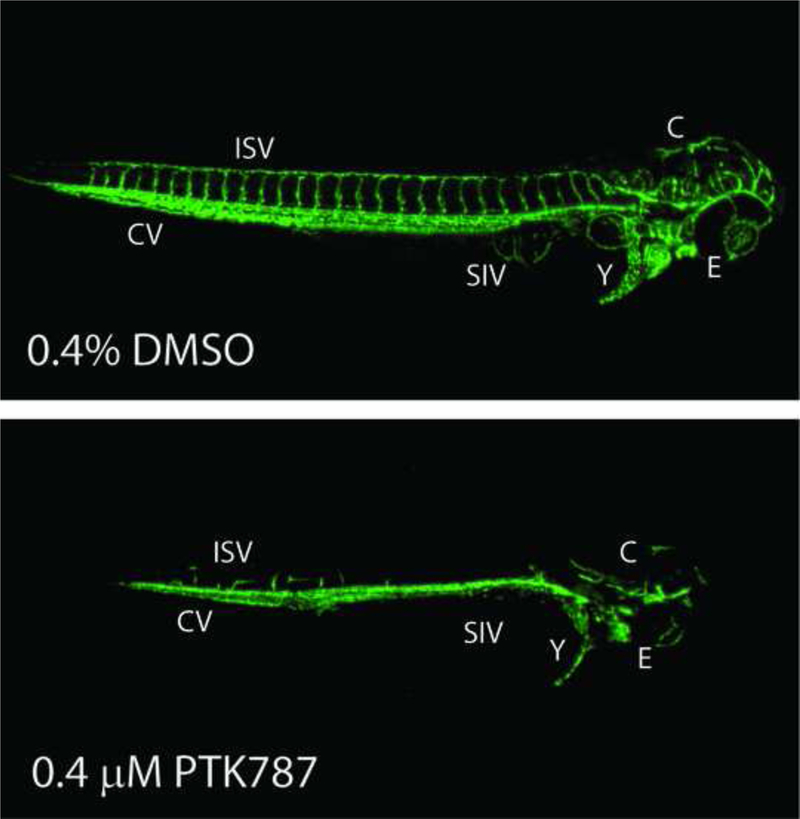
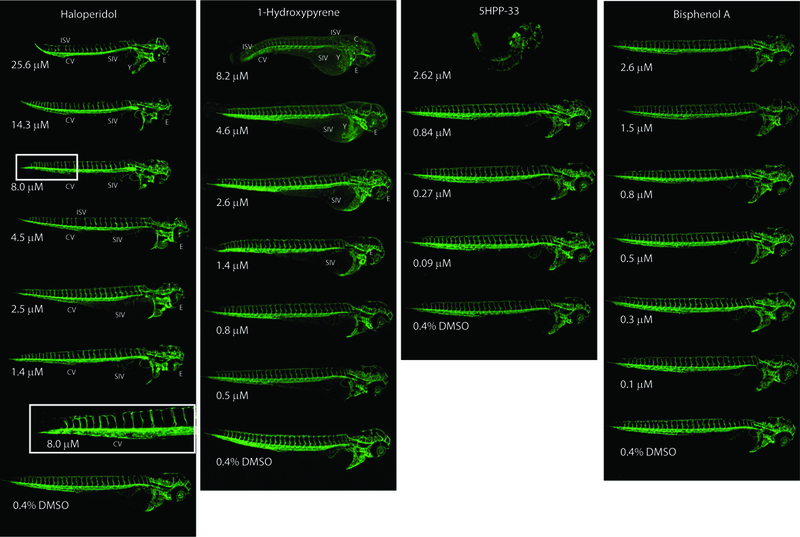
Dechorionated Tg(kdr1:EGFP) zebrafish embryos were exposed to 37 test chemicals from 26–72 hpf and imaged at 72 hpf. (A) Study design. (B) Representative negative and positive control images. (C) Hits were rescreened and representative images are shown here and in Supplemental Figure S3 (n = 2). Eye (E), cranial (C), caudal vein (CV), inter segmental vessels (ISV), sub intestinal vessels (SIV), and yolk (Y) vessels are noted.
Table 2:
Chemical hits that disrupt vessel development in zebrafish. pVDC scores, hit calls, and the LOELs (Lowest Observable Effect Level) for angiogenic-specific toxicity are shown. Environmental Protection Agency (EPA); University College Dublin (UCD); putative Vascular Disrupting Compound (pVDC).
| Chemical | pVDC Score | EPA Positive | EPA LOEL (μM) | UCD Positive | UCD LOEL (μM) |
|---|---|---|---|---|---|
| Fluazinam | 0.434 | Y | 0.26 | N | n/a |
| Disulfiram | 0.432 | Y | 0.14 | N | n/a |
| 1-Hydroxypyrene | 0.386 | Y | 1.4 | Y | 8.8 |
| Pyridaben | 0.379 | Y | 0.026 | N | n/a |
| Triclocarban | 0.362 | Y | 2.6 | N | n/a |
| Tert-Butylhydroquinone | 0.336 | Y | 8.2 | N | n/a |
| Haloperidol | 0.177 | Y | 1.4 | Y | 3.14 |
| Bisphenol A | 0.146 | N | n/a | Y | 15.68 |
An independent zebrafish hyaloid angiogenesis assay was also used to evaluate ocular angiogenesis following exposure to the chemical test set (Figure 3A, Figure 4A, and Supplemental Figure S4). Tg(fli1:EGFP) zebrafish embryos were exposed to the chemical test set from 48 to 120 hpf and assessed at 120 hpf. Two compounds that were identified in the broad developmental screen were also identified as positives in the hyaloid vessel assay: 1-hydroxypyrene and haloperidol (Figure 4B-C). The hyaloid angiogenesis assay also identified bisphenol A as a novel positive compound (Figure 4B-C). Taken together, zebrafish angiogenesis assays identified eight positive and 29 negative compounds (Table 2 and Supplemental Table S6).
Figure 4: Hyaloid vessel assay.

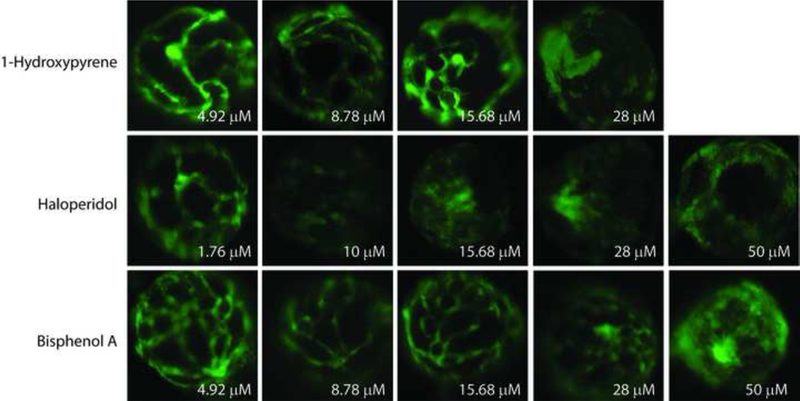

Tg(fli1:EGFP) zebrafish embryos were exposed to 37 test chemicals from 48–120 hpf. GFP positive hyaloid primary branches covering the back of the lens were imaged and quantified on an Olympus SZX16 fluorescence microscope (n = 3 with 5 larvae per well per concentration) (Supplemental Figure S4). (A) Representative negative and positive control (Su) images are shown. Primary hyaloid vessel (HV) branches (white arrows) emerge from the optic disk (asterisk). (B) Representative images and (C) HV vessel quantification for haloperidol, 1-hydroxypyrene, and bisphenol A are shown.
Evaluation of the pVDC signature using in vivo developmental angiogenic toxicity.
To determine which of the 124 assays in the pVDC signature best correlated with angiogenic inhibition in the zebrafish assays, statistical associations between in vitro HTS and zebrafish angiogenesis toxicity data were examined (Figure 5A). Data generated here were combined with angiogenesis toxicity data from McCollum et al. ([26]; hit calls summarized in Supplemental Table S6). Hit calls were identical for seven compounds that were tested in the EPA and UH studies: bisphenol A, imazamox, oxytetracycline dehydrate, perfluorooctane sulfonic acid, pymetrozine, pyridaben, and triclosan (Supplemental Figure S3 and Supplemental Table S6). Univariate associations were filtered based on significance, revealing 132 associated assays, 33 of which were already captured in the pVDC signature, and 689 non-significant assays (Figure 5A-B and Supplemental Table S7). We mapped 30 of the 33 correlative assays to chemokine and ECM pathways (Figure 5C). One assay from the angiogenic signaling sector (VEGFR2) was predictive of developmental angiogenesis toxicity in zebrafish, while two ER assays (vessel remodelling quadrant) were also significant (Figure 5C). The majority of assays in the pVDC signature (92/124) were not predictive of angiogenic inhibition in zebrafish.
Figure 5: Evaluation of the pVDC signature using zebrafish angiogenesis toxicity data.
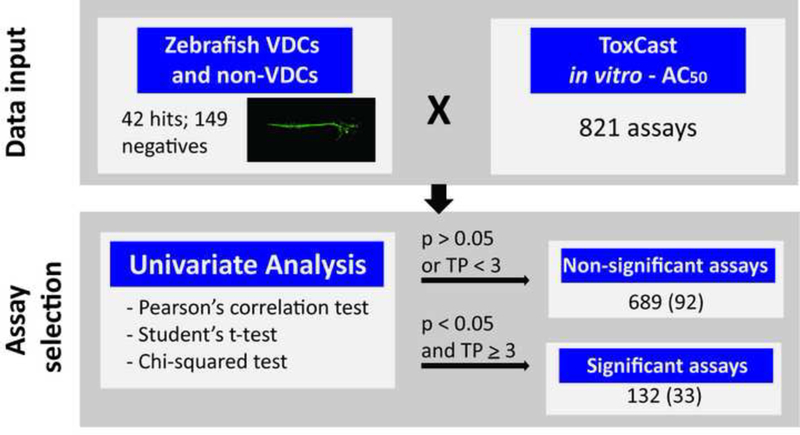
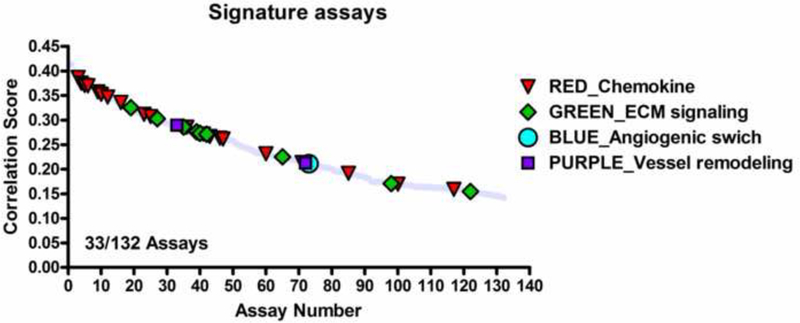
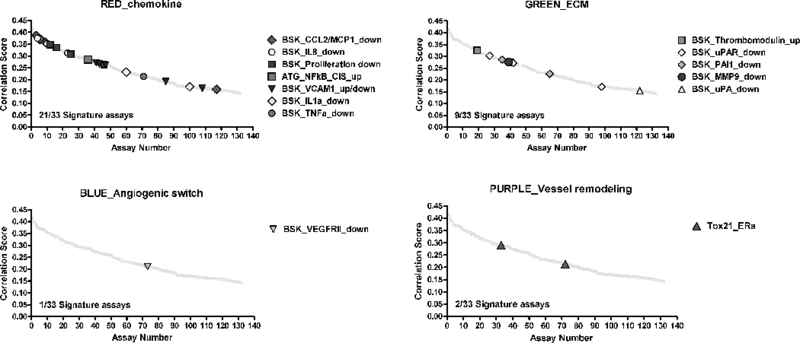
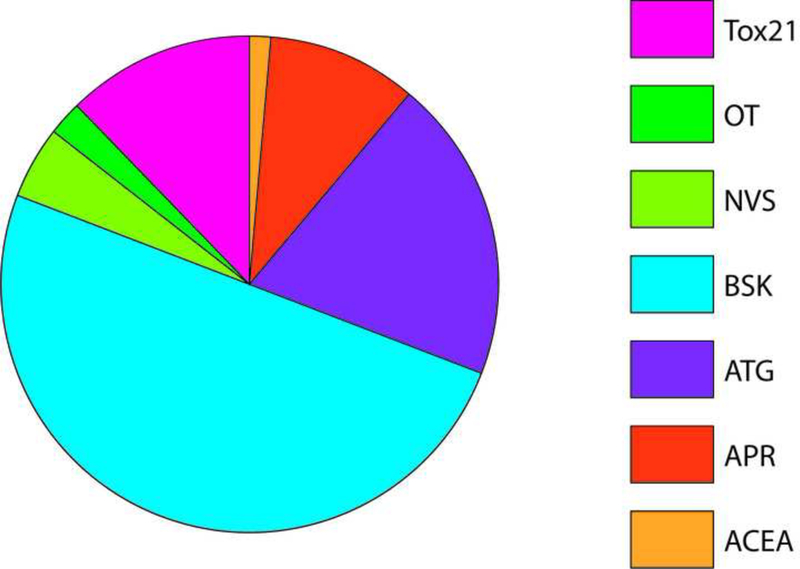
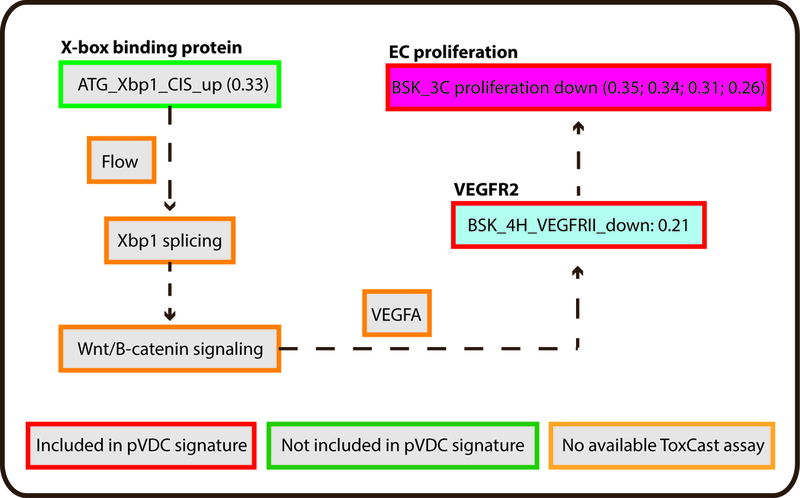
ToxCast in vitro HTS assay data consisted of AC50 values for 1060 chemicals across 821 assays. To identify HTS assays that are correlated with angiogenic inhibition in zebrafish, ToxCast data were compared to chemicals that produce angiogenic inhibition in any zebrafish assay (EPA and UCD data in addition to data on 161 ToxCast Phase 1 chemicals screened by M. Bondesson Lab at UH; Supplemental Tables S6-7) via univariate analysis. (A-B) Univariate schematic reveals that 132 ToxCast assays are correlated with angiogenic inhibition in zebrafish, 33 of which were already captured in the pVDC signature. (C) Signature assays by AOP pathway/quadrant are shown. ToxCast assays for CCL2 (red), IL1a.6.8 (pink), vascular cell proliferation (dark pink), VEGFR2 (blue) Ephrins (purple), and PTPN (light purple) are highlighted among all correlated assays. Thirty of the 33 correlative pVDC signature assays mapped to chemokine and ECM pathways. Univariate associations identified were mined for relationships that may be informative of angiogenic inhibition in vivo but are not contained in the pVDC signature. (D) Assay platform for all ToxCast assays significantly associated with angiogenic inhibition in one or more zebrafish assays. (E) Newly identified ToxCast assays positively correlated with developmental angiogenic inhibition in zebrafish that relate xbp1-mediated flow are shown.
Novel identification of ToxCast HTS assays correlated with developmental angiogenic inhibition in zebrafish.
To identify assays that may be informative of vascular toxicity in vivo but were not contained in the initial pVDC signature, a non a priori test was conducted to mine univariate associations. HTS assays correlated with angiogenic inhibition in zebrafish were parsed by ToxCast assay platform (Figure 5D and Supplementary Table S7). The Bioseek platform, consisting of complex human primary cell culture systems, contained 50% of assays that were significantly associated with toxicity in vivo. Transcriptional assays included in the Attagene and Tox21 assay suites accounted for an additional 46% of significant assays. ACEA, Odyssey Thera, and the cell-free enzymatic Novascreen assays were generally less predictive of zebrafish vascular toxicity and collectively contained <10% of significantly correlated assays. Highly correlated novel HTS assays include an x-box binding protein transcriptional assay (Xbp1; Figure 5E) and two primary endothelial cell death assays.
Discussion
Zebrafish screens identified novel angiogenic inhibitors.
The HTS-based pVDC signature enables hierarchical ranking of 1060 chemicals that overwhelmingly lack in vivo developmental toxicity data. To qualify predictions generated by the pVDC signature, we leveraged two distinct zebrafish-based screening assays and identified two compounds that produced angiogenic inhibition in both zebrafish platforms at similar concentrations: 1-hydroxypyrene (1.4 μM vs. 8.8 μM) and haloperidol (1.4 μM vs. 3.1 μM). Another six compounds (bisphenol A, disulfiram, fluazinam, pyridaben, tert-butylhydroquinone, and triclocarban) were positive in one of the platforms, demonstrating the added value of testing chemicals with different exposure periods and morphological endpoints. With the exception of bisphenol A [27], angiogenic inhibition during development has not been previously associated with exposure to 1-hydroxypyrene, disulfiram, fluazinam, haloperidol, pyridaben, tert-butylhydroquinone, or triclocarban.
In the case of bisphenol A, structural abnormalities in maternal and fetal placental vasculature in mice [27] and sub intestinal vessels (SIV) in zebrafish [28], have been reported. Although we did not observe SIV defects in the present study, significant reductions in hyaloid vessel number were detected in bisphenol A-exposed zebrafish. All eight compounds positive for angiogenic inhibition produced overt malformations at higher concentrations, consistent with results from large-scale chemical screens [29; 30]. This is also in line with our previous finding that vascular disruption during angiogenesis is associated with overt toxicity and mortality at higher concentrations or as development progresses [9] and suggests that overt toxicity in zebrafish may serve as an initial indication of the likelihood of a chemical to cause angiogenic inhibition at lower concentrations.
Zebrafish angiogenic disruptors produce skeletal malformations in rodent and fish studies.
Development of the skeletal system is sensitive to inhibitors of angiogenesis like thalidomide [31]. Exposure to four of eight compounds identified as angiogenic inhibitors in zebrafish also cause skeletal abnormalities in zebrafish and/or mammals, including disulfiram, fluazinam, haloperidol, and pyridaben. In developing rats, exposure to the broad spectrum fungicide fluazinam results in a constellation of skeletal defects, including incomplete ossification of the intraparietal, pubic, and thoracic bones, and caudal vertebrae (Studies available in ToxRefDB http://www.epa.gov/ncct/toxcast/data.html). Disulfiram (Antabuse) is a dithiocarbamate pesticide that is also used to treat chronic alcoholism. In zebrafish, developmental exposure to disulfiram results in craniofacial defects that involve dysregulation of sox9a expression [32]. A separate study reported malformations in zebrafish exposed to disulfiram including cranial, visceral arch, and spinal cord defects, and decreased ossification [33]. Exposure to the pesticide pyridaben produced incomplete ossification in the sternebra, thoracic centrum, and supraoccipital structures in a prenatal developmental toxicity guideline study in rats (ToxRefDB). Finally, the antipsychotic drug haloperidol was shown to decrease bone density in female rats [34], although this finding was not confirmed in separate rat study with a different design [35]. Collectively, these data identify a possible anti-angiogenic mechanism by which a diverse set of chemicals might produce skeletal abnormalities in vivo.
Chemical negatives for angiogenic inhibition.
While the majority of compounds that were positive for angiogenic inhibition in vivo had relatively high pVDC scores, a substantial number of highly ranked putative VDCs were not angiogenic inhibitors in zebrafish. Of particular note, 5HPP-33, a thalidomide analog that has potent anti-angiogenic activity in an in vitro human umbilical vein endothelial cell (HUVEC) assay [36], was negative for angiogenic inhibition in the current study at concentrations tested up to 80 μM. However, the compound is potent for developmental toxicity, causing severe malformations in the low micromolar range. A lack of angiogenic inhibition coupled with embryotoxicity was also noted in a separate zebrafish study following developmental exposure to 5HPP-33 [26]. These data indicate that 5HPP-33 may be developmentally toxic in zebrafish via mechanisms other than angiogenic inhibition. A recent publication showed that 5HPP-33 directly binds tubulin and disrupts microtubule dynamics during cellular mitosis [37] providing a mechanistic possibility for the widespread teratogenicity observed in the current study and McCollum et al. [26]. Similar to 5HPP-33, a total of 14 of 29 chemicals that were negative for vascular toxicity caused malformations in zebrafish, including compounds like bisphenol AF, 4-nonylphenol, octyl gallate, and perfluorooctanesulfonic acid that were highly ranked by the predictive signature. This suggests that chemical uptake or biotransformations were not limiting factors in mediating toxicity and these compounds could therefore be classified as negatives in the zebrafish assays. To classify the remaining compounds that were negative for angiogenic and overt toxicity, more studies are required to determine whether the nominal concentrations tested were sufficient to gain entry into the developing organism and whether these compounds may have effects outside of the exposure window used in the current study. Because chemical exposures commenced at 26 hpf, the current study design had the potential to generate false negatives that affect early vascular development including angioblast differentiation and migration. Further work could be targeted towards understanding the effects on those processes.
Zebrafish angiogenesis toxicity data can be used to evaluate a human HTS-based pVDC signature.
We hypothesized that comparisons between the zebrafish and human HTS datasets would enable qualification of predictions generated by the human-based pVDC signature using data generated in zebrafish. The 821 HTS assays were filtered based on univariate correlations with angiogenic inhibition in vivo to reveal 132 statistically significant correlations, including inhibition of VEGFR2 expression and endothelial cell proliferation. A number of significant associations (33/132) were already captured in the 124 assay pVDC signature. These 33 assays primarily map to the cytokine and ECM signaling pathways, despite less overall homology of signature proteins between zebrafish and humans relative to vessel remodeling and angiogenic signaling sector proteins as demonstrated by the lack of identifiable orthologous zebrafish proteins representing IL1a and uPA and its receptor uPAR. This suggests that the chemokine and ECM signaling pathways are active and responsive to xenobiotic disruption in zebrafish. Of the 33 significant pVDC signature assays, 30 were run on the Bioseek platform, which is comprised of multiple primary cell cultures. These data suggest that, relative to non-primary cell HTS assays, data derived from the primary cell cultures may be more predictive of angiogenic inhibition in vivo in zebrafish. In a screen of 88 reference compounds in stimulated human primary endothelial cells, thrombomodulin protein expression was upregulated following exposure to HDAC, Hsp90, IKK2, p38 MAPK, or protease inhibitors [38; 39]. Unique to the thrombomodulin endpoint, none of the 88 reference inhibitors caused a downregulation of thrombomodulin. Similar to these data, in the current study two thrombomodulin assays were the only “up-regulated” pVDC signature assays that were significantly correlated with zebrafish angiogenic inhibition. Because the thrombomodulin assays are capable of detecting >10% change in thrombomodulin expression [38; 39], we propose that these in vitro assays might be particularly predictive of angiogenic-specific toxicity in developing zebrafish embryos.
Zebrafish data can be used to mine the ToxCast assay universe for novel associations predictive of angiogenic inhibition in vivo.
In addition to testing the pVDC signature, we also hypothesized that comparisons between the zebrafish and human HTS datasets would generate novel associations that could inform refinement of the human-based predictive model. Of the 132 HTS assays that were significantly correlated with zebrafish angiogenic inhibition, 99 were not included in the most recent iteration of the predictive signature. Overall, primary cell co-cultures comprised 50% of significantly correlated assays. Two of the most highly correlated HTS cell death assays with vascular toxicity in zebrafish were primary endothelial cell death assays in the 4H and 3C co-culture systems. Because endothelial cell death is related to inhibition of angiogenesis, we propose to add these assays to future iterations of the pVDC signature. Another novel association detected by the analyses related to Xbp1. Upregulation of the Xbp1 transcriptional expression assay was highly correlated with angiogenic inhibition during development. Post-transcriptional splicing of the xbpl transcript is controlled by vascular flow and is upstream of canonical Wnt signaling-dependent endothelial cell proliferation [40; 41]. Both flow/shear stress [10; 11] and Wnt-signaling [12] are known to control VEGFR2-dependent angiogenesis but were not included in the pVDC signature because of a lack of suitable assays. We propose that Xbp1 upregulation may serve as a proxy measurement for flow-mediated patterning and canonical Wnt signaling.
Conclusions.
The zebrafish model contains regional specification of blood vessel networks that are representative of vascular architecture in higher order vertebrates. This research has filled a critical need for an integrated in vivo platform that can identify HTS assays predictive of angiogenic inhibition in vivo and thus be used to evaluate a pathway-level model predictive of developmental vascular toxicity. In addition to supporting model validation, zebrafish data can refine the pVDC signature by adding novel HTS assays that are highly correlated with in vivo angiogenic inhibition.
Supplementary Material
Acknowledgements:
We thank Kim Howell, Ned Collins, and Leslie Martin for fish husbandry and ZIRC (RR12546) for providing Tg(kdrl:EGFP)s843/+ embryos. We are grateful to Nisha Sipes and Dane Filer for R scripts, Ann Richard for chemical QC data, and Aimen Farraj, Neil Vargesson, Charlene McQueen, and Sid Hunter for their critical review of the manuscript. This manuscript has been reviewed by the U.S. EPA and the NIEHS NTP and approved for publication. Approval does not signify that the contents reflect the views of the Agency, nor does mention of trade names or commercial products constitute endorsement or recommendation for use.
Footnotes
The authors declare that they have no competing financial interests.
References
- [1].Chung AS,Ferrara N. Developmental and pathological angiogenesis. Annual review of cell and developmental biology. 2011;27: 563–84. [DOI] [PubMed] [Google Scholar]
- [2].Bonventre JA, White LA,Cooper KR. Methyl tert butyl ether targets developing vasculature in zebrafish (Danio rerio) embryos. Aquatic toxicology. 2011;105: 29–40. [DOI] [PMC free article] [PubMed] [Google Scholar]
- [3].Lin C, Wu M,Dong J. Quercetin-4’-O-beta-D-glucopyranoside (QODG) inhibits angiogenesis by suppressing VEGFR2-mediated signaling in zebrafish and endothelial cells. PloS one. 2012;7: e31708. [DOI] [PMC free article] [PubMed] [Google Scholar]
- [4].Yeh CH, Liao YF, Chang CY, Tsai JN, Wang YH, Cheng CC, et al. Caffeine treatment disturbs the angiogenesis of zebrafish embryos. Drug and chemical toxicology. 2012; [DOI] [PubMed] [Google Scholar]
- [5].van Gelder MM, van Rooij IA, Miller RK, Zielhuis GA, de Jong-van den Berg LT,Roeleveld N. Teratogenic mechanisms of medical drugs. Human reproduction update. 2010;16: 378–94. [DOI] [PubMed] [Google Scholar]
- [6].Kleinstreuer N, Dix D, Rountree M, Baker N, Sipes N, Reif D, et al. A computational model predicting disruption of blood vessel development. PLoS computational biology. 2013;9: e1002996. [DOI] [PMC free article] [PubMed] [Google Scholar]
- [7].Kleinstreuer NC, Judson RS, Reif DM, Sipes NS, Singh AV, Chandler KJ, et al. Environmental impact on vascular development predicted by high-throughput screening. Environmental health perspectives. 2011;119: 1596–603. [DOI] [PMC free article] [PubMed] [Google Scholar]
- [8].Knudsen TB,Kleinstreuer NC. Disruption of embryonic vascular development in predictive toxicology. Birth defects research. Part C, Embryo today : reviews. 2011;93: 312–23. [DOI] [PubMed] [Google Scholar]
- [9].Tal TL, McCollum CW, Harris PS, Olin J, Kleinstreuer N, Wood CE, et al. Immediate and long-term consequences of vascular toxicity during zebrafish development. Reproductive toxicology. 2014;48: 51–61. [DOI] [PubMed] [Google Scholar]
- [10].dela Paz NG, Walshe TE, Leach LL, Saint-Geniez M,D’Amore PA. Role of shear-stress-induced VEGF expression in endothelial cell survival. Journal of cell science. 2012;125: 831–43. [DOI] [PMC free article] [PubMed] [Google Scholar]
- [11].Nicoli S, Standley C, Walker P, Hurlstone A, Fogarty KE,Lawson ND. MicroRNA-mediated integration of haemodynamics and Vegf signalling during angiogenesis. Nature. 2010;464: 1196–200. [DOI] [PMC free article] [PubMed] [Google Scholar]
- [12].Gore AV, Swift MR, Cha YR, Lo B, McKinney MC, Li W, et al. Rspo1/Wnt signaling promotes angiogenesis via Vegfc/Vegfr3. Development. 2011;138: 4875–86. [DOI] [PMC free article] [PubMed] [Google Scholar]
- [13].Korn C, Scholz B, Hu J, Srivastava K, Wojtarowicz J, Arnsperger T, et al. Endothelial cell-derived non- canonical Wnt ligands control vascular pruning in angiogenesis. Development. 2014;141: 1757–66. [DOI] [PubMed] [Google Scholar]
- [14].Torres-Vazquez J, Gitler AD, Fraser SD, Berk JD, Van NP, Fishman MC, et al. Semaphorin-plexin signaling guides patterning of the developing vasculature. Developmental cell. 2004;7: 117–23. [DOI] [PubMed] [Google Scholar]
- [15].Icli B, Wara AK, Moslehi J, Sun X, Plovie E, Cahill M, et al. MicroRNA-26a regulates pathological and physiological angiogenesis by targeting BMP/SMAD1 signaling. Circulation research. 2013;113: 1231–41. [DOI] [PMC free article] [PubMed] [Google Scholar]
- [16].Gunnarsson L, Jauhiainen A, Kristiansson E, Nerman O,Larsson DG. Evolutionary conservation of human drug targets in organisms used for environmental risk assessments. Environmental science & technology. 2008;42: 5807–13. [DOI] [PubMed] [Google Scholar]
- [17].Howe K, Clark MD, Torroja CF, Torrance J, Berthelot C, Muffato M, et al. The zebrafish reference genome sequence and its relationship to the human genome. Nature. 2013;496: 498–503. [DOI] [PMC free article] [PubMed] [Google Scholar]
- [18].Reif DM, Martin MT, Tan SW, Houck KA, Judson RS, Richard AM, et al. Endocrine profiling and prioritization of environmental chemicals using ToxCast data. Environmental health perspectives. 2010;118: 1714–20. [DOI] [PMC free article] [PubMed] [Google Scholar]
- [19].Filer D, Patisaul HB, Schug T, Reif D,Thayer K. Test driving ToxCast: endocrine profiling for 1858 chemicals included in phase II. Current opinion in pharmacology. 2014;19: 145–52. [DOI] [PMC free article] [PubMed] [Google Scholar]
- [20].LaLone CA, Villeneuve DL, Burgoon LD, Russom CL, Helgen HW, Berninger JP, et al. Molecular target sequence similarity as a basis for species extrapolation to assess the ecological risk of chemicals with known modes of action. Aquatic toxicology. 2013;144–145: 141–54. [DOI] [PubMed] [Google Scholar]
- [21].Marchler-Bauer A, Lu S, Anderson JB, Chitsaz F, Derbyshire MK, DeWeese-Scott C, et al. CDD: a Conserved Domain Database for the functional annotation of proteins. Nucleic acids research. 2011;39: D225–9. [DOI] [PMC free article] [PubMed] [Google Scholar]
- [22].Westerfield M The Zebrafish Book. 5th Edition University of Oregon Press, Eugene, OR: 2007; [Google Scholar]
- [23].Alvarez Y, Astudillo O, Jensen L, Reynolds AL, Waghorne N, Brazil DP, et al. Selective inhibition of retinal angiogenesis by targeting PI3 kinase. PloS one. 2009;4: e7867. [DOI] [PMC free article] [PubMed] [Google Scholar]
- [24].Sipes NS, Martin MT, Reif DM, Kleinstreuer NC, Judson RS, Singh AV, et al. Predictive models of prenatal developmental toxicity from ToxCast high-throughput screening data. Toxicological sciences : an official journal of the Society of Toxicology. 2011;124: 109–27. [DOI] [PubMed] [Google Scholar]
- [25].Martin MT, Knudsen TB, Reif DM, Houck KA, Judson RS, Kavlock RJ, et al. Predictive model of rat reproductive toxicity from ToxCast high throughput screening. Biology of reproduction. 2011;85: 327–39. [DOI] [PubMed] [Google Scholar]
- [26].McCollum CW, Conde Vancells J, Hans C, Vazquez-Chantada M, Kleinstreuer N, Tal T, et al. Identification of vascular disruptor compounds by a tiered analysis in zebrafish embryos and mouse embryonic endothelial cells. Reproductive Toxicology. Under review. 2016; [DOI] [PMC free article] [PubMed] [Google Scholar]
- [27].Tait S, Tassinari R, Maranghi F,Mantovani A. Bisphenol A affects placental layers morphology and angiogenesis during early pregnancy phase in mice. Journal of applied toxicology : JAT. 2015; [DOI] [PubMed] [Google Scholar]
- [28].Lam SH, Hlaing MM, Zhang X, Yan C, Duan Z, Zhu L, et al. Toxicogenomic and phenotypic analyses of bisphenol-A early-life exposure toxicity in zebrafish. PloS one. 2011;6: e28273. [DOI] [PMC free article] [PubMed] [Google Scholar]
- [29].Padilla S, Corum D, Padnos B, Hunter DL, Beam A, Houck KA, et al. Zebrafish developmental screening of the ToxCast Phase I chemical library. Reproductive toxicology. 2012;33: 174–87. [DOI] [PubMed] [Google Scholar]
- [30].Truong L, Reif DM, St Mary L, Geier MC, Truong HD,Tanguay RL. Multidimensional in vivo hazard assessment using zebrafish. Toxicological sciences : an official journal of the Society of Toxicology. 2014;137: 212–33. [DOI] [PMC free article] [PubMed] [Google Scholar]
- [31].Vargesson N Thalidomide-induced teratogenesis: History and mechanisms. Birth defects research. Part C, Embryo today : reviews. 2015;105: 140–56. [DOI] [PMC free article] [PubMed] [Google Scholar]
- [32].van Boxtel AL, Pieterse B, Cenijn P, Kamstra JH, Brouwer A, van Wieringen W, et al. Dithiocarbamates induce craniofacial abnormalities and downregulate sox9a during zebrafish development. Toxicological sciences : an official journal of the Society of Toxicology. 2010;117: 209–17. [DOI] [PubMed] [Google Scholar]
- [33].Strecker R, Weigt S,Braunbeck T. Cartilage and bone malformations in the head of zebrafish (Danio rerio) embryos following exposure to disulfiram and acetic acid hydrazide. Toxicology and applied pharmacology. 2013;268: 221–31. [DOI] [PubMed] [Google Scholar]
- [34].Kunimatsu T, Kimura J, Funabashi H, Inoue T,Seki T. The antipsychotics haloperidol and chlorpromazine increase bone metabolism and induce osteopenia in female rats. Regulatory toxicology and pharmacology : RTP. 2010;58: 360–8. [DOI] [PubMed] [Google Scholar]
- [35].Costa JL, Smith G, Watson M, Lin JM, Callon K, Gamble G, et al. The atypical anti-psychotic clozapine decreases bone mass in rats in vivo. Schizophrenia research. 2011;126: 291–7. [DOI] [PubMed] [Google Scholar]
- [36].Noguchi T, Fujimoto H, Sano H, Miyajima A, Miyachi H,Hashimoto Y. Angiogenesis inhibitors derived from thalidomide. Bioorganic & medicinal chemistry letters. 2005;15: 5509–13. [DOI] [PubMed] [Google Scholar]
- [37].Rashid A, Kuppa A, Kunwar A,Panda D. Thalidomide (5HPP-33) suppresses microtubule dynamics and depolymerizes the microtubule network by binding at the vinblastine binding site on tubulin. Biochemistry. 2015;54: 2149–59. [DOI] [PubMed] [Google Scholar]
- [38].Berg EL, Yang J,Polokoff MA. Building predictive models for mechanism-of-action classification from phenotypic assay data sets. Journal of biomolecular screening. 2013;18: 1260–9. [DOI] [PubMed] [Google Scholar]
- [39].Berg EL, Polokoff MA, O’Mahony A, Nguyen D,Li X. Elucidating mechanisms of toxicity using phenotypic data from primary human cell systems--a chemical biology approach for thrombosis-related side effects. International journal of molecular sciences. 2015;16: 1008–29. [DOI] [PMC free article] [PubMed] [Google Scholar]
- [40].Zeng L, Xiao Q, Chen M, Margariti A, Martin D, Ivetic A, et al. Vascular endothelial cell growth- activated XBP1 splicing in endothelial cells is crucial for angiogenesis. Circulation. 2013;127: 1712–22. [DOI] [PubMed] [Google Scholar]
- [41].Duan Q, Yang L, Gong W, Chaugai S, Wang F, Chen C, et al. MicroRNA-214 Is Upregulated in Heart Failure Patients and Suppresses XBP1-Mediated Endothelial Cells Angiogenesis. Journal of cellular physiology. 2015;230: 1964–73. [DOI] [PMC free article] [PubMed] [Google Scholar]
Associated Data
This section collects any data citations, data availability statements, or supplementary materials included in this article.


