Abstract
Objective
To describe variability in concussion biomarker concentrations collected from serum in a sample of healthy collegiate athletes, as well as report reliability metrics in a subsample of female athletes.
Methods
In this observational cohort study, β-amyloid peptide 42 (Aβ42), total tau, S100 calcium binding protein B (S100B), ubiquitin carboxy-terminal hydrolyzing enzyme L1 (UCH-L1), glial fibrillary acidic protein, microtubule associated protein 2, and 2′,3′-cyclic-nucleotide 3′-phosphodiesterase (CNPase) serum concentrations were measured in 415 (61% male, 40% white, aged 19.0 ± 1.2 years) nonconcussed collegiate athletes without recent exposure to head impacts. Standardized normative distributions are reported for each biomarker. We evaluated main effects (analyses of variance) of sex and race, reporting demographic-specific normative metrics when appropriate. In a subset of 31 female participants, test-retest reliability (Pearson r) and reliable change indices (80%, 90%, and 95% confidence intervals) across a 6- to 12-month interval are reported for Aβ42, total tau, S100B, and UCH-L1.
Results
Males exhibited higher UCH-L1 (p < 0.001, Cohen d = 0.75) and S100B (p < 0.001, d = 0.56) than females, while females had higher CNPase (p < 0.001, d = 0.43). Regarding race, black participants had higher baseline levels of UCH-L1 (p < 0.001, d = 0.61) and S100B (p < 0.001, d = 1.1) than white participants. Conversely, white participants had higher baseline levels of Aβ42 (p = 0.005, d = 0.28) and CNPase (p < 0.001, d = 0.46). Test-retest reliability was generally poor, ranging from −0.02 to 0.40, and Aβ42 significantly increased from time 1 to time 2.
Conclusion
Healthy collegiate athletes express concussion-related serum biomarkers in variable concentrations. Accounting for demographic factors such as sex and race is essential. Evidence suggested poor reliability for serum biomarkers; however, understanding how other factors influence biomarker expression, as well as knowledge of reliable change metrics, may improve clinical interpretation and future study designs.
Athletes frequently experience sport-related concussions (SRCs).1,2 Blood biomarkers are increasingly studied in the clinical setting (e.g., emergency departments). Their potential use for objectively characterizing SRC pathophysiology is now being explored.3–5 The primary focus of current research for SRC has been diagnostic sensitivity and specificity, but to date, no markers have been validated for clinical use.6,7
A recent systematic review of advanced biomarkers in SRC6 concluded that there were needs for broader inclusion of female and nonfootball athletes, preinjury enrollment of athletes, and considering how prior head impact exposure may influence control group comparisons. In addition, there is currently a poor understanding of normative biomarker concentration variability. These research gaps formed the basis for developing aims for this 3-part Concussion Biomarkers Assessed in Collegiate Student-Athletes (BASICS) project:
Part I: Describe the normative characteristics of a panel of serum biomarkers in a cohort of collegiate male and female athletes.
Part II: Evaluate associations of baseline biomarker concentrations with prior exposure to SRC and/or repetitive subclinical impacts, as well as clinical test performance.
Part III: Examine diagnostic accuracy following SRC using different reference groups (e.g., within-patient, matched control, normative cutoffs).
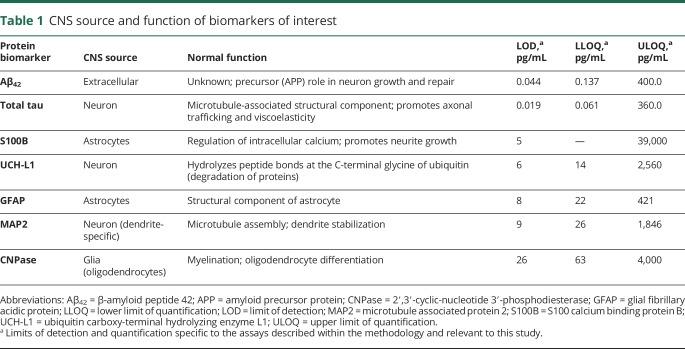
The broad physiologic effects of concussion suggest several candidate biomarkers that potentially reflect injury to the cell body, axon, dendrites, myelin, and/or astroglia, as well as markers of neuronal death and degeneration. We therefore chose to examine a panel of increasingly studied biomarkers that might capture the diverse effects of head trauma6 (table 1).
Table 1.
CNS source and function of biomarkers of interest
Available data show significant variability in both pre- and postinjury blood biomarker concentrations,8,9 highlighting the importance of either a within-patient baseline or carefully matched control group.10,11 However, it is largely unknown how demographic factors affect variance in biomarker expression in athletes because of a poor understanding of “normal” variation attributable to non–brain injury factors.6 An additional barrier to validating a biomarker for SRC management is the absence of test-retest reliability data from biomarkers obtained at 2 different time points, which is a necessity for establishing a test's clinical utility.12,13 Reliability data directly inform one's confidence level in the accuracy of a single cross-sectional measurement and interpretation of change over time. Part I of the Concussion BASICS project aimed to fill some of these basic research gaps.
Methods
Participants
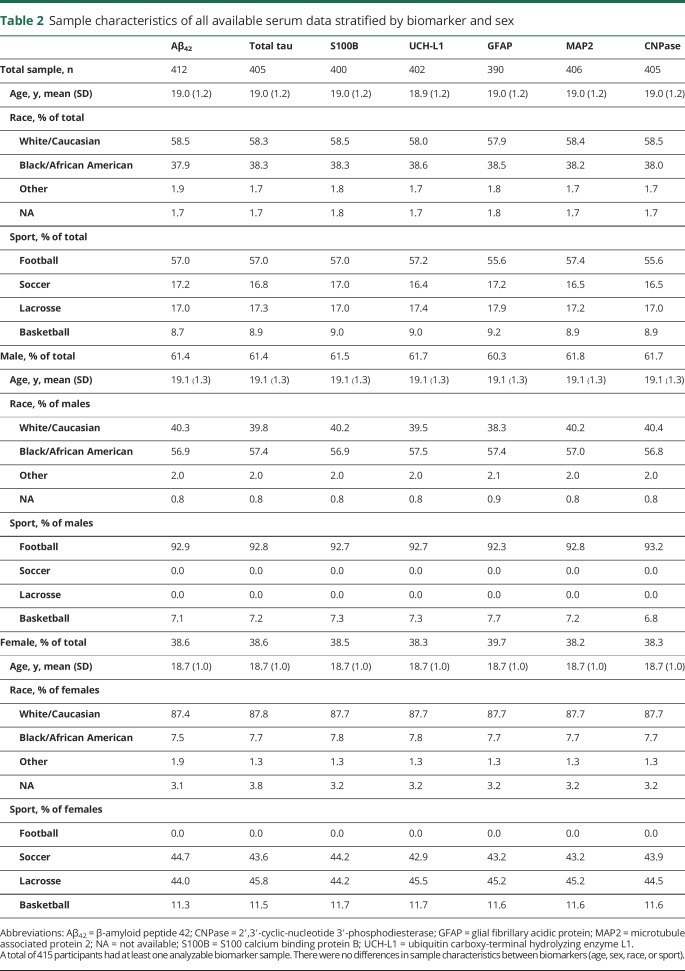
The 415 University of Florida varsity athletes (mean ± SD age = 19.0 ± 1.2 years) recruited as participants for this study included male (n = 256) and female (n = 159) athletes from American football (n = 238), men's basketball (n = 18), women's basketball (n = 18), women's lacrosse (n = 70), and women's soccer (n = 71). See table 2 for this study's sample demographic details. Specific sample characteristics are described in detail within the methods sections for each part of the Concussion BASICS series.
Table 2.
Sample characteristics of all available serum data stratified by biomarker and sex
Standard protocol approvals, registrations, and patient consents
A trained phlebotomist performed all blood draws following individual athlete consent according to a protocol approved by an independent ethical and biomedical research review board (Western IRB) with approved language by the university's institutional review board (IRB-01).
Serum collection and analysis
Blood samples were drawn via venipuncture, collected in Serum Separator Tubes (Quest Diagnostics, Secaucus, NJ), left to clot for 30 to 60 minutes, and centrifuged at 1,500 rpm for 15 minutes. The resulting serum was isolated, aliquoted, and stored at −80°C and then shipped on dry ice to a central repository for storage until the time of testing as per a predefined specimen handling procedure.
Serum samples were analyzed for ubiquitin carboxy-terminal hydrolyzing enzyme L1 (UCH-L1), glial fibrillary acidic protein (GFAP), and microtubule associated protein 2 (MAP2) concentration by the Banyan ELISA (Banyan Biomarkers, Inc., Alachua, FL). The assay was performed as follows: the test sample was added to wells of a 96-well microtiter plate that had been coated with a capture antibody specific to the antigen of interest (UCH-L1, GFAP, or MAP2). Following a set incubation period during which any antigen present in the sample binds to the capture antibody, unbound material was removed by washing with buffer. Horseradish peroxidase–conjugated detection antibody was then added to the well, binding to a second site on the antigen. Following a set incubation period, excess detection antibody was removed by washing with buffer. A chemiluminescent substrate was then added to the well. The horseradish peroxidase enzyme catalyzes a specific reaction with the chemiluminescent substrate, which produces light that was detected with a 96-well plate-based luminometer (Synergy 2—BioTek Instruments Inc., Winooski, VT; Lumatic—Monobind Inc., Lake Forest, CA). The amount of light generated is proportional to the amount of detection antibody and thus to the quantity of UCH-L1, GFAP, or MAP2 in the test sample. These signals were compared with light detected from wells containing known antigen concentrations, generating a standard calibration curve. Samples were tested in duplicate, and high and low positive controls were included with each plate. Analyses of 2′,3′-cyclic-nucleotide 3′-phosphodiesterase (CNPase) followed similar ELISA procedures using a colorimetric substrate and 3 antibodies (SpectraMax M2; Molecular Devices, LLC, Sunnyvale, CA).
S100 calcium binding protein B (S100B) concentrations were determined using an electrochemiluminescence immunoassay designed for in vitro diagnostic testing (Cobas 6000; Roche Diagnostics, Basel, Switzerland). β-Amyloid peptide 42 (Aβ42) and total tau were analyzed with an ultrasensitive immunoassay using digital array technology (Quanterix Corp., Lexington, MA) via the Simoa Tau and Simoa Aβ42 kits, described in detail elsewhere.14 Of note, total tau describes combined concentration of both normal and phosphorylated tau because the assay has an epitope in the midregion of the molecule, allowing recognition of all 6 tau isoforms.
Performance characteristics for S100B, UCH-L1, GFAP, MAP2, and CNPase assays were all determined to be well below acceptable coefficients of variation (CV) cutoffs (20%, 15%, 15%, 25%, and 25%, respectively). Performance characteristics for total tau and Aβ42 were similarly within acceptable limits (Aβ42 CV range 1%–10%, total tau CV range 1%–12%).
For all biomarkers, results were reported in picograms/milliliter (pg/mL). The upper limit of quantification (ULOQ), lower limit of quantification (LLOQ), and limit of detection (LOD) for each biomarker are presented in table 1. All lab technicians and study investigators were blinded to clinical and demographic information prior to linking data and performing analyses for the present study.
Timing of blood draw
Blood draws were performed between 2011 and 2017, outside of each athlete's respective competitive sports season to maximize the likelihood that protein expression represented a true baseline value. We determined the most recent exposure to head impacts for football and women's soccer players based on team schedules, typical date ranges for supervised athletic activity potentially posing a risk of head impacts, and, in the case of incoming freshmen football players, inspection of their respective high school football schedules indicating date of their last competition before enrollment in the study. Based on all available information, median time between last exposure to head impacts and blood draw was 80 days (interquartile range = 38–204 days; mean ± SD = 98.4 ± 69.8 days).
Handling of concentrations >ULOQ, <LLOQ, or <LOD at baseline
Concentration values for 3 of the 7 biomarkers of interest (GFAP, MAP2, CNPase) were frequently either below the LLOQ or the LOD (data available from Dryad, table, A, doi.org/10.5061/dryad.8302n83). Therefore, we knew the range within which a marker labeled LLOQ or LOD fell. For example, an individual with a GFAP concentration less than the LLOQ has a known concentration somewhere between 8 pg/mL (GFAP LOD cutoff) and 22 pg/mL (GFAP LLOQ cutoff). We elected to take advantage of knowing the individuals' limited range of possible values rather than exclude from analyses. In addition, we preferred not to simply replace all LLOQ or LOD values with the same specific cut score or midpoint of the ranges since this would reduce significantly the explainable variance in the sample. We instead performed a random replacement of values within the known range of possible concentrations ensuring a nonskewed distribution of values within a reasonable estimate of the individual's true value given the limited range of possible concentrations. Five (1.2%) of the baseline MAP2 samples were above the ULOQ. The ULOQ for MAP2 (1,846 pg/mL) was used for replacement in these samples.
Statistical analyses: Normative metrics
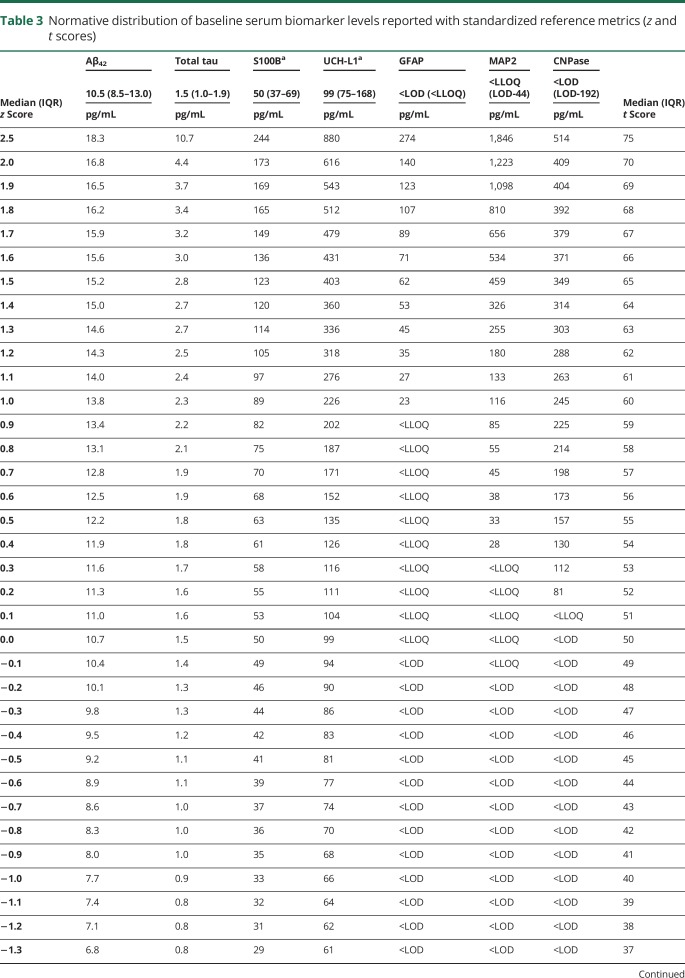
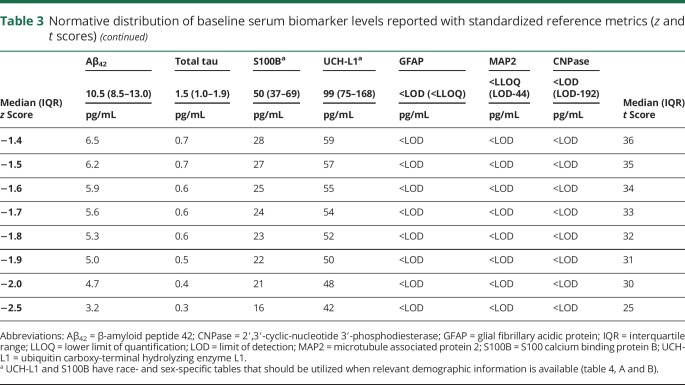
We provide descriptive statistics of biomarker concentrations and their corresponding z and t scores. Random replacement values for <LLOQ and <LOD concentrations were retained when determining the descriptive statistics of the distribution, but these values were described simply as <LLOQ or <LOD within normative tables for ease of interpretation and clinical translatability.
All biomarkers with the exception of Aβ42 were significantly skewed at baseline (z[skew] >1.96 for 6 of 7 markers). Therefore, we applied a Blom transformation to these baseline distributions prior to determining the standardized normative metrics. This was necessary because the SD of values derived from a significantly skewed distribution will not accurately represent variability throughout the entire distribution. For example, in a normally distributed dataset, one expects that values with a corresponding z score greater than 2.5 are less probable events, occurring in approximately 1% of participants. However, applying a z transformation to values within a significantly skewed, nonnormal distribution will result in greater than 1% of participants with z scores above 2.5. The biomarker concentrations reported within the normative tables reflect the original data that correspond to the z/t score determined from the Blom normalized distribution.
We evaluated the main effects of sex and race using analyses of variance, and correlations among biomarkers using Spearman correlations. Homogeneity of variance was assessed with the Levene test and, if significant, main effects were assessed using the Brown-Forsythe robust test of equality of means. We did not consider age as a separate factor given the restriction of our sample to college student athletes all between the ages of 18 and 23 years. Race analyses only included participants classified as white (n = 244) or black (n = 156) because of limited representation of other races (n = 7, missing data n = 8). We adjusted for multiple comparisons using a Bonferroni correction reflecting the 7 dependent biomarker outcomes, resulting in an α criterion of p < 0.007 to control for type 1 error inflation (0.05/7 = 0.007).
We explored interactions between sex and race within the analysis of variance model on a biomarker-specific basis if both demonstrated a main effect. Demographic-specific normative tables are provided for biomarkers demonstrating group differences with evidence of at least a medium effect size (determined using Cohen d ≥0.5 criterion). If both sex and race demonstrated a medium effect size or greater for a specific biomarker, but there was no significant interaction, the demographic-specific normative table would reflect only the factor that had the greatest effect size of the group difference in biomarker concentration.
Statistical analyses: Reliability metrics
Test-retest reliability analyses were performed in a convenience subsample of 31 female athletes participating in either women's soccer (n = 18) or women's lacrosse (n = 13). These athletes voluntarily provided 2 separate blood samples via venipuncture. Blood draws occurred approximately 6 months apart at a minimum for both sports (median interval 196 days, range 165–343 days). For women's lacrosse players, the first blood draw occurred before the start of their unofficial fall season (October 2011) and the second draw occurred around 3 months after the conclusion of the following official spring season (August 2012). For women's soccer players, the first blood draw occurred before the start of an unofficial winter/spring season (January 2012) and the second draw occurred approximately 3 months after the conclusion of the winter/spring season (July–August 2012). No female athletes included in the reliability analyses had a diagnosed SRC between blood draws.
We report the coefficient of stability using Pearson r and report cutoffs for statistically significant reliable change based on the 80%, 90%, and 95% confidence intervals of the standardized difference score between assessment points, according to procedures described elsewhere.12,13 Analyses were limited to biomarkers for which quantifiable and detectable concentrations were available for all participants (Aβ42, total tau, S100B, and UCH-L1). The majority of GFAP, MAP2, and CNPase samples were either <LLOQ or <LOD; therefore, stability of these markers is described qualitatively.
Data availability
Any qualified investigator may contact the corresponding (B.A.) or senior (J.C.) author with a specific request that includes details of (1) the resources requested, (2) how the data and resources will be used in the proposed research, and (3) the qualifications of the investigator requesting the resources. Investigators may be asked to provide further details if necessary. All requests will be reviewed for availability of the requested resources, potential for duplication of ongoing studies, and scientific merit. The requesting investigator may be asked to partner with a University of Florida investigator to better understand the available data and will sometimes be encouraged to include a Florida representative as an academic consultant or collaborator. Requesting investigators will also be required to sign a Data Use Agreement ensuring data will not be shared with third parties.
Results
Normative metrics
There was slight variability in the sample size for each baseline biomarker because of a handful of samples with insufficient specimen quantity, but no significant differences in age, sex, race, or sport of the participants between biomarkers (table 2). The normative distributions of baseline serum biomarker concentrations for the 7 biomarkers of interest are provided (table 3). Correlational analyses revealed weak associations between UCH-L1 and S100B (ρ = 0.282, p < 0.001), UCH-L1 and GFAP (ρ = 0.240, p < 0.001), and between GFAP and MAP2 (ρ = 0.185, p < 0.001).
Table 3.
Normative distribution of baseline serum biomarker levels reported with standardized reference metrics (z and t scores)
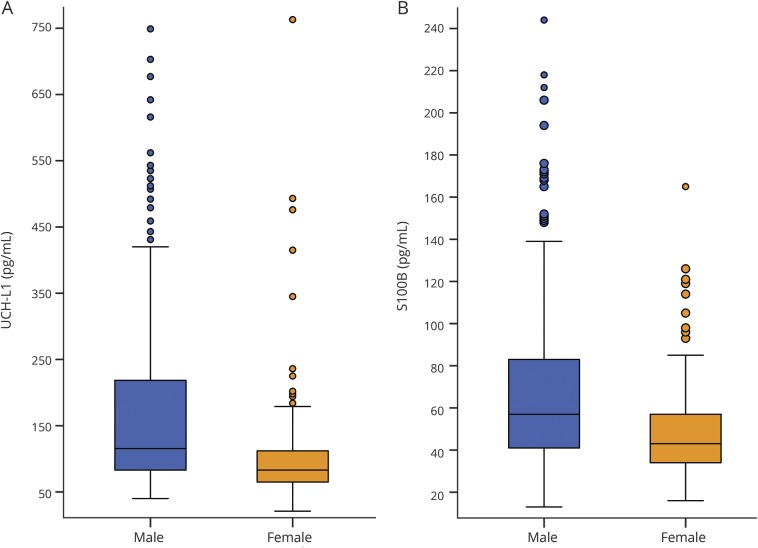
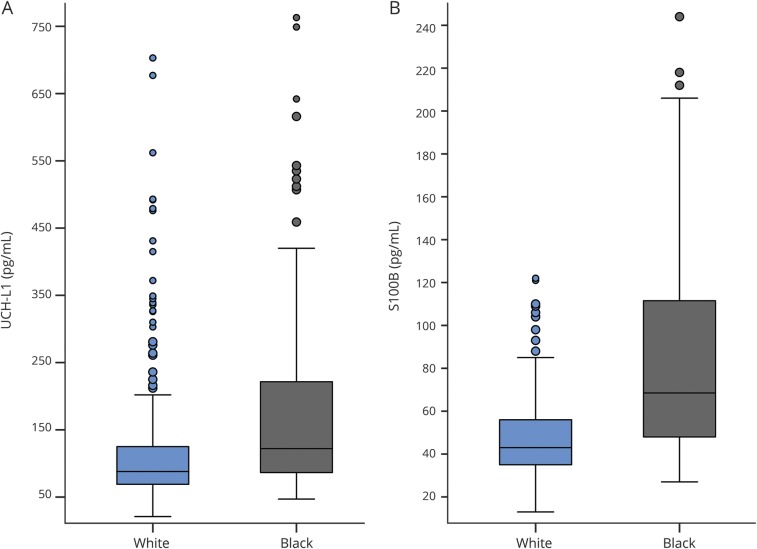
Males exhibited higher baseline concentrations of UCH-L1 (F1,347.4 = 54.926, p < 0.001, d = 0.75) and S100B (F1,371.0 = 31.030, p < 0.001, d = 0.56), and females exhibited higher CNPase levels (F1,403 = 16.250, p < 0.001, d = 0.43). See figure 1 for depiction of sex-related differences with at least medium effect size. Several main effects of race were also found. Black participants had higher baseline levels of UCH-L1 (F1,386 = 34.242, p < 0.001, d = 0.61) and S100B (F1,384 = 104.910, p < 0.001, d = 1.1) than white participants. Conversely, white participants had higher baseline levels of Aβ42 (F1,362.4 = 7.909, p = 0.005, d = 0.28) and CNPase (F1,389 = 18.991, p < 0.001, d = 0.46). See figure 2 for depiction of race-related differences with at least medium effect size. There were no interaction effects of sex and race on UCH-L1, S100B, or CNPase. We observed no effect of race or sex on baseline total tau concentration.
Figure 1. Sex-related differences in baseline serum expression of UCH-L1 (A) and S100B (B).
Both differences were statistically significant (p < 0.001) with at least a medium effect size (d = 0.75 for UCH-L1, d = 0.56 for S100B). For the UCH-L1 (A), 5 data points >750 pg/mL (1.2% of sample) were not included in order to minimize y-axis distortion (4 male, 1 female). For the S100B (B), 2 data points >250 pg/mL (0.5% of sample) were not included (2 male). S100B = S100 calcium binding protein B; UCH-L1 = ubiquitin carboxy-terminal hydrolyzing enzyme L1.
Figure 2. Race-related differences in baseline serum expression of UCH-L1 (A) and S100B (B).
Both differences were statistically significant (p < 0.001) with a medium to large effect size (d = 0.61 for UCH-L1, d = 1.1 for S100B). For the UCH-L1 (A), 5 data points >750 pg/mL (1.2% of sample) were not included in order to minimize y-axis distortion (4 black, 1 white). For the S100B (B), 2 data points >250 pg/mL (0.5% of sample) were not included (2 black). S100B = S100 calcium binding protein B; UCH-L1 = ubiquitin carboxy-terminal hydrolyzing enzyme L1.
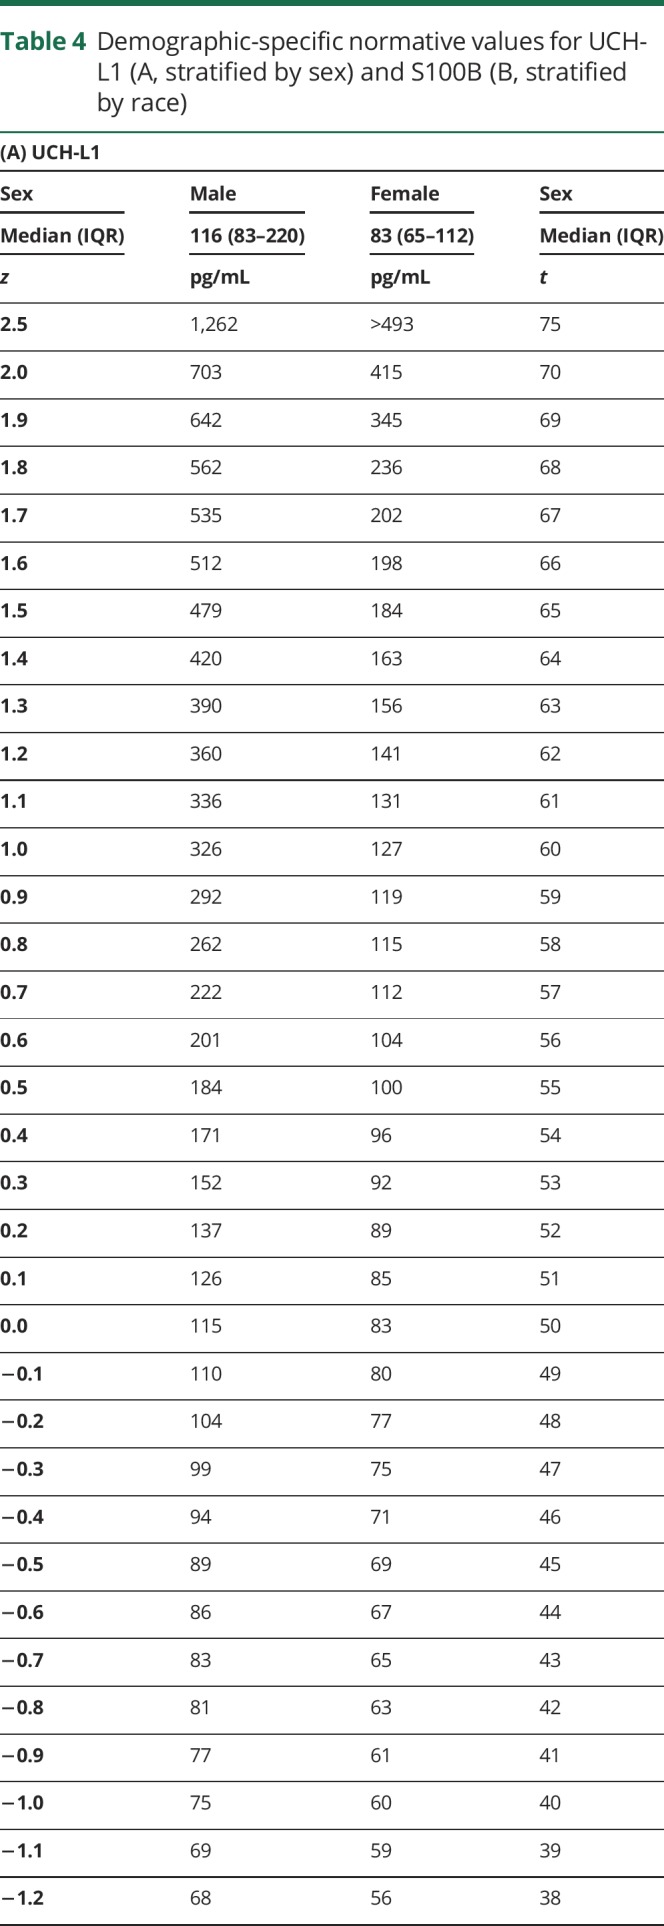
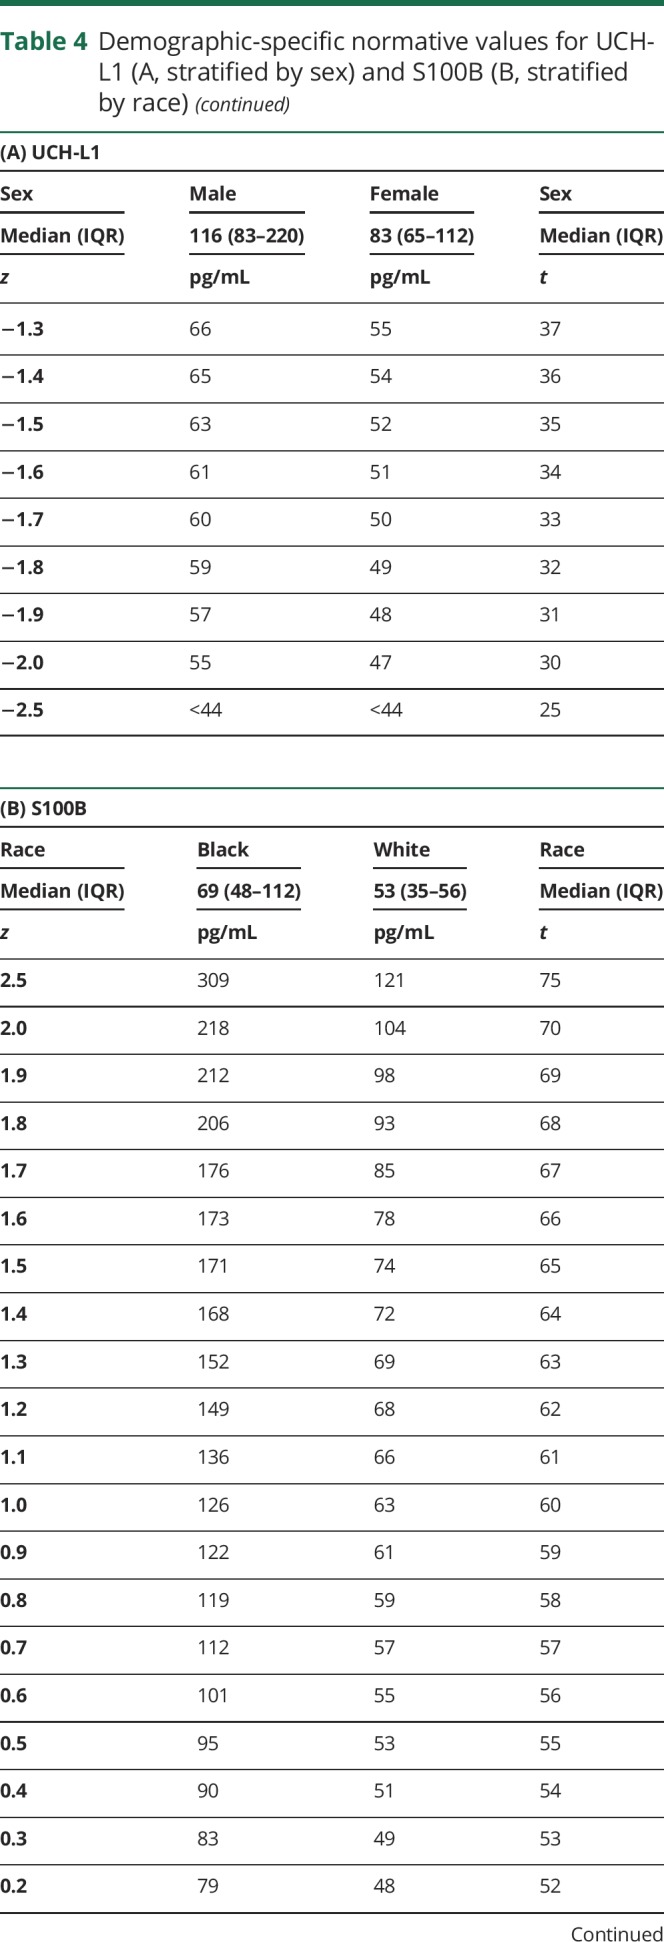
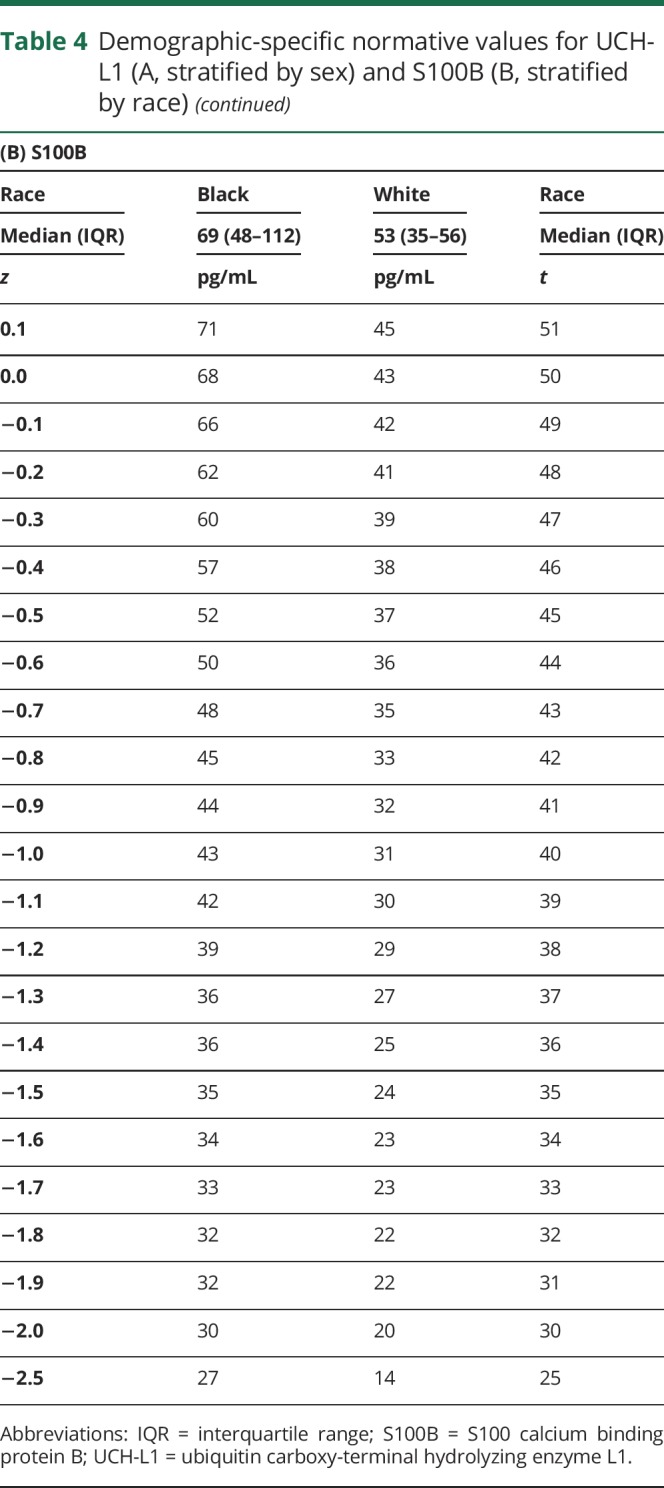
Both race and sex influenced baseline S100B and UCH-L1 levels, with at least a medium effect size. A stronger effect of sex was noted for UCH-L1, so normative data for UCH-L1 stratified by sex are provided (table 4, A). A stronger effect of race was noted for S100B, so normative data for S100B stratified by race are provided (table 4, B).
Table 4.
Demographic-specific normative values for UCH-L1 (A, stratified by sex) and S100B (B, stratified by race)
Reliability metrics
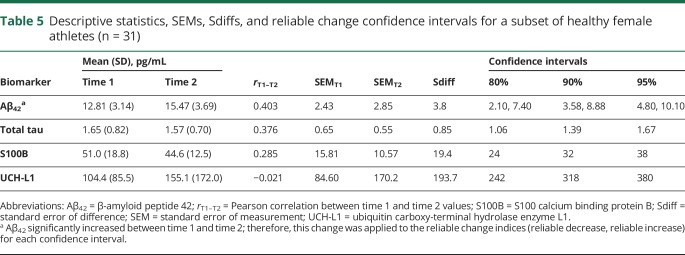
The 80%, 90%, and 95% reliable change metrics for Aβ42, total tau, S100B, and UCH-L1 derived from a subset of 31 female athletes are provided (table 5). None of these 4 biomarkers demonstrated test-retest coefficients near or above the 0.7 cutoff for acceptable reliability. One biomarker, Aβ42, increased from time 1 to time 2 (p < 0.001, mean increase = 2.65 pg/mL). This was factored into the reliable change indices (RCIs) for Aβ42 using methods for managing score variation with repeated clinical test administrations, such that a greater increase is necessary to be considered a statistically reliable increase.15,16 Two values are provided in table 5 for the 80%, 90%, and 95% RCIs for Aβ42 reflecting the amount of change necessary for a reliable decrease and increase, respectively. Frequency data for healthy female participants exhibiting statistically reliable change from time 1 to time 2 using the established RCIs are shown in data available from Dryad (table, B, doi.org/10.5061/dryad.8302n83). Overall, 51.6%, 32.3%, and 22.6% of the reliability sample exhibited either a significant increase or decrease in at least 1 of the 4 biomarkers based on the 80%, 90%, and 95% reliable change cutoffs, respectively. Participants appeared equally likely to demonstrate an increase as a decrease in serum biomarker concentration.
Table 5.
Descriptive statistics, SEMs, Sdiffs, and reliable change confidence intervals for a subset of healthy female athletes (n = 31)
We qualitatively analyzed the test-retest data for GFAP, MAP2, and CNPase because of the high rate of <LLOQ and <LOD values. For GFAP, 23 of 27 participants had levels <LLOQ or <LOD at time 1, and all 23 remained below the quantification threshold at time 2. All 4 participants with quantifiable samples at time 1 showed a minimal decrease in GFAP concentration at time 2 approximately equivalent to ≤0.1 SDs according to the normative distribution (table 3). For MAP2, 21 of 26 participants had concentrations <LLOQ or <LOD at time 1, 19 of whom remained below the quantification threshold at time 2. Among the other 7 participants, 4 showed a decrease between time 1 and time 2 (ranging from approximately 0.2 to 1.5 SDs) and 3 showed an increase (ranging from approximately 0.1 to 0.9 SDs). Lastly, for CNPase, 5 of 30 participants were <LLOQ or <LOD at time 1, one of whom remained below quantification threshold at time 2. The other 4 all rose to quantifiable levels (increases ranging from 0.4 to >2.5 SDs). Eleven of the 25 participants with quantifiable levels at time 1 decreased at time 2 (ranging from 0.1 to 2.0 SDs), 14 increased at time 2 (ranging from 0.3 to >1.5 SDs), and 1 remained the same at both time points.
Discussion
This study provided an important contribution to the blood biomarker literature in systematically describing variability in “normal” peripheral expression of concussion-related biomarkers in human serum. In addition, we reported test-retest reliability data from a subsample of females suggesting that support for a clinical decision of “elevated” or “decreased” with reasonable statistical certainty would require a substantial change from prior levels. Reliable change is uncommonly calculated or reported in biomarker research despite its critical importance for clinical interpretation.
Normal peripheral expression of frequently studied biomarkers may be elicited from studies using control group or baseline comparisons despite not directly describing normative values and typically involving much smaller samples. One study of comparably aged student athletes reported median serum S100B concentrations between 42 and 61 pg/mL,17 similar to findings for our overall sample (median = 50.0 pg/mL). Other findings support serum S100B concentrations in this range as “average” for healthy samples8,9,15,16,18 in approximately the same age groups. Regarding UCH-L1, our sample's median (99 pg/mL) was on par with another study of student athletes (median ≈100 pg/mL)17 but lower than healthy samples described by others with median and mean concentrations ranging from 120 to 230 pg/mL.15,19 One possible explanation for the discrepancy is that our sample included a large number of females, and our results indicated that females had significantly lower UCH-L1 levels. Our data support the conclusion that GFAP is rarely quantifiable in uninjured college-aged athletes.17 We could not locate relevant studies with comparable samples reporting serum levels of Aβ42, total tau, MAP2, or CNPase in healthy participants for comparison.
Our finding of strong variability in S100B and UCH-L1 concentrations attributable to race and sex suggests that considering these factors is essential for research and interpretation of these biomarkers. We identified few studies that specifically reported race or sex differences in serum biomarker concentrations. Sex differences in S100B levels from plasma or CSF have demonstrated inconsistent findings.20,21 Regarding race, one small, likely underpowered, study reported no differences (p = 0.06), but inspection of the data shows a clear discrepancy in median levels as well as overall variability, with the black participants demonstrating higher S100B values.22 Other work has described race differences in S100B among black, Asian, and Caucasian participants (aged mid-40s), noting higher serum concentrations in black and Asian participants.23
The neurobiological basis for the observed differences in baseline serum biomarker levels between black and white participants is not known. There is one proposed hypothesis relating to dermatologic differences in melanocyte concentration and associated variability in metabolic activity.23 Another argument may be that our sample had a large number of football athletes exposed to repetitive head trauma, and this group is disproportionately black. However, data from this sample suggest that neither exposure to repetitive subclinical trauma nor concussion history affects baseline serum biomarker levels in collegiate student athletes.24
The US Food and Drug Administration recently approved the nation's first blood biomarker test for ruling out the need for a CT scan in emergency departments after a suspected brain injury, using UCH-L1 and GFAP.25 A blood sample collected within 12 hours of injury that is below the cutoff for both UCH-L1 (<327 pg/mL) and GFAP (<22 pg/mL) is associated with the absence of intracranial injuries detected with CT (i.e., a negative sample). If either biomarker is above their respective cutoffs, this is considered a positive test and a CT may be considered. Referencing our normative distributions, the cutoff for GFAP corresponds to its lower limit of quantification and is approximately 1 SD above the sample mean, suggesting approximately 16% of individuals may have a false-positive test. The UCH-L1 cutoff corresponds to 1.2–1.3 SDs above our overall sample mean, suggesting approximately 10% of individuals may have a false-positive test. Requiring that both GFAP and UCH-L1 be below their respective cutoffs significantly heightens confidence that the result is not a false negative while acknowledging the potential for false positives. This seems appropriate given the clinical context and the preferred balance of sensitivity and specificity in this setting.
The Food and Drug Administration–approved cutoffs are meant to be used in conjunction with clinical information in emergency room settings for all adult patients (aged 18 years and older) with suspected head injury, regardless of sex or race. Our data show that the balance of sensitivity and specificity achieved by the UCH-L1 cutoff (327 pg/mL) likely differs for males (∼1.0 SD above male mean) and females (∼1.8–1.9 SD above female mean). Specifically, there may be more false positives for males than females, while the risk of false negatives is higher in females (though, a “negative” test would also be required for GFAP). Refinement of these standards based on the patient’s sex and/or race could further improve the clinical utility of these biomarkers in emergency department settings.
International mild traumatic brain injury management guidelines offer support for race-based normative values when integrated with our findings, particularly for S100B. A recent Scandinavian consensus report stated that patients with a Glasgow Coma Scale score >13 and S100B levels <100 pg/mL (in the absence of additional risk factors for brain bleeds) may be discharged without a CT.26 Referencing our race-specific (white) normative table for S100B (given the predominantly white population in the Scandinavia region), 100 pg/mL corresponds to approximately 2.0 SDs above the mean. A German study also endorsed the 100 pg/mL cutoff for S100B based on multicenter data reporting 99% sensitivity to intracerebral lesions detectable on CT after mild traumatic brain injury, and an associated 30% potential reduction in unnecessary CT scans.27 However, this value is only approximately 0.5 SDs above the normative mean for black individuals. Applying this criterion to both white and black patients would conceivably result in many unnecessary CT scans. Additional support for race-specific reference values can be gathered from data showing that 122 pg/mL was 97% specific to concussion in an athlete sample that was 96% white.8 This cutoff corresponds to 2.5 SDs above the mean in our white sample, but just 0.9 SDs above the black participants' mean, suggesting likely reduced specificity for this population.
Replication of our findings is essential given the novelty of this research area. Future efforts should also examine the relationship between sleeping patterns and peripheral biomarker expression as growing evidence indicates that the sleep state promotes efficient metabolite clearance, suggesting sleep variability may influence blood biomarker variability. In this regard, studying biomarker ratios between serum and CSF could also inform the role of sleep and glymphatic system clearance on biomarker expression in both healthy and concussed individuals.28
An important finding related to our reliability analyses pertains to the use of biomarker panels. Calculating RCIs is standard practice for establishing when meaningful change has occurred across measurement times, but such indices are typically derived from and then applied to a single test. Our data show that using a panel of tests increases the likelihood that at least one biomarker within the panel will exhibit either a reliable increase or decrease simply by chance. Performing multiple tests amplifies false-positive rates—a phenomenon well established in the analogous practice of administering a battery of cognitive test measures.29,30 This has important research and clinical implications when interpreting change from a previous time point. However, individuals exhibiting reliable change in 2 or more serum biomarkers (of the 4 analyzed) occurred relatively infrequently, suggesting that utilizing a biomarker panel may improve clinical applicability in cases in which reliable change is noted in multiple biomarkers. However, this may be financially and logistically challenging for many institutions and organizations.
The present findings may not apply to student athletes at the youth or professional level as detailed understanding of serum biomarker expression throughout the lifespan is unknown. The normative standards should only be applied to individuals undergoing serum analyses similar to those described in the present study's methodology; however, the demographic-specific considerations may universally apply.
There are potentially several factors that could influence the concentration of biomarkers collected outside the CNS. S100B could be elevated by the effects of acute exertion, stress, or orthopedic injury.31–33 Attempts were made to collect blood samples when participants were sufficiently rested, but strict control over this was not always feasible, and we did not have the ability to account for concurrent or recent orthopedic injury. Another unexplored potential modifier of peripheral blood biomarker expression is the time of day the sample was collected. It may be possible that serum biomarker concentrations fluctuate to some degree in concordance with circadian rhythms and metabolic activity.
The RCIs were derived from a small, female-only subset of our sample with 2 healthy blood draws during a period of relative rest from athletic participation. These RCIs may therefore not apply to male populations. The time between blood draws was somewhat variable, ranging from approximately 6 months to 1 year. A more standardized test-retest interval will improve interpretability and generalizability of results. We had limited control over our ability to assess for events or exposures occurring between the 2 blood draw time points. Unknown influences may contribute to the poor reliability and significant intraindividual variability; however, our methods represent a clinically relevant situation. Baseline blood draws are typically collected only once, if at all, often followed by an extended window of time before suspected concussion.
Of note, RCI calculations are based on an assumption of underlying normality, and the distribution of concentration values was nonnormal for all biomarkers except Aβ42 in our sample. Therefore, the reported RCIs are suggestive of appropriate cutoffs for determining reliable deviations, but a larger reliability sample is necessary to help counteract the effects of a nonnormal underlying distribution.
Healthy collegiate athletes express concussion-related serum biomarkers in variable concentrations. Controlling for demographic factors such as sex and race may help reduce their potential confounding effects, particularly for S100B and UCH-L1. Evidence suggested poor reliability for serum biomarkers; however, understanding how certain factors influence biomarker expression, as well as knowledge of reliable change metrics, may improve clinical interpretation and future study designs.
Acknowledgment
The authors thank Dewayne DuBose, PhD, ATC (Bethune-Cookman University, Department of Rehabilitation Sciences), and Jonathan Boone, MS, ATC (University of Florida Athletic Association), for their efforts in consenting participants and obtaining blood samples for this study. The authors also thank Thomas Glenn, PhD (Associate Professor, Department of Neurosurgery, Co-Director Cerebral Blood Flow Laboratory, University of California Los Angeles) for his technical review of the manuscript. The University of Florida has financial stake in Banyan Biomarkers, Inc. (see disclosures); an independent review of the manuscript was performed in accordance with predetermined requirements. The authors further thank Dr. Glenn for performing this review and for his determination that the manuscript is free of biased presentation.
Glossary
- Aβ42
β-amyloid peptide 42
- BASICS
Biomarkers Assessed in Collegiate Student-Athletes
- CNPase
2′,3′-cyclic-nucleotide 3′-phosphodiesterase
- CV
coefficient of variation
- GFAP
glial fibrillary acidic protein
- LLOQ
lower limit of quantification
- LOD
limit of detection
- MAP2
microtubule associated protein 2
- RCI
reliable change index
- S100B
S100 calcium binding protein B
- SRC
sport-related concussion
- UCH-L1
ubiquitin carboxy-terminal hydrolyzing enzyme L1
- ULOQ
upper limit of quantification
Footnotes
Author contributions
Drafting/revising the manuscript for content, including medical writing for content: B.M.A., R.M.B., S.T.D., M.S.J., Z.M.H., C.C.M., A.G.W., J.R.C. Study concept or design: B.M.A., R.M.B., S.T.D., M.S.J., A.G.W., J.R.C. Analysis or interpretation of data: B.M.A., R.M.B., J.R.C. Acquisition of data: A.G.W., J.R.C. Statistical analysis: B.M.A. Study supervision or coordination: B.M.A., J.R.C. Obtaining funding: J.R.C. Other: Banyan Biomarkers, Inc. is responsible for conducting the biomarker analyses and providing B.M.A. and J.R.C. with these data. B.M.A. and J.R.C. had full access to all data throughout the study. Final approval of submitted manuscript: B.M.A., R.M.B., S.T.D., M.S.J., Z.M.H., C.C.M., A.G.W., J.R.C.
Study funding
This work was primarily supported by funds provided in a grant from the Head Health Initiative, a collaboration between GE and the NFL, Banyan Biomarkers, Inc., and the U.S. Army Medical Research and Material Command (USAMRMC) under contract W81XWH-06-1-0517. The University of Florida owns stock in Banyan Biomarkers, Inc., which is the sponsor of the study. In addition, the university has licensed technology to Banyan concerning blood biomarkers or proteins thereby allowing Banyan to use the technology. The company is interested in making a biomarker test for traumatic brain injury. If the biomarker test is sold commercially, then the University of Florida could benefit financially. Please feel free to ask any further questions you might have about this matter.
Disclosure
B. Asken received partial support (hourly) from Banyan Biomarkers, Inc., for data collection and analysis. R. Bauer reports no disclosures relevant to the manuscript. S. DeKosky is supported by the 1Florida ADRC and AG047266. S.T.D. also reports serving on advisory boards for Amgen, Cognition Therapeutics, and Acumen, and chairs a drug monitoring committee for Biogen. Z. Houck and C. Moreno report no disclosures relevant to the manuscript. M. Jaffee is supported by McKnight Brain Institute and Florida Department of Elderly Affairs. A. Weber holds stock in and is an employee of Banyan Biomarkers, Inc. J. Clugston is supported by Banyan Biomarkers, Inc., Florida High Tech Corridor Matching Funds Program, and NCAA-DoD CARE Consortium (award W81XWH-14-2-0151). Go to Neurology.org/N for full disclosures.
Publication history
Received by Neurology December 1, 2017. Accepted in final form August 9, 2018.
References
- 1.Langlois JA, Rutland-Brown W, Wald MM. The epidemiology and impact of traumatic brain injury: a brief overview. J Head Trauma Rehabil 2006;21:375–378. [DOI] [PubMed] [Google Scholar]
- 2.McCrea M, Hammeke T, Olsen G, Leo P, Guskiewicz K. Unreported concussion in high school football players: implications for prevention. Clin J Sports Med 2004;14:13–17. [DOI] [PubMed] [Google Scholar]
- 3.McCrory P, Meeuwisse W, Dvorak J, et al. Consensus statement on concussion in sport—the 5th international conference on concussion in sport held in Berlin, October 2016. Br J Sports Med 2017;51:838–847. [DOI] [PubMed] [Google Scholar]
- 4.McCrea M, Broshek DK, Barth JT. Sports concussion assessment and management: future research directions. Brain Inj 2015;29:276–282. [DOI] [PubMed] [Google Scholar]
- 5.Kamins J, Bigler E, Covassin T, et al. What is the physiological time to recovery after concussion? A systematic review. Br J Sports Med 2017;51:935–940. [DOI] [PubMed] [Google Scholar]
- 6.McCrea M, Meier T, Huber D, et al. Role of advanced neuroimaging, fluid biomarkers and genetic testing in the assessment of sport-related concussion: a systematic review. Br J Sports Med 2017;51:919–929. [DOI] [PubMed] [Google Scholar]
- 7.Papa L, Ramia MM, Edwards D, Johnson BD, Slobounov SM. Systematic review of clinical studies examining biomarkers of brain injury in athletes after sports-related concussion. J Neurotrauma 2015;32:661–673. [DOI] [PMC free article] [PubMed] [Google Scholar]
- 8.Kiechle K, Bazarian JJ, Merchant-Borna K, et al. Subject-specific increases in serum S-100B distinguish sports-related concussion from sports-related exertion. PLoS One 2014;9:e84977. [DOI] [PMC free article] [PubMed] [Google Scholar]
- 9.Shahim P, Tegner Y, Wilson DH, et al. Blood biomarkers for brain injury in concussed professional ice hockey players. JAMA Neurol 2014;71:684–692. [DOI] [PubMed] [Google Scholar]
- 10.Hutchison MG, Mainwaring L, Senthinathan A, Churchill N, Thomas S, Richards D. Psychological and physiological markers of stress in concussed athletes across recovery milestones. J Head Trauma Rehabil 2017;32:E38–E48. [DOI] [PubMed] [Google Scholar]
- 11.Meier TB, Bergamino M, Bellgowan PS, et al. Longitudinal assessment of white matter abnormalities following sports-related concussion. Hum Brain Mapp 2016;37:833–845. [DOI] [PMC free article] [PubMed] [Google Scholar]
- 12.Jacobson NS, Truax P. Clinical significance: a statistical approach to defining meaningful change in psychotherapy research. J Consult Clin Psychol 1991;59:12–19. [DOI] [PubMed] [Google Scholar]
- 13.Chelune GJ, Naugle RI, Lüders H, Sedlak J, Awad IA. Individual change after epilepsy surgery: practice effects and base-rate information. Neuropsychology 1993;7:41–52. [Google Scholar]
- 14.Rissin DM, Kan CW, Campbell TG, et al. Single-molecule enzyme-linked immunosorbent assay detects serum proteins at subfemtomolar concentrations. Nat Biotechnol 2010;28:595–599. [DOI] [PMC free article] [PubMed] [Google Scholar]
- 15.Puvenna V, Brennan C, Shaw G, et al. Significance of ubiquitin carboxy-terminal hydrolase L1 elevations in athletes after sub-concussive head hits. PLoS One 2014;9:e96296. [DOI] [PMC free article] [PubMed] [Google Scholar]
- 16.Neselius S, Zetterberg H, Blennow K, et al. Olympic boxing is associated with elevated levels of the neuronal protein tau in plasma. Brain Inj 2013;27:425–433. [DOI] [PubMed] [Google Scholar]
- 17.Meier T, Nelson LD, Huber DL, Bazarian J, Hayes RL, McCrea M. Prospective assessment of acute blood markers of brain injury in sport-related concussion. J Neurotrauma 2017;34:3134–3142. [DOI] [PMC free article] [PubMed] [Google Scholar]
- 18.Jeter CB, Hergenroeder GW, Hylin MJ, Redell JB, Moore AN, Dash PK. Biomarkers for the diagnosis and prognosis of mild traumatic brain injury/concussion. J Neurotrauma 2013;30:657–670. [DOI] [PubMed] [Google Scholar]
- 19.Mondello S, Linnet A, Buki A, et al. Clinical utility of serum levels of ubiquitin C-terminal hydrolase as a biomarker for severe traumatic brain injury. Neurosurgery 2012;70:666–675. [DOI] [PMC free article] [PubMed] [Google Scholar]
- 20.Nygaard O, Langbakk B, Romner B. Age-and sex-related changes of S-100 protein concentrations in cerebrospinal fluid and serum in patients with no previous history of neurological disorder. Clin Chem 1997;43:541–543. [PubMed] [Google Scholar]
- 21.Wiesmann M, Missler U, Gottmann D, Gehring S. Plasma S-100b protein concentration in healthy adults is age- and sex-independent. Clin Chem 1998;44:1056–1058. [PubMed] [Google Scholar]
- 22.Marchi N, Bazarian JJ, Puvenna V, et al. Consequences of repeated blood-brain barrier disruption in football players. PLoS One 2013;8:e56805. [DOI] [PMC free article] [PubMed] [Google Scholar]
- 23.Abdesselam OB, Vally J, Adem C, Foglietti MJ, Beaudeux JL. Reference values for serum S-100B protein depend on the race of individuals. Clin Chem 2003;49:836–837. [DOI] [PubMed] [Google Scholar]
- 24.Asken BM, Bauer RM, DeKosky ST. Concussion BASICS II: Baseline serum biomarkers, head impact exposure, and clinical measures. Neurology 2018;91:e2123–e2132. [DOI] [PMC free article] [PubMed] [Google Scholar]
- 25.FDA authorizes marketing of first blood test to aid in the evaluation of concussion in adults [online]. Available at: fda.gov/NewsEvents/Newsroom/PressAnnouncements/ucm596531.htm. Accessed May 8, 2018.
- 26.Undén J, Ingebrigtsen T, Romner B. Scandinavian guidelines for initial management of minimal, mild and moderate head injuries in adults: an evidence and consensus-based update. BMC Med 2013;11:50. [DOI] [PMC free article] [PubMed] [Google Scholar]
- 27.Biberthaler P, Linsenmeier U, Pfeifer KJ, et al. Serum S-100B concentration provides additional information for the indication of computed tomography in patients after minor head injury: a prospective multicenter study. Shock 2006;25:446–453. [DOI] [PubMed] [Google Scholar]
- 28.Jessen NA, Munk ASF, Lundgaard I, Nedergaard M. The glymphatic system: a beginner’s guide. Neurochem Res 2015;40:2583–2599. [DOI] [PMC free article] [PubMed] [Google Scholar]
- 29.Brooks BL, Holdnack JA, Iverson GL. Reliable change on memory tests is common in healthy children and adolescents. Arch Clin Neuropsychol 2017;32:1001–1009. [DOI] [PMC free article] [PubMed] [Google Scholar]
- 30.Brooks BL, Holdnack JA, Iverson GL. To change is human: “abnormal” reliable change memory scores are common in healthy adults and older adults. Arch Clin Neuropsychol 2016;31:1026–1036. [DOI] [PMC free article] [PubMed] [Google Scholar]
- 31.Otto M, Holthusen S, Bahn E, et al. Boxing and running lead to a rise in serum levels of S-100B protein. Int J Sports Med 2000;21:551–555. [DOI] [PubMed] [Google Scholar]
- 32.Hasselblatt M, Mooren F, Von Ahsen N, et al. Serum S100β increases in marathon runners reflect extracranial release rather than glial damage. Neurology 2004;62:1634–1636. [DOI] [PubMed] [Google Scholar]
- 33.Scaccianoce S, Del Bianco P, Pannitteri G, Passarelli F. Relationship between stress and circulating levels of S100B protein. Brain Res 2004;1004:208–211. [DOI] [PubMed] [Google Scholar]
Associated Data
This section collects any data citations, data availability statements, or supplementary materials included in this article.
Data Availability Statement
Any qualified investigator may contact the corresponding (B.A.) or senior (J.C.) author with a specific request that includes details of (1) the resources requested, (2) how the data and resources will be used in the proposed research, and (3) the qualifications of the investigator requesting the resources. Investigators may be asked to provide further details if necessary. All requests will be reviewed for availability of the requested resources, potential for duplication of ongoing studies, and scientific merit. The requesting investigator may be asked to partner with a University of Florida investigator to better understand the available data and will sometimes be encouraged to include a Florida representative as an academic consultant or collaborator. Requesting investigators will also be required to sign a Data Use Agreement ensuring data will not be shared with third parties.


