Abstract
This work reports on fully integrated “sample‐in‐signal‐out” microfluidic paper‐based analytical devices (μPADs) relying on bioluminescence resonance energy transfer (BRET) switches for analyte recognition and colorimetric signal generation. The devices use BRET‐based antibody sensing proteins integrated into vertically assembled layers of functionalized paper, and their design enables sample volume‐independent and fully reagent‐free operation, including on‐device blood plasma separation. User operation is limited to the application of a single drop (20–30 μL) of sample (serum, whole blood) and the acquisition of a photograph 20 min after sample introduction, with no requirement for precise pipetting, liquid handling, or analytical equipment except for a camera. Simultaneous detection of three different antibodies (anti‐HIV1, anti‐HA, and anti‐DEN1) in whole blood was achieved. Given its simplicity, this type of device is ideally suited for user‐friendly point‐of‐care testing in low‐resource environments.
Keywords: antibodies, bioluminescence, paper-based analytical devices, point-of-care testing, whole-blood analysis
Microfluidic paper‐based analytical devices (μPADs), first introduced by Whitesides et al.,1 represent a class of microfluidic devices characterized by low material costs, capillary force‐driven sample transport, and being light‐weight, disposable, and deliverable to end‐users. Research has come a significant way in converting labor‐intensive clinical assays into more user‐friendly formats on paper platforms.2 Nevertheless, several hurdles hampering widespread point‐of‐care (POC) application of μPADs remain.3 Quantitative colorimetric assays for example, require elimination of the influence of environmental light conditions,4 whereas fluorescence‐based detection potentially suffers from paper autofluorescence5 or light scattering6 and requires the use of an excitation light source. Liquid‐handling steps pose another challenge to assay simplification. ELISA and Luminex methods require multiple liquid handling steps (such as pipetting, incubation, washing, and signal generation)7 posing significant challenges in translating those assays from dedicated laboratory instruments into simple paper‐based systems. While lateral flow immunochromatographic assays do not suffer from these drawbacks, they have limited sensitivity and generally show poor quantitative performance.8 This applies, for example, to assays for the detection of antibodies in disease diagnostics9 and in drug monitoring‐guided dose optimization of therapeutic antibodies.10
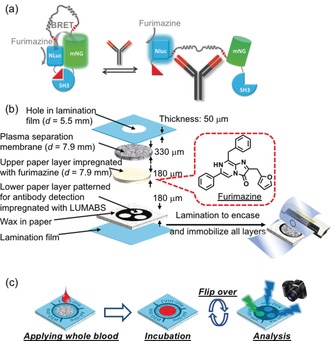
Recently, we successfully addressed some of the drawbacks of classical heterogeneous immunoassays by introducing a novel type of bioluminescence resonance energy transfer (BRET)‐based immunoassay integrating antibody binding and signal generation in a single protein switch referred to as LUMABS (Figure 1 a), making any washing steps unnecessary.11 Antibody binding in LUMABS results in a change in emitted bioluminescence from green to blue. This ratiometric response offers significant advantages over intensity‐based approaches, which are inherently influenced by factors not related to target analyte concentration. These properties and the absence of background fluorescence and scattered excitation light allowed direct detection of antibodies in blood plasma with LUMABS using a mobile phone camera as detector.11a BRET‐based switches are not limited to antibody detection but have also been demonstrated for therapeutic drug monitoring of low‐molecular weight compounds12 and nucleic acids.13
Figure 1.

a) Schematic of the LUMABS working principle with the “closed form” green light‐emitting and the “open form” blue light‐emitting protein sensor in the absence and presence of target antibody, respectively (NLuc=NanoLuc luciferase; mNG=mNeonGreen fluorescent protein).11a b) Schematic of a multi‐layer 3D‐μPAD. All layers are kept together through lamination. c) Schematic of the use of a 3D‐μPAD for simultaneous detection of three different antibodies.
BRET‐based ratiometric sensing is particularly useful for colorimetric assays on paper platforms because it eliminates challenges for μPADs associated with external light sources, environmental light conditions, and intensity‐based signaling. An additional benefit of paper‐based BRET signaling compared to solution phase assays is the suppressed absorption of the bioluminescent signal by blood components because of the short optical path length of thin paper layers.12 While the latter advantage has already been demonstrated by performing the final read‐out on filter paper,12 current assay procedures still require complex and quantitative liquid handling steps such as cell separation, sample dilution, and substrate addition and mixing. These represent significant hurdles for practical application of BRET‐based diagnostics in user‐friendly point‐of‐care testing (POCT) by untrained users.
Herein, we have developed a fully integrated μPAD for use with bioluminescent BRET sensors, demonstrated for LUMABS‐based detection of (multiple) antibodies in spiked whole blood. Figure 1 b shows the design of our device consisting of multiple paper layers vertically arranged in a laminated 3D‐μPAD. The first layer (plasma separation membrane) serves as the sample pad, in which cellular components are separated from a whole‐blood sample. The second layer contains the substrate (furimazine), which is dissolved into the vertically flowing sample liquid and carried along to the third layer containing the BRET‐switching protein (LUMABS). The arrangement of paper layers for furimazine (non‐patterned upper paper layer) and LUMABS immobilization (patterned lower paper layer) was chosen for simple device fabrication. It eliminates the requirement for precise alignment of multiple patterned papers, which would be necessary to achieve multi‐target assays on a single device in the case of reversed layer order (patterned LUMABS layer on top of patterned furimazine layer). After the formation of the antibody‐LUMABS complex, the device is flipped and the bioluminescent signal collected by a digital camera (Figure 1 c). Details on single device layers and on device fabrication are provided in Figure S1 of the Supporting Information, together with information regarding the selection of the paper substrate. The method and experimental setup applied for signal acquisition by a digital camera are illustrated in Figure S2. This 3D‐μPAD design has several important features: 1) Short flow paths compared to lateral flow designs allowing for rapid assays with low sample volumes, including viscous blood serum or plasma, 2) on‐device blood cell removal from whole blood, 3) separate storage of luciferase‐integrating BRET sensors and corresponding substrates (luciferin) in close proximity, and 4) patterned signaling layer for simultaneous detection of multiple targets. Another challenge associated with μPADs is the fact that quantitative results depend on the applied sample volume because signal intensity relies on the absolute amount of analyte in the detection area rather than the concentration. We recently demonstrated that the closed space created by full lamination of a μPAD contributes to limiting the sample volume absorbed by the paper substrate, allowing for sample volume‐independent measurements.14 The 3D‐μPADs were therefore designed as closed compartments by complete device lamination for sample volume‐independent signaling.
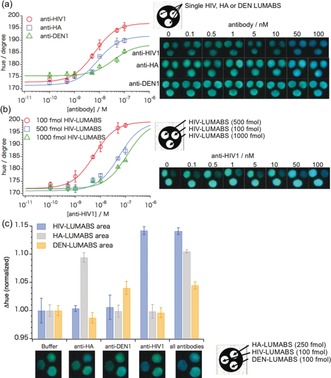
Before integrated device assembly, we first used simple spot tests with an HIV1‐p17 antibody targeting LUMABS on wax‐patterned paper to confirm that the antibody concentration‐dependent response of LUMABS on paper is comparable to the one in bulk solution (Figure S3). Having this confirmed, we next tested the performance in an integrated device. First, devices with the three signal detection areas modified with identical amounts of a single type of LUMABS (anti‐HIV‐LUMABS, anti‐DEN‐LUMABS, or anti‐HA‐LUMABS; Figure S1 d‐1) were evaluated, allowing the collection of triplicate data points from a single sample application (20 μL; Figure 2 a). The mean of the relative standard deviations for the hue values collected from the three detection areas of a single device was below 1 % for all assays, indicating a low variation in sample distribution to the three detection areas (Table S1). Moreover, satisfactory batch‐to‐batch fabrication reproducibility was achieved for the manually assembled 3D‐μPADs, showing a relative standard deviation of the mean of the c 50 values (indicating the antibody concentration resulting in 50% of the maximal hue change) below 1 % (c 50=6.40±0.06 nm) for three batches of anti‐HIV1 detecting devices fabricated on three different days (Figure S4). Next, the colorimetric response of devices having three signal detection areas modified with different amounts of anti‐HIV‐LUMABS (100, 500, and 1000 fmol; Figure S1 d‐2) was evaluated by titration with 0.1–100 nm of anti‐HIV1p17 antibody. The effective response range was found to depend on the amount of sensor protein, with high amounts of LUMABS requiring a higher concentration of antibody to go from the green “closed state” of the sensor to the blue light‐emitting antibody‐bound “open” state. This property could be exploited for measurements over an extended concentration range that cannot be achieved using a single signal detection area. The photographs in Figure 2 a,b show the observed bioluminescence emission providing the basis for the measurement of hue values.
Figure 2.

Typical colorimetric response curves and photographs of bioluminescence emission signals obtained with multi‐layer 3D‐μPADs after application of 20 μL aqueous antibody samples for devices with signal detection areas modified with a) identical amounts of multiple LUMABS (100 fmol for anti‐HIV‐LUMABS and anti‐DEN‐LUMABS, 250 fmol for anti‐HA‐LUMABS) targeting different antibodies (anti‐HIV1, anti‐HA, anti‐DEN1) and b) three different amounts of anti‐HIV‐LUMABS. c) Colorimetric response (normalized Δhue) of 3D‐μPADs responsive to multiple antibodies upon exposure to 33 nm of single antibodies or mixtures; error bars indicate the SD for triplicate experiments using readouts from three different signal detection areas on one single device (a) or three separate devices per data point (b,c). Data recorded 15 min after sample application.
The three detection areas can also be used for multiplex detection of three different antibodies. Figure 2 c shows an experiment with the signal detection areas modified with three previously developed LUMABS targeting anti‐HIV1p17, anti‐HA, and anti‐Dengue antibodies (Figure S1 d‐3). While the extent of the sensor response to their target antibody varies for the different LUMABS, the selectivity is excellent, showing no cross‐talk between different detection areas (Figure 2 c).
An important advantage of the ratiometric, hue‐based readout approach used in this study is that the signal is independent of the bioluminescence intensity. This is particularly important for bioluminescent sensors, as bioluminescence intensity typically decreases in time as a result of substrate turn‐over and/or product inhibition. The results shown in the photographs of Figure 2 b for 0 nm anti‐HIV1 illustrate this point. Whereas the signal intensity varies substantially between the three detection areas because of the different amounts of sensor protein, the color as represented by the hue value is independent of signal intensity (Table S1). Figure S5 shows that hue values are stable and can be reliably detected as long as sufficient light is emitted, since the glow‐type bioluminescence of the NanoLuc/furimazine system extends beyond 30 min.
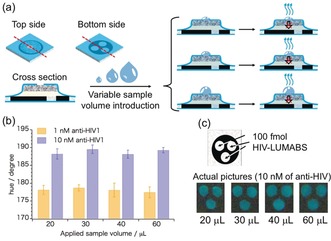
Volume‐independent analysis and long‐term stability represent two important aspects of device performance for point‐of‐care applications. The results shown in Figure 3 demonstrate that our 3D‐μPADs allow sample volume‐independent analyses, provided that the applied volume is above the threshold value required for full wetting of all paper layers and the transport of target antibody and furimazine substrate to the LUMABS‐modified detection areas. No significant differences in colorimetric response were found when varying the volume of applied sample up to a factor of three (20 μL–60 μL). In a study on the storage stability of 3D‐μPADs, fully assembled devices modified with anti‐HIV‐LUMABS were kept under inert gas (Ar) atmosphere at −20 °C for two months and the response to anti‐HIV1 antibodies was tested sporadically. As the data in Figure S6 reveals, no significant deterioration was observed.
Figure 3.

a) Schematic of the sample volume‐independent fully laminated 3D‐μPAD system. b) Experimentally obtained hue values after application of various volumes of aqueous anti‐HIV1 solutions (1 nm or 10 nm) to devices modified with anti‐HIV‐LUMABS; error bars indicate the SD for triplicate readouts from three signal detection areas on one single device. Data recorded 15 min after sample application. c) Outline of the detection areas and photos showing the actual colorimetric response as recorded by the camera.
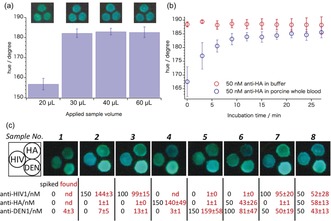
To evaluate the suitability of the 3D‐μPADs for antibody detection in biological samples, we next performed experiments in antibody‐spiked porcine serum. As observed previously, the absolute bioluminescence emission intensities decreased when switching from aqueous solutions to the blood serum matrix, which has been attributed to a lower activity of the NanoLuc enzyme in that matrix.11a For this reason, the amount of LUMABS deposited onto signal detection areas was increased to 500 fmol for all of the investigated sensor variants. Figure S7 shows the response curves obtained in the serum matrix. Linear regression fits were applied to the linear segments of the experimental data. Response curves expanded for the low antibody‐concentration range were used to determine limits of detection using the 3σ method, yielding LODs of 2.8 nm, 7.1 nm, and 19.3 nm for anti‐HIV1, anti‐HA, and anti‐DEN1, respectively (Figure S7 d–f). Having established the performance in blood serum, we finally tested the 3D‐μPADs using whole blood spiked with three different antibodies at variable concentrations. In this case, red and white blood cells, as well as platelets, are removed by the blood separation membrane integrated into the device. First, we established the minimally required volume of whole blood by applying different volumes of whole blood spiked with 50 nm of anti‐HA (Figure 4 a). Not surprisingly, considering the solid constituents of whole blood (haematocrit value), the application of 20 μL of sample did not result in sufficient sample transport to the signal detection areas. Reliable assays required 30 μL or higher volumes of whole blood as shown by the constant hue signal obtained with 30 μL to 60 μL of sample. In addition, incubation times were increased from 15 min to 21 min to cope with the higher viscosity of whole blood compared to aqueous solutions or serum and the time required for blood separation within the device. Figure 4 b shows that hue values increased during the first 18 min after whole blood application, while the response was nearly instantaneous in the case of aqueous antibody solutions.
Figure 4.

3D‐μPADs applied to antibody assays in whole blood: a) hue values obtained from variable amounts of porcine whole blood spiked with 50 nm anti‐HA applied to an anti‐HA targeting 3D‐μPAD; data recorded 21 min after sample application. Photos above the graph show the colorimetric response as recorded by the camera. b) Time‐dependent bioluminescence emission hue values recorded from anti‐HA‐LUMABS modified 3D‐μPADs after application of 20 μL aqueous anti‐HA samples or 30 μL of anti‐HA spiked porcine whole blood. Error bars (a,b) indicate the SD for readouts from three different signal detection areas on one single device. c) Photos of signal detection areas of 3D‐μPADs responsive to multiple antibodies recorded 21 min after application of antibody‐spiked porcine whole blood; spiked and found antibody concentrations are indicated in black and red, respectively; confidence intervals represent SD for triplicate readouts from three separate devices.
Figure 4 c shows the results of quantitative recovery experiments in whole blood spiked with different concentrations of three different antibodies. Quantification was done using calibration data obtained with porcine serum samples (Figure S7 a–c), assuming that there are no significant differences in response behavior towards blood serum and blood plasma generated by the plasma separation membrane. Although the standard deviation is larger for whole blood, there is a reasonable agreement between added (spiked) and actually measured mean antibody concentration values for both blood samples containing single target antibodies and mixtures of multiple antibodies (Figure 4 c).
To the best of our knowledge, this is the first demonstration of a fully integrated paper‐based analytical system relying on ratiometric bioluminescence detection in a single drop of whole blood in a highly user‐friendly “just add the sample” manner. Because the response of the system is independent of the applied sample volume over a wide volume range, no complex reagent handling and no quantitative sample metering are required. Although a standard digital camera was used in this study for signal acquisition, future applications of the 3D‐μPADs may use a smartphone camera, allowing integration of signal detection and application‐based analysis without a dedicated measurement instrument.11a The application of these 3D‐μPADs is also not restricted to LUMABS‐based detection of antibodies but may be combined with any BRET‐based sensor, including recently developed sensors for small‐molecule drugs (LUCIDs)12 and nucleic acids (BRET‐beacons).13 As such, this work represents an important advance in the field of POCT by enabling the transfer of paper‐based analytical device technology from academic research laboratories to the market place.
Conflict of interest
One of the co‐authors, R.A., is currently employed by Promega Benelux B.V., the manufacturer of the NanoLuc enzyme and Furimazine substrate used in the current work. However, this work has been performed without any contribution from Promega and during a period before R.A. has been employed by that company.
Supporting information
As a service to our authors and readers, this journal provides supporting information supplied by the authors. Such materials are peer reviewed and may be re‐organized for online delivery, but are not copy‐edited or typeset. Technical support issues arising from supporting information (other than missing files) should be addressed to the authors.
Supplementary
Acknowledgements
This project has been partially supported by a Japan Society for the Promotion of Science (JSPS) Bilateral Joint Research Projects/Seminars grant and by a Grant‐in‐aid for Scientific Research (B) (Grant No. 18H02008) from JSPS to D.C. as well as by an ERC Starting Grant (ERC‐2011‐StG 280255) and ERC proof of concept grants (ERC‐2013‐PoC 632274 and ERC‐2016‐PoC 755471) to M.M.
K. Tenda, B. van Gerven, R. Arts, Y. Hiruta, M. Merkx, D. Citterio, Angew. Chem. Int. Ed. 2018, 57, 15369.
Contributor Information
Prof. Maarten Merkx, Email: m.merkx@tue.nl.
Prof. Daniel Citterio, Email: citterio@applc.keio.ac.jp.
References
- 1. Martinez A. W., Phillips S. T., Butte M. J., Whitesides G. M., Angew. Chem. Int. Ed. 2007, 46, 1318–1320; [DOI] [PMC free article] [PubMed] [Google Scholar]; Angew. Chem. 2007, 119, 1340–1342. [Google Scholar]
- 2.
- 2a. Yang Y., Noviana E., Nguyen M. P., Geiss B. J., Dandy D. S., Henry C. S., Anal. Chem. 2017, 89, 71–91; [DOI] [PubMed] [Google Scholar]
- 2b. Gong M. M., Sinton D., Chem. Rev. 2017, 117, 8447–8480; [DOI] [PubMed] [Google Scholar]
- 2c. Cate D. M., Adkins J. A., Mettakoonpitak J., Henry C. S., Anal. Chem. 2015, 87, 19–41. [DOI] [PubMed] [Google Scholar]
- 3.
- 3a. Yamada K., Shibata H., Suzuki K., Citterio D., Lab Chip 2017, 17, 1206–1249; [DOI] [PubMed] [Google Scholar]
- 3b. Nilghaz A., Guan L., Tan W., Shen W., ACS Sens. 2016, 1, 1382–1393. [Google Scholar]
- 4.
- 4a. Hong J. I., Chang B.-Y., Lab Chip 2014, 14, 1725–1732; [DOI] [PubMed] [Google Scholar]
- 4b. Lopez-Ruiz N., Curto V. F., Erenas M. M., Benito-Lopez F., Diamond D., Palma A. J., Capitan-Vallvey L. F., Anal. Chem. 2014, 86, 9554–9562. [DOI] [PubMed] [Google Scholar]
- 5. Kwon H., Samain F., Kool E. T., Chem. Sci. 2012, 3, 2542–2549. [Google Scholar]
- 6. Carrilho E., Phillips S. T., Vella S. J., Martinez A. W., Whitesides G. M., Anal. Chem. 2009, 81, 5990–5998. [DOI] [PubMed] [Google Scholar]
- 7.
- 7a. Anderson S., Wakeley P., Wibberley G., Webster K., Sawyer J., J. Immunol. Methods 2011, 366, 79–88; [DOI] [PubMed] [Google Scholar]
- 7b. Lazcka O., Campo F. J. D., Muñoz F. X., Biosens. Bioelectron. 2007, 22, 1205–1217. [DOI] [PubMed] [Google Scholar]
- 8.
- 8a. Banerjee R., Jaiswal A., Analyst 2018, 143, 1970–1996; [DOI] [PubMed] [Google Scholar]
- 8b. Bahadır E. B., Sezgintürk M. K., TrAC Trends Anal. Chem. 2016, 82, 286–306. [Google Scholar]
- 9.
- 9a. Tsai C.-T., Robinson P. V., Cortez F. d. J., Elma M. L. B., Seftel D., Pourmandi N., Pandori M. W., Bertozzi C. R., Proc. Natl. Acad. Sci. USA 2018, 115, 1250–1255; [DOI] [PMC free article] [PubMed] [Google Scholar]
- 9b. Gubala V., Harris L. F., Ricco A. J., Tan M. X., Williams D. E., Anal. Chem. 2012, 84, 487–515. [DOI] [PubMed] [Google Scholar]
- 10. Gill K. L., Machavaram K. K., Rose R. H., Chetty M., Clin. Pharmacokinet. 2016, 55, 789–805. [DOI] [PubMed] [Google Scholar]
- 11.
- 11a. Arts R., den Hartog I., Zijlema S. E., Thijssen V., van der Beelen S. H. E., Merkx M., Anal. Chem. 2016, 88, 4525–4532; [DOI] [PubMed] [Google Scholar]
- 11b. van Rosmalen M., Ni Y., Vervoort D. F. M., Arts R., Ludwig S. K. J., Merkx M., Anal. Chem. 2018, 90, 3592–3599; [DOI] [PMC free article] [PubMed] [Google Scholar]
- 11c. Arts R., Ludwig S. K. J., van Gerven B. C. B., Estirado E. M., Milroy L.-G., Merkx M., ACS Sens. 2017, 2, 1730–1736. [DOI] [PMC free article] [PubMed] [Google Scholar]
- 12.
- 12a. Xue L., Yu Q., Griss R., Schena A., Johnsson K., Angew. Chem. Int. Ed. 2017, 56, 7112–7116; [DOI] [PMC free article] [PubMed] [Google Scholar]; Angew. Chem. 2017, 129, 7218–7222; [Google Scholar]
- 12b. Griss R., Schena A., Reymond L., Patiny L., Werner D., Tinberg C. E., Baker D., Johnsson K., Nat. Chem. Biol. 2014, 10, 598–603. [DOI] [PubMed] [Google Scholar]
- 13. Engelen W., van de Wiel K. M., Meijer L. H. H., Saha B., Merkx M., Chem. Commun. 2017, 53, 2862–2865. [DOI] [PMC free article] [PubMed] [Google Scholar]
- 14. Tenda K., Ota R., Yamada K., Henares T., Suzuki K., Citterio D., Micromachines 2016, 7, 80. [DOI] [PMC free article] [PubMed] [Google Scholar]
Associated Data
This section collects any data citations, data availability statements, or supplementary materials included in this article.
Supplementary Materials
As a service to our authors and readers, this journal provides supporting information supplied by the authors. Such materials are peer reviewed and may be re‐organized for online delivery, but are not copy‐edited or typeset. Technical support issues arising from supporting information (other than missing files) should be addressed to the authors.
Supplementary


