Abstract
EPR spectroscopy reveals the formation of two different semi‐synthetic hydrogenases in vivo. [FeFe] hydrogenases are metalloenzymes that catalyze the interconversion of molecular hydrogen and protons. The reaction is catalyzed by the H‐cluster, consisting of a canonical iron–sulfur cluster and an organometallic [2Fe] subsite. It was recently shown that the enzyme can be reconstituted with synthetic cofactors mimicking the composition of the [2Fe] subsite, resulting in semi‐synthetic hydrogenases. Herein, we employ EPR spectroscopy to monitor the formation of two such semi‐synthetic enzymes in whole cells. The study provides the first spectroscopic characterization of semi‐synthetic hydrogenases in vivo, and the observation of two different oxidized states of the H‐cluster under intracellular conditions. Moreover, these findings underscore how synthetic chemistry can be a powerful tool for manipulation and examination of the hydrogenase enzyme under in vivo conditions.
Keywords: [FeFe] hydrogenase, artificial enzymes, EPR spectroscopy, metalloenzymes
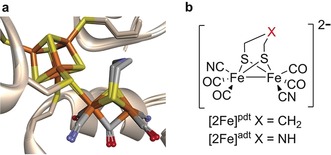
Hydrogenases are the most efficient molecular catalysts known to date for the interconversion of protons and molecular hydrogen.1 In the case of [FeFe] hydrogenase (HydA), the reaction is catalyzed by the H‐cluster, which features a [4Fe4S] cluster coupled to an organometallic [2Fe] subsite (Figure 1 a).2, 3, 4, 5 It is now well established that the biosynthesis of the H‐cluster is a two‐step process, in which the assembly of the [2Fe] subsite requires three HydA specific maturation proteins.6, 7, 8 The catalytic mechanism of this unique cofactor has been intensively studied and several catalytically active and non‐active states of the H‐cluster have been characterized.1, 4, 9, 10, 11, 12 However, the vast majority of mechanistic studies have been limited to in vitro conditions, and their relevance in vivo is still not firmly established.
Figure 1.

Overview of the inorganic cofactor constituting the active site of HydA and the synthetic [2Fe] complexes employed in this study. a) Natural holo‐HydA ([2Fe]adt‐HydA) overlaid on [2Fe]pdt‐HydA (containing the modified [2Fe] subsite), generated from PDB entries 4XDC and 5BYR (Clostridium pasteurianum [FeFe] hydrogenase, CpI).26 b) [Fe2(pdt)(CO)4(CN)2]2−, [2Fe]pdt, and [Fe2(adt)(CO)4(CN)2]2−, [2Fe]adt. Fe=orange, S=yellow, N=blue, O=red.
In 2013, it was shown that synthetic analogues of the [2Fe] subsite can be incorporated into the enzyme. This enables the preparation of semi‐synthetic hydrogenases and the possibility to manipulate the enzyme using synthetic chemistry, which has proven to be a powerful tool for biophysical studies.3, 13, 14, 15, 16, 17 More recently this artificial maturation technique was extended to in vivo conditions.18 This allowed the overproduced apo‐enzyme to be activated with synthetic [Fe2(adt)(CO)4(CN)2]2− ([2Fe]adt, adt=azadithiolate)19 cofactors, generating fully functional enzymes inside living cells. In this study, we monitor the formation of two such semi‐synthetic H‐clusters in vivo using EPR spectroscopy, a technique well‐suited for whole cell studies.20, 21, 22 More specifically, the technique was first verified by treating HydA‐expressing E. coli cells with [Fe2(pdt)(CO)4(CN)2]2− ([2Fe]pdt, pdt=propanedithiolate),23, 24, 25 generating [2Fe]pdt‐HydA (Figure 1). In this modified H‐cluster the amine bridgehead present in the natural [2Fe]adt cofactor is replaced with a methylene group, preventing reduction of the [2Fe] subsite and impeding catalytic turnover. Indeed, earlier in vitro spectroscopic and crystallographic studies have shown that [2Fe]pdt‐HydA generates a model of the enzyme in which the [2Fe] subsite is locked in an oxidized Fe2 I,II state, similar to the EPR active Hox‐state of the native enzyme.3, 14, 26 This property allows us to readily follow its formation under in vivo conditions. Moreover, we show how the technique can be applied to also generate EPR active states of the native cofactor by treating cells with [2Fe]adt. Thus, the present study provides the first spectroscopic verification of the formation of semi‐synthetic hydrogenases in whole cells. Additionally, it provides a direct link to earlier mechanistic studies by comparing synthetically modified hydrogenases under in vivo and in vitro conditions.
To facilitate the whole‐cell EPR study, the expression of C. reinhardtii HydA1 in E. coli was optimized in minimal media (Figure S1). The expression was done in the absence of the HydA specific maturases resulting in a form of the enzyme containing the [4Fe4S] cluster but lacking the [2Fe] subsite (apo‐HydA1). Following the over‐expression of HydA1, the cell cultures were harvested and washed under anaerobic conditions, and the resulting dense cell paste was transferred to EPR tubes generating a cell sample containing apo‐HydA1. To form [2Fe]pdt‐HydA1, anaerobic apo‐HydA1‐expressing E. coli cultures were treated with [2Fe]pdt and incubated for 1 h before harvesting (100 μg, 156 nmol, of [2Fe]pdt 50 mL−1 cell culture).
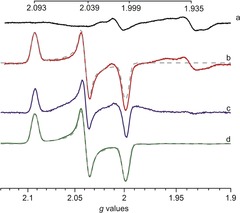
Already prior to the formation of [2Fe]pdt‐HydA1, the [4Fe4S] cluster present in apo‐HydA1 is potentially detectable under our experimental conditions.8, 27 As seen in Figure 2 (spectrum a), the EPR spectrum of apo‐HydA1‐expressing cells featured a number of signals, but we could only observe minor differences compared to control samples of BL21(DE3) cells lacking the HydA1 plasmid (Supporting Information, Figure S2). The lack of a distinct feature from apo‐HydA1 indicates that the intracellular environment is not sufficiently reducing to generate the EPR active [4Fe4S]+‐HydA1 species in readily detectable amounts.
Figure 2.

Comparison of X‐band EPR spectra recorded on whole cells samples containing apo‐HydA1 or [2Fe]pdt‐HydA1 and purified [2Fe]pdt‐HydA1. Spectrum of cells containing a) the overproduced apo‐HydA1 enzyme and b) overproduced apo‐HydA1 enzyme treated with [2Fe]pdt under in vivo conditions, revealing an Hox‐like signal. c) Spectrum (a) subtracted from spectrum (b). d) Spectrum of purified [2Fe]pdt‐HydA1 (100 μm), treated with thionine to generate [4Fe‐4S]2+‐[FeIFeII]pdt (the signal was divided by a factor of 9.5 for clarity); simulations (with gzyx=2.093, 2.039, 1.999) are overlaid onto spectra (b) and (d) (grey dashes, see Table S1 for simulation parameters). Spectra were recorded at 10 K, microwave power=1 mW, frequency=9.28 GHz, modulation amplitude=1.5 mT, modulation frequency=100 kHz.
Conversely, when the cells were treated with [2Fe]pdt, the resulting EPR spectrum displayed an intense rhombic signal, with an additional feature at g≈1.935 (Figure 2, spectrum b). The former signal is in good agreement with the spectrum reported for [2Fe]pdt‐HydA1 under in vitro conditions,14 and with the native protein in the oxidized state (Hox) (see the Supporting Information, Table S2).9, 11 Samples of E. coli cells lacking the HydA1 plasmid treated with [2Fe]pdt did not display any new signal as compared to untreated cells (Supporting Information, Figure S3), underscoring the requirement for both apo‐HydA1 and the synthetic cofactor for the generation of the intense Hox‐like signal. Consequently, we assign the signal to the formation of [2Fe]pdt‐HydA1, residing in the paramagnetic Hox‐like state previously described as [4Fe‐4S]2+‐[FeIFeII]pdt.14, 16 To further support the assignment of the observed EPR signal we generated purified [2Fe]pdt‐HydA1 ([2Fe]pdt‐HydA1pur) through a modified literature protocol.8, 13, 27 The purified semi‐synthetic protein was oxidized by thionine to generate the Hox‐like state, and the EPR spectrum of [2Fe]pdt‐HydA1pur showed the expected rhombic signal (Figure 2, spectrum d).14 Simulation of the signal returned g zyx=2.093, 2.039, 1.999 (Figure 2, spectrum d, dashed line). The simulated spectrum based on in vitro parameters provided a good fit also for the in vivo spectrum without any additional adjustment (Figure 2, spectrum b, dashed line). The feature at g≈1.935 present in the whole cell samples is not discernible in the purified in vitro sample; but as it appears also in the BL21(DE3) control cells, we tentatively attribute it to one or more EPR active species present in the expression host cells. The properties of the Hox‐like signal was further studied by comparing the microwave power dependence for whole cell and purified samples in the in 5–20 K range (Supporting Information, Figure S4–S14). The microwave power values at half‐saturation (P1/2) values are summarized in Table 1 and indicate only minor differences between the different samples. In combination, the similarities in observed g values as well as microwave power dependence under in vitro and in vivo conditions suggest a highly similar coordination and solvation environment of the H‐cluster, attributable to the isolated nature of the cofactor inside the protein. No signal attributable to an Hox‐CO state was observed, suggesting that one CO ligand is spontaneously released from the [2Fe]pdt complex upon formation of [2Fe]pdt‐HydA1 both in vitro and in vivo.
Table 1.
Comparison of the microwave power saturation properties of [2Fe]pdt‐HydA1 under in vivo and in vitro conditions. EPR spectra were recorded at 5, 10, and 20 K, microwave power=0.02–50 mW. Frequency=9.28 GHz, modulation amplitude=1.5 mT, modulation frequency=100 kHz. The values were calculated using the amplitude of the g=2.09 peak for the in vivo and in vitro samples.
| T [K] | in vivo [mW] | in vitro [mW] |
|---|---|---|
| 5 | 0.54 | 0.55 |
| 10 | 0.96 | 1.16 |
| 20 | 0.95 | 0.95 |
The extent of [2Fe]pdt incorporation into HydA1 was assessed by spin quantification, performed by comparing the background‐subtracted Hox‐like signal (Figure 2, spectrum c) to a Cu2+ standard. This allowed us to estimate the concentration of [2Fe]pdt‐HydA1 as 1.4±0.3 μm, after concentrating 50 mL of cell culture (OD600=0.8±0.2) to approximately 200 μL. In parallel, the HydA1 content in the cell cultures was also determined through in vitro catalytic assays, performed as previously described.18 Based on the H2 production rates observed after the activation of cell lysates using [2Fe]adt the amount of HydA1 available for activation was approximately 1.2±0.15 nmol 50 mL−1 cell culture (Supporting Information, Figure S15). This compares reasonably well with the spin quantification of the Hox‐like signal (a total of 280±60 pmol of HydA1 50 mL−1 cell culture) indicating that a significant fraction (≈25 %) of the enzyme incorporates the [2Fe]pdt cofactor and contributes to the Hox‐like signal.
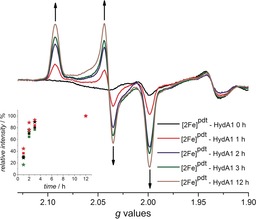
Still, the difference between the activity assays and the spin quantification suggests that the formation of [2Fe]pdt‐HydA1 was not complete after 1 h. To study the rate of [2Fe]pdt incorporation under these conditions whole cell samples were prepared as described above, but the incubation time in the presence of [2Fe]pdt was varied. Samples were collected after 1 h, 2 h, 3 h, and 12 h incubation, and their corresponding EPR spectra recorded (Figure 3). The Hox‐like signal assigned to [2Fe]pdt‐HydA1 becomes clearly discernible within 1 h (Figure 3, spectrum 1 h), and extended incubation time results in a more intense signal before approaching a plateau after 3 h (Figure 3, and the Supporting Information, Figure S16). Spin quantification shows a 3–3.5‐fold increase in spin concentration after a 3 h incubation, thus reaching 70–85 % of the intensity expected from the in vitro catalytic assays. The requirement for incubation on an hour time‐scale clearly indicates that the rate of cofactor insertion is significantly slower than that observed under in vitro conditions, in which it occurs within minutes.13, 28 In summary, the EPR data shows that the artificial maturation method allows spontaneous formation of a synthetically modified H‐cluster with good yields, at intracellular concentrations readily observable by X‐band EPR spectroscopy.
Figure 3.

Formation of [2Fe]pdt‐HydA1 under in vivo conditions monitored by EPR spectroscopy. Samples collected of cells expressing apo‐HydA1 after 1, 2, 3 and 12 h of incubation in the presence of [2Fe]pdt, the appearance of the Hox‐like signal is indicated with arrows. Inset: Kinetic trace of the appearance of the [2Fe]pdt‐HydA1 signal, determined from the amplitude of the g=2.093 (red), 2.039 (black), and 1.999 (green) peaks, squares and asterisks represent two separate experiments, and the individual data sets were normalized to the 12 h time point. Spectra were recorded at 10 K, microwave power=1 mW, frequency=9.28 GHz, modulation amplitude=1.5 mT, modulation frequency=100 kHz.
The aforementioned experiments clearly show that a paramagnetic Hox‐like state is present under in vivo conditions. Additionally, under sufficiently reducing conditions we expect the formation of a reduced, EPR silent, H′red‐like state previously observed under in vitro conditions (H′red refers to a reduced form of the H‐cluster in which the [2Fe] subsite is not protonated, [4Fe‐4S]1+‐[FeIFeII]pdt).14 Consequently, an equilibrium between the Hox‐like and H′red‐like states can be anticipated to exist in vivo. Indeed, this redox transition was readily observed in dithionite‐treated cell extracts containing [2Fe]pdt‐HydA1 (Supporting Information, Figure S17). However, it did not appear to occur spontaneously in vivo, as incubation of washed [2Fe]pdt treated cells for 3 h under anaerobic conditions did not result in significant changes of the EPR spectra (Supporting Information, Figure S18). Similarly, treating the cells with chemical oxidants or reductants did not influence the redox state of the H‐cluster (Supporting Information, Figure S19). The apparent stability of the Hox‐like state likely arises from a combination of the intrinsic stability of the modified cofactor and the redox buffering provided by the intracellular environment.
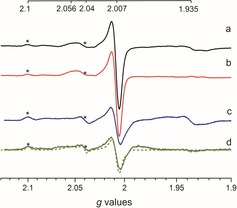
After the verification of the technique employing [2Fe]pdt, we also explored the possibility to spectroscopically observe a semi‐synthetic version of the native cofactor, [2Fe]adt‐HydA1. The EPR spectrum recorded on samples of apo‐HydA1‐expressing cell cultures incubated with [2Fe]adt (100 μg, 156 nmol) for 1 h revealed a number of new signals (Figure 4 and the Supporting Information, Figure S20). The overall spin concentration appeared lower than that observed after incubation with [2Fe]pdt, 0.7±0.3 μm versus 1.4±0.3 μm, respectively. Still, an intense EPR signal at g=2.007 was observed with additional features clearly discernible at g≈2.1 and 2.06–2.04. A comparison of the spectra recorded at 20 and 10 K suggest that these signals belong to two distinct species. One species appears to contribute to the signal at g≈2.007 with an additional signal at g=2.056, as both of these are significantly stronger at 20 K relative to the spectrum obtained at 10 K (Figure 4, spectrum a, and the Supporting Information, Figure S21). Conversely, the signals at g=2.100 and 2.040 remain clearly visible in the low‐temperature spectrum, together with a less intense feature at g≈2.007 (Figure 4, spectrum c, and the Supporting Information, Figure S22). Comparable signals have previously been reported for HydA1 studied in vitro and attributed to oxidized states of the H‐cluster (see Table S2).1, 10 In agreement with this, reference samples of purified [2Fe]adt‐HydA1 ([2Fe]adt‐HydA1pur) oxidized with thionine displayed highly similar spectral features (Supporting Information, Figure S23). In combination with simulations based on in vitro data, this allows us to assign the observed whole cell signatures to a mixture of the Hox (gzyx=2.100, 2.040, and 1.998) and Hox‐CO state (gzyx=2.056, 2.007, and 2.007) (Figure 4 and the Supporting Information, Figure S24, simulation overlaid on spectrum d as dashed line).
Figure 4.

X‐band EPR spectra of whole cell samples containing [2Fe]adt‐HydA1 recorded at different temperatures. a) Spectrum obtained at 20 K and b) apo‐HydA1 spectrum subtracted from spectrum (a). c) Spectrum obtained at 10 K and d) apo‐HydA1 spectrum subtracted from spectrum (c). A simulation combining Hox (40 %) and Hox‐CO (60 %) is overlaid onto spectrum (d) (grey dashes, see Table S1 for simulation parameters). Spectra were recorded at microwave power=1 mW, frequency=9.28 GHz, modulation amplitude=1 mT, modulation frequency=100 kHz. Signals attributable to the Hox state of the H‐cluster are labeled with asterisks.
The lower signal intensity compared to [2Fe]pdt‐HydA1 is potentially attributable to the presence of EPR silent states, that is, a small population of Hred or H′red. However, we could not observe any distinct signals around g≈2.07 or 1.88, which would indicate the presence of the Hsred or Hhyd states.9, 29 This preference for the oxidized states under our experimental conditions is consistent with the high in vivo concentration of the Hox‐like state observed for [2Fe]pdt‐HydA1. Moreover, it is noteworthy that the Hox‐CO state is only observed for [2Fe]adt‐HydA1. A difference in affinity towards CO binding between [2Fe]adt‐HydA1 and [2Fe]pdt‐HydA1 has previously been observed in vitro and appears to be retained under physiological conditions.14
In summary, the in vivo generation of two semi‐synthetic hydrogenases, featuring both a modified and the native cofactor, has been verified by whole cell EPR spectroscopy. The study shows that species strikingly similar to the Hox and Hox‐CO states, characterized in vitro, are also observable in vivo. Moving forward, these initial observations strongly support the feasibility of detailed spectroscopic analysis of the H‐cluster under physiological conditions. In a wider context, the preparation of [2Fe]pdt‐HydA1 also showcases how the hydrogenase enzyme can be used as a scaffold to generate stable semi‐synthetic enzymes with new properties, by combining it with synthetic cofactors inside living cells.
Conflict of interest
The authors declare no conflict of interest.
Supporting information
As a service to our authors and readers, this journal provides supporting information supplied by the authors. Such materials are peer reviewed and may be re‐organized for online delivery, but are not copy‐edited or typeset. Technical support issues arising from supporting information (other than missing files) should be addressed to the authors.
Supplementary
Acknowledgements
The Swedish Research Council, V.R. (contract no. 621‐2014‐5670), the Swedish Research Council for Environment, Agricultural Sciences and Spatial Planning, Formas (contract no. 213‐2014‐880), the ERC (StG contract no. 714102) the foundation Kung Karl XVI Gustafs 50‐års‐fond för vetenskap, miljö och teknik, the Olle Engkvist Byggmästare and the Wenner‐Gren foundations are gratefully acknowledged for funding.
L. S. Mészáros, B. Németh, C. Esmieu, P. Ceccaldi, G. Berggren, Angew. Chem. Int. Ed. 2018, 57, 2596.
Contributor Information
Dr. Lívia S. Mészáros, http://www.kemi.uu.se/research/molecular-biomimetic/photosynthesis/berggren-group/.
Dr. Gustav Berggren, Email: Gustav.Berggren@kemi.uu.se.
References
- 1. Lubitz W., Ogata H., Rudiger O., Reijerse E., Chem. Rev. 2014, 114, 4081–4148. [DOI] [PubMed] [Google Scholar]
- 2. Peters J. W., Lanzilotta W. N., Lemon B. J., Seefeldt L. C., Science 1998, 282, 1853–1858. [DOI] [PubMed] [Google Scholar]
- 3. Berggren G., Adamska A., Lambertz C., Simmons T. R., Esselborn J., Atta M., Gambarelli S., Mouesca J., Reijerse E., Lubitz W., et al., Nature 2013, 499, 66–69. [DOI] [PMC free article] [PubMed] [Google Scholar]
- 4. Silakov A., Wenk B., Reijerse E., Lubitz W., Phys. Chem. Chem. Phys. 2009, 11, 6592–6599. [DOI] [PubMed] [Google Scholar]
- 5. Nicolet Y., Piras C., Legrand P., Hatchikian C. E., Fontecilla-Camps J. C., Structure 1999, 7, 13–23. [DOI] [PubMed] [Google Scholar]
- 6. Posewitz M. C., King P. W., Smolinski S. L., Zhang L., Seibert M., Ghirardi M. L., J. Biol. Chem. 2004, 279, 25711–25720. [DOI] [PubMed] [Google Scholar]
- 7. Shepard E. M., Mus F., Betz J. N., Byer A. S., Duffus B. R., Peters J. W., Broderick J. B., Biochemistry 2014, 53, 4090–4104. [DOI] [PubMed] [Google Scholar]
- 8. Mulder D. W., Boyd E. S., Sarma R., Lange R. K., Endrizzi J. A., Broderick J. B., Peters J. W., Nature 2010, 465, 248–251. [DOI] [PubMed] [Google Scholar]
- 9. Adamska A., Silakov A., Lambertz C., Rüdiger O., Happe T., Reijerse E., Lubitz W., Angew. Chem. Int. Ed. 2012, 51, 11458–11462; [DOI] [PubMed] [Google Scholar]; Angew. Chem. 2012, 124, 11624–11629. [Google Scholar]
- 10. Kamp C., Silakov A., Winkler M., Reijerse E. J., Lubitz W., Happe T., Biochim. Biophys. Acta Bioenerg. 2008, 1777, 410–416. [DOI] [PubMed] [Google Scholar]
- 11. Mulder D. W., Ratzloff M. W., Shepard E. M., Byer A. S., Noone S. M., Peters J. W., Broderick J. B., King P. W., J. Am. Chem. Soc. 2013, 135, 6921–6929. [DOI] [PubMed] [Google Scholar]
- 12.M. Senger, S. Mebs, J. Duan, O. Shulenina, K. Laun, L. Kertess, F. Wittkamp, U.-P. Apfel, T. Happe, M. Winkler, et al., Phys. Chem. Chem. Phys 2018, DOI: 10.1039/C7CP04757F. [DOI] [PubMed]
- 13. Esselborn J., Lambertz C., Adamska-Venkates A., Berggren G., Noth J., Siebel J., Hemschemeier A., Reijerse E., Fontecave M., Lubitz W., et al., Nat. Chem. Biol. 2013, 9, 607–609. [DOI] [PMC free article] [PubMed] [Google Scholar]
- 14. Adamska-Venkatesh A., Krawietz D., Siebel J., Weber K., Happe T., Reijerse E., Lubitz W., J. Am. Chem. Soc. 2014, 136, 11339–11346. [DOI] [PubMed] [Google Scholar]
- 15. Siebel J. F., Adamska-Venkatesh A., Weber K., Rumpel S., Reijerse E., Lubitz W., Biochemistry 2015, 54, 1474–1483. [DOI] [PubMed] [Google Scholar]
- 16. Adamska-Venkatesh A., Simmons T. R., Siebel J. F., Artero V., Fontecave M., Reijerse E., Lubitz W., Phys. Chem. Chem. Phys. 2015, 17, 5421–5430. [DOI] [PubMed] [Google Scholar]
- 17. Reijerse E. J., Pham C. C., Pelmenschikov V., Gilbert-Wilson R., Adamska-Venkatesh A., Siebel J. F., Gee L. B., Yoda Y., Tamasaku K., Lubitz W., et al., J. Am. Chem. Soc. 2017, 139, 4306–4309. [DOI] [PMC free article] [PubMed] [Google Scholar]
- 18. Khanna N., Esmieu C., Mészáros L. S., Lindblad P., Berggren G., Energy Environ. Sci. 2017, 10, 1563–1567. [DOI] [PMC free article] [PubMed] [Google Scholar]
- 19. Li H., Rauchfuss T. B., J. Am. Chem. Soc. 2002, 124, 726–727. [DOI] [PubMed] [Google Scholar]
- 20. Horch M., Lauterbach L., Saggu M., Hildebrandt P., Lendzian F., Bittl R., Lenz O., Zebger I., Angew. Chem. Int. Ed. 2010, 49, 8026–8029; [DOI] [PubMed] [Google Scholar]; Angew. Chem. 2010, 122, 8200–8203. [Google Scholar]
- 21. Sears H. J., Bennett B., Spiro S., Thomson A. J., Richardson D. J., Biochem. J. 1995, 310, 311–314. [DOI] [PMC free article] [PubMed] [Google Scholar]
- 22. Beinert H., Lee W., Biochem. Biophys. Res. Commun. 1963, 13, 40–45. [DOI] [PubMed] [Google Scholar]
- 23. Le Cloirec A., Davies S. C., Evans D. J., Hughes D. L., Pickett C. J., Best S. P., Borg S., Chem. Commun. 1999, 2285–2286. [Google Scholar]
- 24. Schmidt M., Contakes S. M., Rauchfuss T. B., J. Am. Chem. Soc. 1999, 121, 9736–9737. [Google Scholar]
- 25. Lyon E. J., Georgakaki I. P., Reibenspies J. H., Darensbourg M. Y., Angew. Chem. Int. Ed. 1999, 38, 3178–3180; [PubMed] [Google Scholar]; Angew. Chem. 1999, 111, 3373–3376. [Google Scholar]
- 26. Esselborn J., Muraki N., Klein K., Engelbrecht V., Metzler-Nolte N., Apfel U.-P., Hofmann E., Kurisu G., Happe T., Chem. Sci. 2016, 7, 959–968. [DOI] [PMC free article] [PubMed] [Google Scholar]
- 27. Mulder D. W., Ortillo D. O., Gardenghi D. J., Naumov A. V., Ruebush S. S., Szilagyi R. K., Huynh B., Broderick J. B., Peters J. W., Biochemistry 2009, 48, 6240–6248. [DOI] [PubMed] [Google Scholar]
- 28. Megarity C. F., Esselborn J., Hexter S. V., Wittkamp F., Apfel U. P., Happe T., Armstrong F. A., J. Am. Chem. Soc. 2016, 138, 15227–15233. [DOI] [PubMed] [Google Scholar]
- 29. Mulder D. W., Guo Y., Ratzloff M. W., King P. W., J. Am. Chem. Soc. 2017, 139, 83–86. [DOI] [PubMed] [Google Scholar]
Associated Data
This section collects any data citations, data availability statements, or supplementary materials included in this article.
Supplementary Materials
As a service to our authors and readers, this journal provides supporting information supplied by the authors. Such materials are peer reviewed and may be re‐organized for online delivery, but are not copy‐edited or typeset. Technical support issues arising from supporting information (other than missing files) should be addressed to the authors.
Supplementary


