

Abstract
The Ets‐1 oncoprotein is a transcription factor that promotes target gene expression in specific biological processes. Typically, Ets‐1 activity is low in healthy cells, but elevated levels of expression have been found in cancerous cells, specifically related to tumor progression. Like the vast majority of the cellular effectors, Ets‐1 does not act alone but in association with partners. Given the important role that is attributed to Ets‐1 in major human diseases, it is crucial to identify its partners and characterize their interactions. In this context, two DNA‐repair enzymes, PARP‐1 and DNA‐PK, have been identified recently as interaction partners of Ets‐1. We here identify their binding mode by means of protein docking. The results identify the interacting surface between Ets‐1 and the two DNA‐repair enzymes centered on the α‐helix H1 of the ETS domain, leaving α‐helix H3 available to bind DNA. The models highlight a hydrophobic patch on Ets‐1 at the center of the interaction interface that includes three tryptophans (Trp338, Trp356, and Trp361). We rationalize the binding mode using a series of computational analyses, including alanine scanning, molecular dynamics simulation, and residue centrality analysis. Our study constitutes a first but important step in the characterization, at the molecular level, of the interaction between an oncoprotein and DNA‐repair enzymes.
Keywords: DNA‐PK, Ets‐1, PARP‐1, protein docking, protein‐protein interaction
1. INTRODUCTION
Ets‐1 is the founder of the ETS family of transcription factors, which is characterized by a winged helix‐turn‐helix DNA binding domain (DBD), also known as the ETS domain.1 Ets‐1 is a 54‐kDa nuclear protein that regulates gene expression by binding specific DNA elements, called ETS‐binding sites (EBS), at its α‐helix 3 (H3).2 Compared to other transcription factors, Ets‐1 has a particular feature as its transcriptional activity is auto‐inhibited through two inhibitory domains.3 In general, Ets‐1 cannot act alone to control its target genes but requires protein interaction partners to do so. Ets‐1 can then activate the transcription of genes involved in numerous cellular mechanisms, including proliferation, differentiation, adhesion, migration, invasion, senescence, and apoptosis.4 Except under specific conditions hampering the auto‐inhibition, the Ets‐1 expression level is low and in adults restricted to myeloid and lymphoid tissues. However, when overexpressed, this transcription factor is associated with the development of inflammatory and invasive pathologies such as rheumatoid arthritis,5 glomerulonephritis,6 atherosclerosis,7 and cancers.8
Given the important role attributed to Ets‐1 in human invasive diseases, and the importance of its protein partners in specificity of action, it is crucial to understand these interactions at the molecular level. We have previously identified two DNA‐repair enzymes as new interaction partners of Ets‐1: DNA‐PK (DNA‐dependent protein kinase) and PARP‐1 (Poly‐[ADP‐ribose]‐polymerase‐1).9 DNA‐PK is a DNA‐repair enzyme, able to phosphorylate Ets‐1 in a DNA‐independent manner and modulate its transcriptional activity.10 We have also shown that Ets‐1 is poly‐ADP‐ribosylated (PARylated) by PARP‐1, which in turn activates PARP‐1 in a DNA‐independent manner.11 Thus, both PARP‐1 and DNA‐PK are able to posttranslationally modify Ets‐1, respectively, by PARylation and phosphorylation, strengthening the functional links between DNA repair enzymes and Ets‐1.
Experimental interaction mapping12 shows that the DNA‐binding domain (ETS domain, 85 amino acids) of Ets‐1 interacts with the BRCT domain (BRCA1 C‐terminal domain, 98 amino acids) of PARP‐1 and with the SAP domain (SAF/AB Acinus and PIAS domain, 54 amino acids) of Ku70, one of the regulatory subunits of DNA‐PK. The three‐dimensional structures of the three single domains have been solved by X‐ray crystallography and NMR spectroscopy (PDB entry: 1GVJ, 2COK, and 1JJR, respectively).
These experimental and structural data represent a solid starting point to undertake structural interaction studies by means of protein docking and additional computational analyses. The identification of key residues, present on the surface of the ETS domain and involved in the interaction with its protein partners, is an important step in the understanding of the binding mode between Ets‐1 and its protein partners. This may ultimately not only lead to the design of inhibitors of the recognition process but also provide a better understanding of the role of Ets‐1 in invasive diseases.
2. MATERIALS AND METHODS
2.1. Selection of the isolated partners
Three‐dimensional structures of the three domains were available in the PDB. For the ETS domain of Ets‐1, we selected the crystallographic structure (1GVJ) with the best resolution (1.5 Å) and an acceptable R/R free ratio (20.8/23.5%). Docking calculations were performed on a truncated structure of ETS domain where auto‐inhibitory domains (residues 296‐331 and residues 416‐436) had been removed. This truncated structure mimics the open, or activated, form of the ETS domain, required for binding to its protein partners. BRCT (2COK) and SAP (1JJR) are both NMR lowest‐energy structures of the domains on PARP‐1 and DNA‐PK that were found to interact with ETS and were not modified.
2.2. Protein‐protein interaction modeling
We have used ClusPro2.0,13, 14 Zdock,15 PyDOCK,16 and InterEvDock,17 all top performers in the CAPRI protein docking experiment,18 in order to simulate all the possible complexes between ETS and the BRCT or SAP domains without any suggestion of interacting or masked residues. Because of the similarity between all the proposed binding modes (Figure 1), we subsequently decided to use ClusPro2.0 webserver that is based on the PIPER, an FFT‐based protein docking program.
Figure 1.

Representation of the centers of mass of the docking poses obtained for BRCT (light blue spheres) and SAP (pink spheres) with PyDOCK, ZDock, and InterEvDock. Poses obtained with ClusPro2.0 for BRCT are in blue spheres and for SAP in purple spheres. 79% of the solutions are located in the neighborhood of the ETS H1 (orange helix) and in addition not in contact with DNA (gray) [Color figure can be viewed at http://wileyonlinelibrary.com]
For the following calculations, the ETS domain was treated as the receptor, while BRCT and SAP domains were treated as the ligand. Representative structures of the first 10 clusters, corresponding to 90% and 89% of the total number of docking poses for BRCT and SAP to ETS, respectively, were kept and scored using the default scoring function. In this function, balanced coefficients were used, which means that both electrostatic and hydrophobic contributions are weighted equally. These coefficients are recommended when no prior knowledge is available of what forces dominate in the studied complex, for more details see Kozakov et al.19 In addition, after the identification of the hydrophobic patch, we rescored the ClusPro solutions in order to emphasize the fact that binding mode is guided by hydrophobic interactions. The obtained docking poses were similar to the initial ones.
2.3. Molecular dynamics
Molecular dynamics (MD) simulations were performed on ETS without inhibitory domain, that is, residues 331‐415 of PDB 1GVJ chain A. The structure was placed in the center of a rhombic dodecahedron box filled with SPC water molecules,20 keeping a minimum distance of 6 Å from the protein to the edge of the box. An appropriate amount of random water molecules was replaced by Cl− ions to ensure electrostatic neutrality. The system was relaxed using 1000 steps of steepest descent energy minimization, followed by 20 ps MD simulation where the protein coordinates were removed from the equations of motion, in order to equilibrate the solvent phase, and another 20 ps of free MD (both using a time step of 2 fs). Finally, a production run of 20 ns was performed. All calculations were done with the GROMACS suite of programs,21 version 4.5.4, using the Gromos96 43a2 parameter set.22 A time step of 4 fs was employed, and the neighbor list was updated every 5 steps. The protein and the solvent were independently coupled to a temperature bath at 310 K, using velocity rescaling with coupling constants of 0.1 ps.23 Pressure was maintained at 1 bar using isotropic pressure coupling with a coupling constant of 1 ps. Van der Waals interactions were cut off at a distance of 1.0 nm and electrostatic interactions calculated with the particle mesh Ewald method,24 using fourth‐order splining and a grid spacing of 0.12 nm. Equations of motion for the water molecules were solved analytically with the SETTLE algorithm.25 All bonds were constrained using the LinCS algorithm26 and rotational motion involving CH3 groups was slowed down using virtual sites.27
Clustering was performed on the basis of the RMSD matrix,28 where pair‐wise RMSD was calculated on residues Trp338 and Trp361 over the course of the simulation using a frame separation of 10 ps. The center structure for each cluster (the structure with the smallest average distance to the other members of the cluster) was then saved as representative of the cluster.
For the simulation of the complexes, wild type (wt) and the five‐point mutant W338A/Q339A/L342A/W356A/W361A (5x), the structure from the docking studies was used, with the side‐chains of the mutated residues cut off after the CB atom to obtain the 5x structure. All simulation parameters were equal, with the difference that a distance of 1 nm to the edge of the box was employed, and the production runs of 50 ns were started immediately after the energy minimization.
2.4. Residue interaction network calculation
The residue interaction network (RIN) of the docked structures ETS/BRCT and ETS/SAP was calculated using Chimera 1.1029 through Cytoscape 3.230 and its structureViz2 app.31 Hydrogen atoms were added and water molecules were ignored. Default parameters were used for the detection of residue‐residue interactions. The residue centrality analysis (RCA) was performed by calculating the change of characteristic path length of the network upon removal of each single residue from the network. The method is described in Del Sol et al.32 and is available through the RINspector app.33 Residues were considered as relevant if their z score ≥ 2.
2.5. Computational alanine scanning
In order to identify hot spots at the protein‐protein interface, computational alanine scanning was applied to our ETS/BRCT and ETS/SAP models.34 As described in Kortemme et al., the algorithm automatically identifies all interface residues in a protein‐protein interface. An interface residue is defined as a residue that has at least one atom within a sphere with a 4‐Å radius of an atom belonging to the other partner in the protein complex, or a residue that becomes significantly buried upon complex formation. The program then replaces each of the interface residues individually with alanine residues and computes the effect of this mutation on the binding free energy of the complex. Residues considered as hot spots are those for which alanine mutations have a destabilizing effect of more than 1 kcal mol−1 on ΔΔGbinding.35
2.6. Visualization
All visualization and production of figures were done with PyMOL (The PyMOL Molecular Graphics System, Version 1.7.2.1 Schrödinger, LLC).
3. RESULTS
3.1. Docking of the interacting partners and evaluation of the interaction surface
The CAPRI community‐wide protein‐docking experiment has catalyzed the development of computational protein docking for more than 15 years and has led to the emergence of now wide‐spread protein docking algorithms and fully automatic web servers.36, 37, 38 We decided to use an ensemble of four consistently‐performing docking programs (see section 2.2) to model the interaction between ETS and BRCT or SAP domains. Although both the structure as well as available literature3, 39 hint at the binding site to correspond to the patch occluded by the autoinhibitory domains, we decided to impose no prior binding restraints but apply truly blind docking. Interestingly, a large majority of raw docking solutions (close to 80%) for both protein partners are located in the vicinity of the ETS α‐helix 1 (H1) and in between β‐sheets 1 and 2 (S1, S2) (Figure 1). Most of the remaining poses were found to be in proximity to the DNA binding site (H3). These solutions are incompatible with simultaneous DNA binding, which we know from literature is occurring,2 and were therefore not further explored.
Figure 1 shows the centers of mass for the whole set of binding poses for BRCT (blue spheres) and SAP (pink spheres) proposed by the different docking programs. We found that the ClusPro2.0 results, for both BRCT as well as SAP, were all located in the same region, more precisely in the neighborhood of ETS H1 and away from the DNA binding site.
In order to add poise to our binding mode, we decided to model the interaction between the ETS H1 domain and an ankyrin repeat motif observed in the crystal structure of the GABP α/β protein from mouse.40 One can observe in Figure 2A that the top 10 binding poses obtained with ClusPro2.0 are located in the area of the H1 helix of the ETS, except for one outlier (the eighth pose) which occupies a biologically irrelevant position as it is clashing with the DNA. Moreover, the superimposition between the best predicted complex and the crystal structure (Figure 2B) is almost perfect, with a calculated root‐mean‐square deviation (RMSD) on the Cα of 0.7 Å. This result reflects the ability of ClusPro2.0 to reproduce an experimental structure and clearly shows that our interaction models are in good agreement with a similar complex of ETS already described in the literature.40
Figure 2.

A, Top 10 docking poses, obtained by ClusPro2.0, of the ankyrin repeat motif (cyan spheres) and the ETS H1 domain (H1 is colored in orange while the rest of the ETS domain is in wheat color). One outlier (red circled sphere) is clashing with the DNA. B, Superimposition of the best predicted model (wheat—cyan) and the crystal structure of the GABP α/β protein from mouse (blue) (calculated RMSD of 0.7 Å)
We then superimposed the conformations presented in Figure 1 and extracted a putative interaction surface. The interacting region on the ETS domain involves a hydrophobic cluster, composed of aromatic residues Trp338, Trp356, and Trp361 and aliphatic amino acid Leu342 (Figure 3). The sequence alignment produced by Muscle (default parameters)41 and presented in Figure 4 shows that these residues are mostly conserved within the H. sapiens ETS family. Indeed, W356 is fully conserved while the hydrophobic characteristics of W338 and L342 are kept. W361 is usually replaced by an aliphatic glycine in the major cases. In addition to the hydrophobic patch, a glutamine (Gln339) is identified which interacts with ETS partners through hydrogen bonds.
Figure 3.

Detailed view of the interacting residues of the ETS/BRCT (A) and ETS/SAP (B) interfaces. Trp338 and Trp361 of ETS are buried in a hydrophobic cavity formed by Pro10, Leu11 and Leu90 of BRCT, while Gln339 is H‐bonded to Glu105 (A). Similar interactions are observed for the SAP domain (B). The hydrophobic cavity there consists of Tyr76, His94 and Phe95, while Glu105 is replaced by Glu49
Figure 4.

Sequence alignment of the ETS protein domains for the ETS Homo sapiens family. Alignment produced with Muscle, default parameters. Visualization is done with Jalview, residues are colored following Clustal X criteria [Color figure can be viewed at http://wileyonlinelibrary.com]
From the interacting partners’ point of view, all the solutions are located between H1 and the β‐strands S1 and S2. For both protein partners, we find Trp338 and Trp361 of ETS to be buried in a hydrophobic cavity formed by Pro10, Leu11, and Leu90 for BRCT (Figure 3A), and by Tyr76, His94, and Phe95 for SAP (Figure 3B). The conserved Gln339 of ETS is in both cases H‐bonded to a glutamic acid (Glu105 for BRCT and Glu49 for SAP). These docking predictions all leave room for binding to DNA.
3.2. Evaluation of identified hot spots at the interaction interface
Conformational flexibility is often a problematic factor in protein‐protein docking, preventing the identification of suitable solutions.42 In order to consider the possible impact of conformational flexibility at the interacting surface, we performed a 20‐ns molecular dynamics simulation of the ETS domain. We found that the global fold of the protein was conserved throughout the simulation, even though the inhibitory domains had been removed, thus exposing the hydrophobic patch to the solvent. We then performed a cluster analysis on the trajectory modifying parameters such that the five first clusters covered more than 90% of the conformational space. Subsequently, we docked again our interacting partners BRCT and SAP with the corresponding five representative structures of the ETS domain. As in the previous docking computations, all the docked structures were located around the H1 helix (only ClusPro2.0 was used). We also extracted the same hydrophobic cluster, but found an additional aromatic residue, namely Phe363, to participate in the binding.
In order to further explore the binding mode, we performed a residue centrality analysis (RCA) on the residue interaction networks (RINs) calculated from the top 10 docked complexes of both the ETS/BRCT (Ets‐1/PARP‐1) (Figure 5A) and the ETS/SAP (Ets‐1/Ku70) binding modes (Figure S2). One of the features of a RCA is that it can identify residues that are central to the structural integrity and play key roles in long‐range interactions. These residues have been shown to be important for protein function, fold or allosteric communication.32, 33, 43, 44, 45 We have focused our attention on the residues of Ets‐1 and considered as central those with a z score ≥ 2 (Table 1). Since the calculations have been performed on the structures of the complexes, we can therefore consider the residues on ETS emerging from these calculations to be important for the structural integrity of either the individual domain or the complex as a whole. The analysis produces a list of 8 residues, 5 of which, Trp361, Leu342, Gln339, Trp338 and Trp356, are located in the protein‐protein interface and which we therefore consider to be important to the binding (Figure 5B). The remaining 3 residues, Tyr412, Glu362, and Pro334, are only found to interact with other residues of the ETS domain. The complete tables with the details of the central residues obtained for each of the 10 docking models are given in the Supplementary Material (Table S1). A similar analysis was performed on the ETS domain alone. Here we found Tyr412 to be central while Trp361, Leu342, Gln339, Trp338, and Trp356 were not highlighted by this analysis (see Figure S3). From this result, we can conclude that Tyr412 is involved in the folding of the ETS domain and is not part of the interaction. Indeed, the phenol moiety of Tyr412 is forming a hydrogen bond with the side chain of Tyr386, also identified as central through this analysis. This interaction directly stabilizes the conformation of the helix H3, which is involved in the DNA binding. Regarding Glu362 and Pro334, they seem to have nonspecific interactions.
Figure 5.

A, A representative residue interaction network (RIN) from the modeled complexes. Amino acids of the ETS domain with a z score ≥ 2 are considered central and have been colored on a continuous scale, from yellow (2) to red (≥ 4). Here, only central residues at the interaction surface are kept. B, Structural 3D representation of the 2D residue interaction network [Color figure can be viewed at http://wileyonlinelibrary.com]
Table 1.
Best residues of ETS emerging from residue centrality analyses (RCA) calculated on the top 10 docked complexes of the ETS/BRCT and ETS/SAP interactions
| ETS/BRCT | ETS/SAP | ||
|---|---|---|---|
| Residue | Total | Total | Sum |
| Tyr412 | 4 | 10 | 14 |
| Trp361 | 7 | 5 | 12 |
| Leu342 | 5 | 7 | 12 |
| Gln339 | 3 | 6 | 9 |
| Glu362 | 4 | 2 | 6 |
| Trp338 | 3 | 3 | 6 |
| Pro334 | 2 | 3 | 5 |
| Trp356 | 2 | 2 | 4 |
Values correspond to the sum of each occurrence of each amino acid presenting a z score ≥ 2 in the 10 RCA. Only residues that came out from the RCA of both complexes and with a sum ≥2 were considered as hot spots. From these residues, five (gray background), Trp361, Leu342, Gln339, Trp338, and Trp356, are located at the protein‐protein interface. The other residues interact with the ETS domain only.
As mentioned previously, these five residues form a hydrophobic patch which is unlikely to be solvent‐exposed in solution. The ETS domain of Ets‐1 has been crystallized in complex with transcription factors GABPαβ40 and RUNX1.46 These structures, as well as homodimers of different proteins of the ETS family (Fev, Elk1, and Etv1),47 also show the hydrophobic patch to be shielded from the solvent through the interaction with its partners or itself. Moreover, the monomeric structure of ETS (PDB ID: 1GVJ) shows the two inhibitory domains to fold back onto this area, thus protecting the patch from any solvent exposure. This is illustrated in Figure 6.
Figure 6.
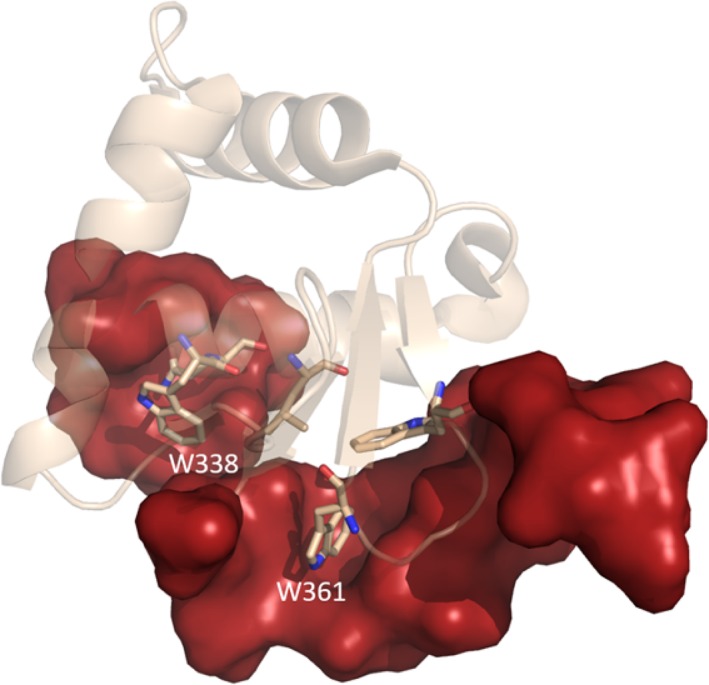
Monomeric, unbound form of the ETS domain (PDB ID: 1GVJ). The identified hotspots are shown in stick model. Major residues of the hydrophobic patch, notably W338 and W361, are protected from solvent by the inhibitory sequence stretches (red surfaces) [Color figure can be viewed at http://wileyonlinelibrary.com]
In an effort to quantify the stabilizing effect of each identified hot spot, we calculated the per‐residue destabilizing effect on the ΔΔGbinding through computational alanine scanning, applied to the complexes used for the RCA calculations. The complete tables with the details of the alanine scanning are given in the Supplementary Material (Table S2). As for the RCA, we analyzed only the residues of Ets‐1 and we considered this time as hotspots of those residues that show an average ΔΔGbinding ≥ 1 kcal mol−1. The results are listed in Table 2, which evidences that the alanine scanning analysis highlights the same residues as the RCA calculation. The notable exception is Leu342, however it should be kept in mind that the physicochemical properties of leucine and alanine are similar. We therefore decided to retain Leu342 in the list. The interaction interface from our docking model was rationalized by both the residue network and alanine scanning approaches but is also in good agreement with the literature, namely the presence of a hydrophobic patch that must be prevented to be solvent exposed. All these considerations added poise to our interacting models and subsequently, we decided to model a five‐point mutant ETS domain (5x mutant), where all five interacting residues were mutated into alanine (W338A/Q339A/L342A/W356A/W361A). Molecular dynamics simulations were performed on the wild type (wt) and the five‐point mutant in order to detect any changes in the stability of the 5x mutant. Both systems were simulated for 50 ns and we calculated the distribution of root‐mean‐square deviation (RMSD) over the last 40 ns.
Table 2.
Computational alanine scanning on the 10 ETS/BRCT and ETS/SAP models
| BRCT | SAP | |||
|---|---|---|---|---|
| Residue | Count | <ΔΔGbinding> (kcal mol−1) | Count | <ΔΔGbinding> (kcal mol−1) |
| Trp361 | 10 | 4.3 | 10 | 3.4 |
| Trp338 | 10 | 2.4 | 10 | 2.9 |
| Trp356 | 7 | 2.5 | / | / |
| Gln339 | 5 | 1.8 | 6 | 1.6 |
| Leu342 | 10 | 0.8 | 7 | 1.2 |
Listed are the residues, the number of times these residues were identified as hot spots for each of the 10 modeled complexes, and the average difference in free energy of binding.
Figure 7 shows the RMSD of the wt and the 5x complexes. One can readily see the shift in RMSD between the wt (black curve) and the 5x mutant (blue curve), indicating that the complex moves away from its starting configuration. This is not due to structural instability of the individual domains, as is indicated by the red (BRCT) and green (ETS) curves of the inset, which showed for the last 40 ns of the simulations a consistent but small fluctuation of RMSD values around an average value. The RMSD curves of the individual subunits of the complexes do show a slight increase in mean values for the smaller ETS domain, which can be rationalized by its attempt to correct an imperfect binding situation. The larger BRCT domain shows similar RMSD values between wt and 5x mutant. Altogether, this means that the ETS/BRCT complex has lost stabilization and has been moved away from its original binding mode.
Figure 7.
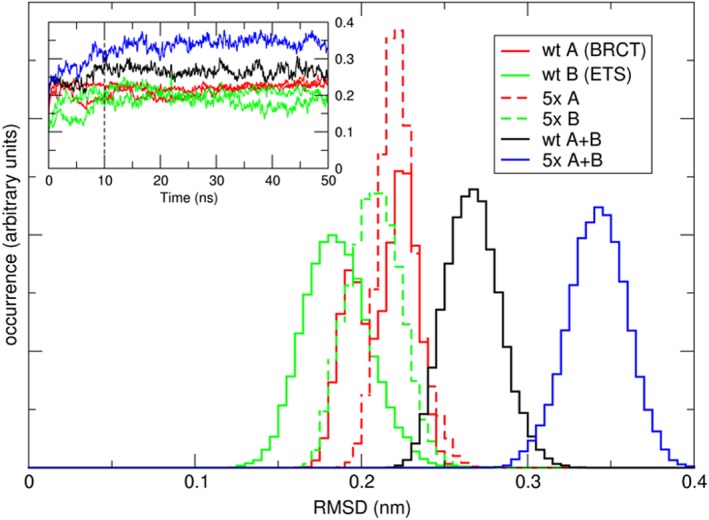
RMSD for two 50 ns MD simulations of the wt and 5x complexes. The inset shows the RMSD evolution during the course of the simulation, the main graph shows the normalized occurrence (distribution) of RMSD values as calculated over the last 40 ns of the simulations [Color figure can be viewed at http://wileyonlinelibrary.com]
4. DISCUSSION
In this article, we focused on the recognition between Ets‐1 and two established protein partners, PARP‐1 and DNA‐PK, through their identified interacting domains, these being ETS for Ets‐1, and BRCT and SAP for PARP‐1 and DNA‐PK, respectively. Using protein‐protein docking calculations, we determined that the interaction centers on the ETS α‐helix H1 (residues 337‐346). This postulate is corroborated by existing crystallographic structures of the GABPαβ/Ets‐140 and RUNX1/Ets‐146 complexes as well as homodimers of different proteins of ETS family (Fev, Elk1 and Etv1).47 The identified surface, centered on α‐helix H1, was rationalized by means of residue centrality analyses, computational alanine scanning, and molecular dynamics simulation. Based on these results, we isolated three tryptophans (Trp338, Trp356, and Trp361), a leucine (Leu342), and a glutamine (Gln339) as binding hotspots. Indeed, as shown in Figure 4, Trp 356 is strictly conserved in all ETS domains through the entire family for H. sapiens, while the hydrophobic characteristics of Trp338 and Leu342 are mostly conserved. These largely conserved hydrophobic residues create a hydrophobic patch on Ets‐1. Such a hydrophobic pattern, and more specifically the presence of several tryptophans, is common in protein‐protein interaction surfaces (see for examples refs 48, 49, 50, 51, 52, 53). Twenty years ago, Nussinov et al. performed a statistical analysis of the hydrophobic effect in protein‐protein interaction. They concluded that the hydrophobic effect plays a dominant role in protein‐protein binding as such exposed patches would be unfavorable for the unassociated monomers in solution.54 This statement was corroborated in 2010 by Guharoy et al in a study of the occurrence of clusters of conserved residues at protein‐protein interfaces. In their study, they analyzed 122 homodimers and 204 heterocomplexes and it came out that for both types of complexes, hydrophobic (Val, Leu, Ile, Met) and aromatic (Tyr, Phe Trp) residues were found to be preferred in such clusters.55 Moreover, Sanchez et al... characterized tryptophan‐lipid interactions that can also be extrapolated to tryptophan‐protein interactions.56
In our case, the hydrophobic patch of the ETS domain is in its solution structure flanked by two inhibitory domains at both N‐ and C‐terminals.3 In the unbound ETS domain, which corresponds to the closed and inactive form of the domain, these segments protect these five residues from the solvent. In this conformation, α‐helix H1 is shielded from the bulk solvent by the autoinhibitory domains (see Figure 6), and cannot interact with any binding partners.
As shown by Lee et al., the binding of the inhibitory sequences to H1 is weak and easily destabilized.3 This is compatible with a competitive binding model where an interacting partner can displace these inhibitory segments and bind the ETS domain. Indeed, in a hypothetically opened conformation, the identified hydrophobic patch would be solvent exposed (solvent‐accessible surface area [SASA]: 403 Å2 compared to a SASA of 77 Å2 when shielded), and thus unstable. This fact was encountered by Baillat et al. when a series of Ets‐1 deletion mutants were designed in order to study its binding to palindromic DNA. They overexpressed 6 proteins but all needed to present at least one inhibitory domain in order to be stable; the sequence for the ETS domain without any inhibitory patches was also obtained, but the protein never expressed.39 Altogether, one can imagine that the switch between the closed and the opened conformations is triggered by the interaction with protein partners, instantly masking the revealed hydrophobic patch.
Furthermore, Cooper et al. recently confirmed that interaction of the ETS domain with DNA occurs through its α‐helix H3 as they crystallized the ETS domain of 4 members of the Ets family (Etv1, Etv4, Etv5, and Fev) in complex with DNA.57 All these crystallographic structures demonstrated that the DNA binding did not involve the α‐helix H1 which allows ETS to bind both a protein partner as well as DNA simultaneously. Our model is thus in good agreement with the hypothesis that Ets‐1 must be activated by a protein partner in order to start its transcription factor activity.
The occurrence of an ETS domain is what defines the family of Ets transcription factors, which are involved in several important physiological processes. The identification of an interaction between Ets‐1 and DNA‐repair proteins has far‐reaching consequences. Thus, interactions of Ets‐1 with DNA‐repair enzymes have been shown to be important for cancer progression. Indeed, PARP‐1 is responsible for PARylation of Ets‐1. PARylation is a signaling mechanism involved in cellular processes, including DNA repair and apoptosis. We know from previous studies11 that inhibition of PARP‐1 leads to non‐ubiquitinated Ets‐1 that accumulates in the cell with an increase of its transcriptional activity. It also leads to a drastic increase in DNA damage, associated with 70% cell death. Indeed, the DNA‐repair enzyme PARP‐1 is able to repair single‐stranded DNA (ssDNA) breaks. When PARP‐1 is inhibited, this repair mechanism is hampered and cumulated DNA damage will ultimately lead to cell death. However, during replication, ssDNA breaks become double‐stranded DNA (dsDNA) breaks, which require other repair mechanisms such as the nonhomologous end‐joining pathway. This mechanism involves DNA‐PK, which interacts with Ets‐1 through its Ku70 subunit. Consequently, the survival of cancerous cells treated with PARP‐1 inhibitors could be explained by the recruitment by Ets‐1 of dsDNA‐repair enzymes like DNA‐PK.
In summary, we have previously shown that Ets‐1 interacts with two different DNA‐repair enzymes. Here we provide a three‐dimensional model of these interactions, with a rationalization of the binding modes, which highlight the same interaction interface on Ets‐1. Arguably, Ets‐1 could then recruit additional partners or transcription factors through the same binding mechanism. It therefore seems of great interest to identify new partners of the Ets‐1 protein, namely proteins carrying domains homologous to BRCT or SAP, and characterize their interaction with ETS. This article reflects a first, but important step, in this characterization. We, here, described the molecular details of the interaction between Ets‐1 and two DNA‐repair enzymes DNA‐PK and PARP‐1. This will help to further understand the underlying protein recognition mechanisms, shed light on the involvement of the Ets transcription factor family in cancer progression and might contribute to the design of inhibitors of these interactions.
Supporting information
Figure S1: Crystal structure of GABP α/β protein (1AWC). ETS domain (orange) interacts with the Ankyrin motif (blue) of the complex through α‐helix H1. The auto‐inhibitory domain is represented in red.
Figure S2: A) A representative residue interaction network (RIN) from the modeled complexes. Amino acids of ETS domain with a z score ≥ 2 are considered central (colored yellow (2) to red (≥ 4)) B) Representation of the central residues (Orange sticks), identified from the residue centrality analysis, which are involved in the interacting surface. Tyr412, Glu362 and Pro334 (Wheat sticks) interact only with ETS residues.
Figure S3: A representative residue interaction network (RIN) from the unbound form of the ETS domain. Amino acids of the ETS domain with a z score ≥ 2 are considered central and have been colored on a continuous scale, from yellow (2) to red (≥ 4). Only Tyr412 is considered as central while Trp361, Leu342, Gln339, Trp338 and Trp356 were not highlighted by this analysis.
Table S1: Complete tables with the details of the central residues obtained for each of the 20 docking models
Table S2: Complete tables with the details of the alanine scanning obtained for each of the 10 docking models of ETS/BRCT
ACKNOWLEDGMENTS
We acknowledge support from the Research Federation “Structural & Functional Biochemistry of Biomolecular Assemblies” CNRS FR3688 FRABio. JdR acknowledges funding from the Nord‐Pas‐de‐Calais Regional Council. This work was supported in part by grants from la Ligue contre le Cancer, Comité du Pas‐de‐Calais.
de Ruyck J, Brysbaert G, Villeret V, Aumercier M, Lensink MF. Computational characterization of the binding mode between oncoprotein Ets‐1 and DNA‐repair enzymes. Proteins. 2018;86:1055–1063. 10.1002/prot.25578
Funding information Comité du Pas‐de‐Calais; Ligue contre le Cancer; Nord‐Pas‐de‐Calais Regional Council
REFERENCES
- 1. Dittmer J. The role of the transcription factor Ets1 in carcinoma. Semin Cancer Biol. 2015;35:20‐38. [DOI] [PubMed] [Google Scholar]
- 2. Grishin AV, Alekseevskii AV, Spirin SA, Kariagin AS. Conserved structural features of ETS domain‐‐DNA complexes. Mol Biol (Mosk). 2009;43(4):666‐674. [PubMed] [Google Scholar]
- 3. Lee GM, Donaldson LW, Pufall MA, et al. The structural and dynamic basis of Ets‐1 DNA binding autoinhibition. J Biol Chem. 2005;280(8):7088‐7099. [DOI] [PubMed] [Google Scholar]
- 4. Dittmer J, Nordheim A. Ets transcription factors and human disease. Biochim Biophys Acta. 1998;1377(2):F1‐F11. [DOI] [PubMed] [Google Scholar]
- 5. Redlich K, Kiener HP, Schett G, et al. Overexpression of transcription factor Ets‐1 in rheumatoid arthritis synovial membrane: regulation of expression and activation by interleukin‐1 and tumor necrosis factor alpha. Arthritis Rheum. 2001;44(2):266‐274. [DOI] [PubMed] [Google Scholar]
- 6. Raffetseder U, Wernert N, Ostendorf T, et al. Mesangial cell expression of proto‐oncogene Ets‐1 during progression of mesangioproliferative glomerulonephritis. Kidney Int. 2004;66(2):622‐632. [DOI] [PubMed] [Google Scholar]
- 7. Zhan Y, Brown C, Maynard E, et al. Ets‐1 is a critical regulator of Ang II‐mediated vascular inflammation and remodeling. J Clin Invest. 2005;115(9):2508‐2516. [DOI] [PMC free article] [PubMed] [Google Scholar]
- 8. Dittmer J. The biology of the Ets1 proto‐oncogene. Mol Cancer. 2003;2:29. [DOI] [PMC free article] [PubMed] [Google Scholar]
- 9. Laitem C, Choul‐Li S, Baillat D, Begue A, Aumercier M. Efficient system for biotinylated recombinant Ets‐1 production in Escherichia coli: a useful tool for studying interactions between Ets‐1 and its partners. Protein Expr Purif. 2008;62(1):53‐63. [DOI] [PubMed] [Google Scholar]
- 10. Choul‐li S, Drobecq H, Aumercier M. DNA‐dependent protein kinase is a novel interaction partner for Ets‐1 isoforms. Biochem Biophys Res Commun. 2009;390(3):839‐844. [DOI] [PubMed] [Google Scholar]
- 11. Legrand AJ, Choul‐Li S, Spriet C, et al. The level of Ets‐1 protein is regulated by poly(ADP‐ribose) polymerase‐1 (PARP‐1) in cancer cells to prevent DNA damage. PLoS One. 2013;8(2):e55883. [DOI] [PMC free article] [PubMed] [Google Scholar]
- 12. Legrand AJ. Identification de nouveaux partenaires protéiques de l'oncoprotéine Ets‐1 et étude de sa régulation par l'enzyme de réparation de l'ADN PARP‐1 au sein des cellules tumorales. Lille, France: Université du Droit et de la Santé ‐ Lille II; 2013. [Google Scholar]
- 13. Comeau SR, Gatchell DW, Vajda S, Camacho CJ. ClusPro: a fully automated algorithm for protein‐protein docking. Nucleic Acids Res. 2004;32(Web Server issue:W96‐W99. [DOI] [PMC free article] [PubMed] [Google Scholar]
- 14. Comeau SR, Gatchell DW, Vajda S, Camacho CJ. ClusPro: an automated docking and discrimination method for the prediction of protein complexes. Bioinformatics. 2004;20(1):45‐50. [DOI] [PubMed] [Google Scholar]
- 15. Pierce BG, Wiehe K, Hwang H, Kim BH, Vreven T, Weng Z. ZDOCK server: interactive docking prediction of protein‐protein complexes and symmetric multimers. Bioinformatics. 2014;30(12):1771‐1773. [DOI] [PMC free article] [PubMed] [Google Scholar]
- 16. Jimenez‐Garcia B, Pons C, Fernandez‐Recio J. pyDockWEB: a web server for rigid‐body protein‐protein docking using electrostatics and desolvation scoring. Bioinformatics. 2013;29(13):1698‐1699. [DOI] [PubMed] [Google Scholar]
- 17. Yu J, Vavrusa M, Andreani J, Rey J, Tuffery P, Guerois R. InterEvDock: a docking server to predict the structure of protein‐protein interactions using evolutionary information. Nucleic Acids Res. 2016;44(W1):W542‐W549. [DOI] [PMC free article] [PubMed] [Google Scholar]
- 18. Lensink MF, Velankar S, Wodak SJ. Modeling protein‐protein and protein‐peptide complexes: CAPRI 6th edition. Proteins. 2017;85(3):359‐377. [DOI] [PubMed] [Google Scholar]
- 19. Kozakov D, Brenke R, Comeau SR, Vajda S. PIPER: an FFT‐based protein docking program with pairwise potentials. Proteins. 2006;65(2):392‐406. [DOI] [PubMed] [Google Scholar]
- 20. Berendsen HJC, Postam JP, Van Gunsteren WF, Hermans J. In: Pullman B, ed. Intermolecular Forces. Dordrecht, The Netherlands: Reidel; 1981:31‐342. [Google Scholar]
- 21. Hess B, Kutzner C, van der Spoel D, Lindahl E. GROMACS 4: algorithms for highly efficient, load‐balanced, and scalable molecular simulation. J Chem Theory Comput. 2008;4:435‐447. [DOI] [PubMed] [Google Scholar]
- 22. Van Gunsteren WF, Billeter SR, Eising AA, Hünenberger PH, Krüger P, Mark AE, Scott WR, Tironi IG. Biomolecular simulation: the GROMOS96 manual and user guide. Hochschulverlag AG an der ETH Zürich; Zürich, Switzerland; 1996. [Google Scholar]
- 23. Bussi G, Donadio D, Parrinello M. Canonical sampling through velocity rescaling. J Chem Phys. 2007;126:014101. [DOI] [PubMed] [Google Scholar]
- 24. Essman U, Perela L, Berkowitz ML, Darden T, Lee H, Pedersen LG. A smooth particle mesh Ewald method. J Chem Phys. 1995;103:8577‐8592. [Google Scholar]
- 25. Miyamoto S, Kollman PA. SETTLE: an analytical version of the SHAKE and RATTLE algorithms for rigid water models. J Comput Chem. 1992;13:952‐962. [Google Scholar]
- 26. Hess B. P‐LINCS: a parallel linear constraint solver for molecular simulation. J Chem Theory Comput. 2008;4:116‐122. [DOI] [PubMed] [Google Scholar]
- 27. Feenstra KA, Hess B, Berendsen HJC. Improving efficiency of large time‐scale molecular dynamics simulations of hydrogen‐rich systems. J Comput Chem. 1999;20:786‐798. [DOI] [PubMed] [Google Scholar]
- 28. Daura K, Gademann K, Jaun B, Seebach D, Van Gunsteren WF, Mark AE. Peptide folding: when simulation meets experiment. Angewandte Chemie Int Ed. 1999;38:236‐240. [Google Scholar]
- 29. Pettersen EF, Goddard TD, Huang CC, et al. UCSF chimera‐‐a visualization system for exploratory research and analysis. J Comput Chem. 2004;25(13):1605‐1612. [DOI] [PubMed] [Google Scholar]
- 30. Shannon P, Markiel A, Ozier O, et al. Cytoscape: a software environment for integrated models of biomolecular interaction networks. Genome Res. 2003;13(11):2498‐2504. [DOI] [PMC free article] [PubMed] [Google Scholar]
- 31. Morris JH, Huang CC, Babbitt PC, Ferrin TE. structureViz: linking Cytoscape and UCSF chimera. Bioinformatics. 2007;23(17):2345‐2347. [DOI] [PubMed] [Google Scholar]
- 32. del Sol A, Fujihashi H, Amoros D, Nussinov R. Residues crucial for maintaining short paths in network communication mediate signaling in proteins. Mol Syst Biol. 2006;2:2006.0019. [DOI] [PMC free article] [PubMed] [Google Scholar]
- 33. Brysbaert G, Lorgouilloux K, Vranken W, Lensink MF. RINspector: a Cytoscape app for centrality analyses and DynaMine flexibility prediction. Bioinformatics. 2017. doi: 10.1093/bioinformatics/btx586. [DOI] [PMC free article] [PubMed] [Google Scholar]
- 34. Kortemme T, Kim DE, Baker D. Computational alanine scanning of protein‐protein interfaces. Sci STKE. 2004;2004(219):l2. [DOI] [PubMed] [Google Scholar]
- 35. Kortemme T, Baker D. A simple physical model for binding energy hot spots in protein‐protein complexes. Proc Natl Acad Sci USA. 2002;99(22):14116‐14121. [DOI] [PMC free article] [PubMed] [Google Scholar]
- 36. Lensink MF, Wodak SJ. Blind predictions of protein interfaces by docking calculations in CAPRI. Proteins. 2010;78(15):3085‐3095. [DOI] [PubMed] [Google Scholar]
- 37. Lensink MF, Wodak SJ. Docking, scoring, and affinity prediction in CAPRI. Proteins. 2013;81(12):2082‐2095. [DOI] [PubMed] [Google Scholar]
- 38. de Ruyck J, Brysbaert G, Blossey R, Lensink MF. Molecular docking as a popular tool in drug design, an in silico travel. Adv Appl Bioinform Chem. 2016;9:1‐11. [DOI] [PMC free article] [PubMed] [Google Scholar]
- 39. Baillat D, Laitem C, Leprivier G, Margerin C, Aumercier M. Ets‐1 binds cooperatively to the palindromic Ets‐binding sites in the p53 promoter. Biochem Biophys Res Commun. 2009;378(2):213‐217. [DOI] [PubMed] [Google Scholar]
- 40. Batchelor AH, Piper DE, de la Brousse FC, McKnight SL, Wolberger C. The structure of GABPalpha/beta: an ETS domain‐ ankyrin repeat heterodimer bound to DNA. Science (New York, NY). 1998;279(5353):1037‐1041. [DOI] [PubMed] [Google Scholar]
- 41. Edgar RC. MUSCLE: multiple sequence alignment with high accuracy and high throughput. Nucleic Acids Res. 2004;32(5):1792‐1797. [DOI] [PMC free article] [PubMed] [Google Scholar]
- 42. Lensink MF, Mendez R. Recognition‐induced conformational changes in protein‐protein docking. Curr Pharm Biotechnol. 2008;9(2):77‐86. [DOI] [PubMed] [Google Scholar]
- 43. Amitai G, Shemesh A, Sitbon E, et al. Network analysis of protein structures identifies functional residues. J Mol Biol. 2004;344(4):1135‐1146. [DOI] [PubMed] [Google Scholar]
- 44. Hu G, Yan W, Zhou J, Shen B. Residue interaction network analysis of Dronpa and a DNA clamp. J Theor Biol. 2014;348:55‐64. [DOI] [PubMed] [Google Scholar]
- 45. Sheftel S, Muratore KE, Black M, Costanzi S. Graph analysis of beta2 adrenergic receptor structures: a "social network" of GPCR residues. In Silico Pharmacol. 2013;1:16. [DOI] [PMC free article] [PubMed] [Google Scholar]
- 46. Shrivastava T, Mino K, Babayeva ND, Baranovskaya OI, Rizzino A, Tahirov TH. Structural basis of Ets1 activation by Runx1. Leukemia. 2014;28(10):2040‐2048. [DOI] [PMC free article] [PubMed] [Google Scholar]
- 47. Cooper CD, Newman JA, Gileadi O. Recent advances in the structural molecular biology of Ets transcription factors: interactions, interfaces and inhibition. Biochem Soc Trans. 2014;42(1):130‐138. [DOI] [PMC free article] [PubMed] [Google Scholar]
- 48. Harel M, Kleywegt GJ, Ravelli RB, Silman I, Sussman JL. Crystal structure of an acetylcholinesterase‐fasciculin complex: interaction of a three‐fingered toxin from snake venom with its target. Structure. 1995;3(12):1355‐1366. [DOI] [PubMed] [Google Scholar]
- 49. Katz BA. Binding to protein targets of peptidic leads discovered by phage display: crystal structures of streptavidin‐bound linear and cyclic peptide ligands containing the HPQ sequence. Biochemistry. 1995;34(47):15421‐15429. [DOI] [PubMed] [Google Scholar]
- 50. Perraut C, Clottes E, Leydier C, Vial C, Marcillat O. Role of quaternary structure in muscle creatine kinase stability: tryptophan 210 is important for dimer cohesion. Proteins. 1998;32(1):43‐51. [DOI] [PubMed] [Google Scholar]
- 51. Staub O, Rotin D. WW domains. Structure. 1996;4(5):495‐499. [DOI] [PubMed] [Google Scholar]
- 52. Zeltins A, Schrempf H. Specific interaction of the Streptomyces chitin‐binding protein CHB1 with alpha‐chitin‐‐the role of individual tryptophan residues. Eur J Biochem. 1997;246(2):557‐564. [DOI] [PubMed] [Google Scholar]
- 53. Tonddast‐Navaei S, Skolnick J. Are protein‐protein interfaces special regions on a protein's surface? J Chem Phys. 2015;143(24):243149. [DOI] [PMC free article] [PubMed] [Google Scholar]
- 54. Tsai CJ, Lin SL, Wolfson HJ, Nussinov R. Studies of protein‐protein interfaces: a statistical analysis of the hydrophobic effect. Protein Sci. 1997;6(1):53‐64. [DOI] [PMC free article] [PubMed] [Google Scholar]
- 55. Guharoy M, Chakrabarti P. Conserved residue clusters at protein‐protein interfaces and their use in binding site identification. BMC Bioinformatics. 2010;11:286. [DOI] [PMC free article] [PubMed] [Google Scholar]
- 56. Sanchez KM, Kang G, Wu B, Kim JE. Tryptophan‐lipid interactions in membrane protein folding probed by ultraviolet resonance Raman and fluorescence spectroscopy. Biophys J. 2011;100(9):2121‐2130. [DOI] [PMC free article] [PubMed] [Google Scholar]
- 57. Shiina M, Hamada K, Inoue‐Bungo T, et al. A novel allosteric mechanism on protein‐DNA interactions underlying the phosphorylation‐dependent regulation of Ets1 target gene expressions. J Mol Biol. 2015;427(8):1655‐1669. [DOI] [PubMed] [Google Scholar]
Associated Data
This section collects any data citations, data availability statements, or supplementary materials included in this article.
Supplementary Materials
Figure S1: Crystal structure of GABP α/β protein (1AWC). ETS domain (orange) interacts with the Ankyrin motif (blue) of the complex through α‐helix H1. The auto‐inhibitory domain is represented in red.
Figure S2: A) A representative residue interaction network (RIN) from the modeled complexes. Amino acids of ETS domain with a z score ≥ 2 are considered central (colored yellow (2) to red (≥ 4)) B) Representation of the central residues (Orange sticks), identified from the residue centrality analysis, which are involved in the interacting surface. Tyr412, Glu362 and Pro334 (Wheat sticks) interact only with ETS residues.
Figure S3: A representative residue interaction network (RIN) from the unbound form of the ETS domain. Amino acids of the ETS domain with a z score ≥ 2 are considered central and have been colored on a continuous scale, from yellow (2) to red (≥ 4). Only Tyr412 is considered as central while Trp361, Leu342, Gln339, Trp338 and Trp356 were not highlighted by this analysis.
Table S1: Complete tables with the details of the central residues obtained for each of the 20 docking models
Table S2: Complete tables with the details of the alanine scanning obtained for each of the 10 docking models of ETS/BRCT