Abstract
The design of a biomimetic and fully base metal photocatalytic system for photocatalytic proton reduction in a homogeneous medium is described. A synthetic pyridylphosphole‐appended [FeFe] hydrogenase mimic was encapsulated inside a supramolecular zinc porphyrin‐based metal–organic cage structure Fe4(Zn‐L)6. The binding is driven by the selective pyridine–zinc porphyrin interaction and results in the catalyst being bound strongly inside the hydrophobic cavity of the cage. Excitation of the capsule‐forming porphyrin ligands with visible light while probing the IR spectrum confirmed that electron transfer takes place from the excited porphyrin cage to the catalyst residing inside the capsule. Light‐driven proton reduction was achieved by irradiation of an acidic solution of the caged catalyst with visible light.
Keywords: cage compounds, enzyme models, host–guest systems, iron, photochemistry
Introduction
Molecular hydrogen is a viable alternative to fossil fuels when produced sustainably, for example, through photocatalytic water splitting. Platinum and other noble metals act as highly efficient heterogeneous hydrogen evolution catalysts, but their limited availability prevents large‐scale applications.1 In nature, [FeFe] hydrogenase enzymes catalyze the reduction of protons at high rates of 9000 s−1 and overpotentials close to the thermodynamic limit with exclusively base metals in their structure.2 The vast amount of research that has been dedicated to mimicking the structure and/or function of the active site has led to a large number of enzyme mimics for electro‐ and photocatalytic hydrogen production.3, 4
Of particular interest is the ability of the enzyme to preorganize protons and electrons in the vicinity of the active site. The active site consists of a [2 Fe–2 S] cluster that functions as the proton reduction catalyst, and it is connected through a cysteine residue to a [4 Fe–4 S] cluster, which in turn supplies electrons to the active site during catalysis.2 The two sulfur atoms of the [2 Fe–2 S] cluster are bridged by an amine functionality, which can be protonated and ensures a high local concentration of protons close to the active site, often referred to as “proton relay”. Importantly, all these processes occur within a protein structure protected from bulk solution.
To achieve photocatalytic proton reduction, three main components are required: a light‐harvesting photosensitizer, a proton reduction catalyst, and an electron donor.5 Absorption of visible light by the photosensitizer is followed by electron transfer to the catalyst, and the reducing equivalents are used for the reduction of protons to molecular hydrogen. The role of the sacrificial electron donor is to reduce the oxidized photosensitizer to allow for catalytic turnover. One of the challenges is to ensure that all three components come into close contact with each other to enable efficient catalysis, which is not trivial at the low concentrations typically applied in catalysis.6 Nature has already evolved a highly efficient solution to this problem through its sophisticated photosynthetic machinery. Confinement of the light‐harvesting antennae (porphyrins) and the [FeFe] catalyst in a shared protein matrix results in a catalytic system that exhibits high rates and nearly no overpotential in proton reduction catalysis.
Inspired by nature, supramolecular catalysis applies concepts of molecular encapsulation to organocatalysis and transition metal catalysis. Several examples of cage‐controlled catalysis have appeared in the literature in the past decades.7 The key is that the reactivity of the catalyst is altered on encapsulation in a synthetic cage‐like structure. This can result in higher catalytic rates, modified product or substrate selectivity, and stabilization of other species than in bulk solution.
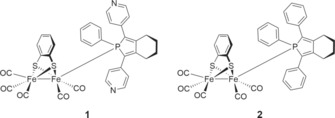
Keeping the pocket feature of natural hydrogenases in mind, we envisioned a purely synthetic photocatalytic system in which the [FeFe] catalyst is encapsulated in a supramolecular cage and thereby isolated from bulk solution. Some examples of using metal–organic frameworks,8 micelles, 3l and dendrimers 3l as second coordination spheres for photocatalytic proton reduction catalysis have been previously reported. These systems typically rely on the use of iridium polypyridyl‐based complexes as photosensitizer. The key dyes of natural photosynthesis (porphyrins and metal porphyrins), however, have received relatively little attention in this field.5, 9 Along these lines, we decided to use a porphyrin‐based supramolecular cage, developed by Nitschke et al.,10 as a second coordination sphere for the previously published pyridylphosphole‐appended [FeFe] hydrogenase mimic complex 1.11 The cage serves a dual role, as it site‐isolates the catalyst in addition to acting as the photosensitizer. Self‐assembled tetrahedral cage Fe4(Zn‐L)6 composed of six zinc porphyrin ligands connected by four iron(II) corners is soluble in organic solvents and has a sufficiently large cavity for selective encapsulation of 1 (Figure 1). On irradiation with visible light, the porphyrin cage transfers its photoexcited electron to the encapsulated catalyst, and formation of monoanion 1− is observed by transient IR measurements. The biomimetic base‐metal system was successfully applied in photocatalytic proton reduction catalysis leading to the evolution of molecular hydrogen in the presence of protons under visible‐light irradiation. Although the efficiency is rather low, this system, which contains only base metal ions, constitutes a working example of how supramolecular cages can be used in the combined function of second coordination sphere and photosensitizer.
Figure 1.
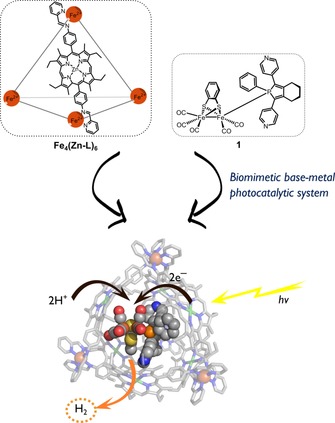
Concept of photocatalytic proton reduction catalysis by 1⋅Fe4(Zn‐L)6. Top left: Molecular structure of cage Fe4(Zn‐L)6. Top right: Molecular structure of [FeFe]hydrogenase mimic 1. Bottom: Concept of photoinduced electron transfer from the supramolecular cage to the encapsulated catalyst, followed by the reduction of protons to molecular hydrogen.
Results and Discussion
Molecular modeling of the host–guest complex
To confirm that complex 1 fits inside supramolecular cage Fe4(Zn‐L)6, the volumes of the complex and the empty cage were calculated with the online utility Voss Volume Voxelator12 (Figure 2). Complex 1 has a molecular volume of about 1000 Å3 and consequently fills 56 % of the cavity void. This is in good agreement with the 55 % occupancy rule proposed by Rebek and Mecozzi13 and verifies that the complex has the proper size for encapsulation.
Figure 2.
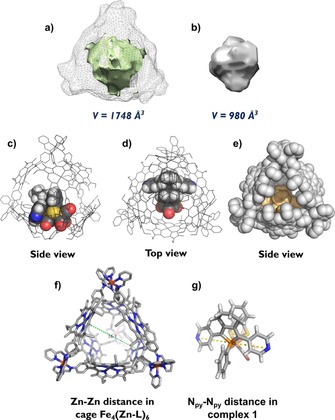
Results of the volume calculations performed with Voss Volume Voxelator and the molecular structure of modeled host–guest complex 1⋅Fe4(Zn‐L)6 showing two zinc porphyrin–pyridine interactions between 1 and the porphyrin walls of the cage. a) Calculated inner‐cavity volume (pale green) of empty cage Fe4(Zn‐L)6 in relation to the total volume of the cage displayed in gray mesh. b) Calculated volume of complex 1. c) Side view of the host–guest complex. d) Top view of the host–guest complex. e) Side view of the host–guest complex in space‐filling mode. f) The Zn⋅⋅⋅Zn distance in the empty cage. g) The Npy ⋅⋅⋅Npy distance in the free complex 1.
The orientation of the catalyst inside the cage was further studied by molecular modeling studies with the ADF software. The structure of complex 1 was extracted from the crystal structure of the previously crystallized complex RuTPP(CO)⋅1⋅RuTPP(CO).14 A nickel porphyrin analogue of the cage was earlier published by Nitschke et al.10 and its crystal structure was used as a starting point for the molecular modeling studies. Geometry optimization was performed with a tight‐binding chemical method (GFN‐xTB) that mimics DFT and was developed specifically for large molecular systems (for coordinates, see Supporting Information, Section 12).15 In the empty cage the largest Zn⋅⋅⋅Zn distance between two porphyrin ligands of the cage is around 17 Å, which is suitable for encapsulation of complex 1, in which the Npy ⋅⋅⋅Npy distance is around 11 Å (Figure 2 g). A typical distance for a Zn−Npy bond is 2.2 Å,16 which means that the complex has a suitable size for encapsulation, in line with volume calculations. When 1 is located at one side of the cavity, the tetrahedral symmetry of the cage is lost. Also, the effective window aperture size is 7.9 Å (taking account of van der Waals radii), which is smaller than 1, and thus the catalyst cannot freely diffuse in and out of the cage.
Analysis of the host–guest complex by CSI‐MS and 1H NMR spectroscopy
Having established that the size and geometry of 1 are suitable for encapsulation, we confirmed its inclusion in Fe4(Zn‐L)6 by HRMS. The host–guest complex was obtained by simple mixing of the cage and catalyst in 1:1 ratio in dry acetonitrile, which resulted in quantitative formation of 1⋅Fe4(Zn‐L)6. Cold‐spray ionization mass spectrometry (CSI‐MS) of a dilute solution of equimolar amounts of 1 and Fe4(Zn‐L)6 in dry acetonitrile yielded a clean spectrum with signals assigned only to the host–guest complex; signals belonging to the empty host were absent. Charge states of 8+, 7+, 6+, 5+, and 4+ are clearly visible and correspond to different numbers of CF3SO3 − counterions lost during ionization in the spectrometer. Some fragmentation was also observed, despite the low temperature of the measurement (−40 °C), as evident from a signal with m/z 661 corresponding to the demetallated porphyrin cage building block. The high resolution of the mass spectra allowed determination of the elemental composition. For each charge state the experimental and simulated isotope pattern match perfectly. The full spectrum along with the experimental and simulated isotope pattern for the 4+ species is shown in Figure 3 (for all experimental and simulated isotope patterns, see Supporting Information, Section 2).
Figure 3.
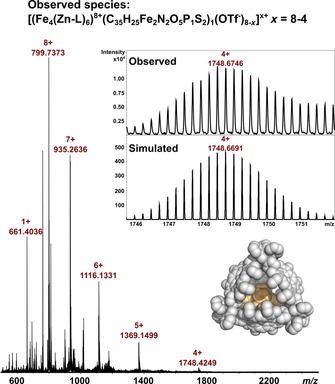
Full spectrum obtained from the CSI‐MS analysis of assembly 1⋅Fe4(Zn‐L)6 with an inset showing the experimental and simulated isotope pattern of the 4+ species. The signal with m/z of 661 belongs to demetallated porphyrin cage building block.
To gain further insight into the encapsulation of 1, we studied the host–guest complex by 1H NMR spectroscopy. Mixing of equimolar amounts of 1 and Fe4(Zn‐L)6 in deuterated acetonitrile under an inert atmosphere yielded a red‐dark purple solution, which was analyzed by 1H NMR spectroscopy. Broadening and shifts of all the cage peaks were evident (Supporting Information, Figures S7 and S8). In the host–guest complex, binding of the guest molecule breaks the tetrahedral symmetry of the cage and results in a desymmetrized spectrum and hence broadening of the signals. 2D 1H DOSY NMR spectroscopy of the solution gave a diffusion constant of 3.5×10⁻¹⁰ m2 s−1 for 1⋅Fe4(Zn‐L)6, which is comparable to that of 3.9×10⁻¹⁰ m2 s−1 obtained for the empty cage. Importantly, this experiment confirms that the host–guest complex has a similar size to the empty host and that diffusion of the host and guest are identical, in line with full encapsulation. The DOSY spectra of empty cage Fe4(Zn‐L)6 and 1⋅Fe4(Zn‐L)6 are shown in Figure 4.
Figure 4.
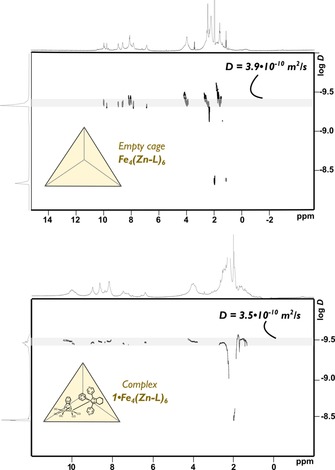
2D 1H DOSY spectra of empty cage Fe4(Zn‐L)6 with experimental diffusion constant of 3.9×10⁻¹⁰ m2 s−1 (top) and host–guest complex 1⋅Fe4(Zn‐L)6 with experimental diffusion constant of 3.5×10⁻¹⁰ m2 s−1 (bottom).
Determination of the binding constant of 1 to Fe4(Zn‐L)6
Next, we evaluated the binding strength of 1 to Fe4(Zn‐L)6 by UV/Vis titration in acetonitrile at 298 K. On coordination of 1 to Fe4(Zn‐L)6 the typical bathochromic shifts of both the Soret and Q bands of the porphyrin cage expected for axial pyridine binding to zinc porphyrins were observed (Figure 5).17 After addition of more than 1 equiv of guest, the isosbestic point at each Q band was lost. Such an inflection point in the titration curve indicates strong binding for the first guest, followed by a weaker binding event.18 A simple 1:1 binding model is therefore not an accurate description of this system. The obtained curves did not allow a reliable fit of a higher stoichiometry (1:3 up to 1:5), but a good fit was obtained with the equilibrium equation for 1:2 host–guest binding (for all fitting data, see Supporting Information, Section 4). The fitting yielded microscopic association constants of K 1=1.3×10⁵ m −1 and K 2=4.5×10⁴ m −1 for the two consecutive binding events: ditopic binding of one complex inside the cage followed by weaker monotopic binding at the outside of the cage. The binding constants have the same order of magnitude as those previously reported for bis(pyridyl)phosphine ligands in the same cage, that is, 1 is ditopically bound inside the cage.19
Figure 5.
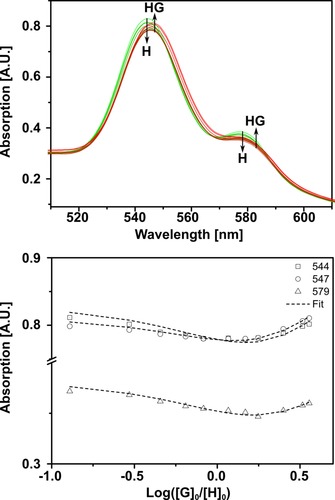
Binding titration between 1 and Fe4(Zn‐L)6 in acetonitrile at 298 K. Top: Overlay of UV/Vis spectra of the titration of Fe4(Zn‐L)6 (host) and 1 (guest) at a constant host concentration of 7.7 μm. Bottom: Variation in the absorption at the Q bands versus the logarithm of the equivalents of added guest.
Fluorescence quenching studies on the cage
Next we evaluated whether binding of 1 in Fe4(Zn‐L)6 indeed results in quenching of the porphyrin excited state by steady‐state fluorescence studies. On excitation at 550 nm, the empty cage exhibits two emission bands in the range 560–700 nm corresponding to S1→S0 transitions.20 The difference in energy of the absorption and emission peaks shows a small Stokes shift of 8 nm (Figure 6, top).21 This corresponds to the literature value for the Stokes shift of ZnIITPP in acetonitrile.20 On encapsulation of 1 in the cavity of the cage, the Stokes shift decreases to 5 nm, consistent with an increase in the rigidity of the cage structure when its void is filled with a guest (Figure 6, bottom).22
Figure 6.
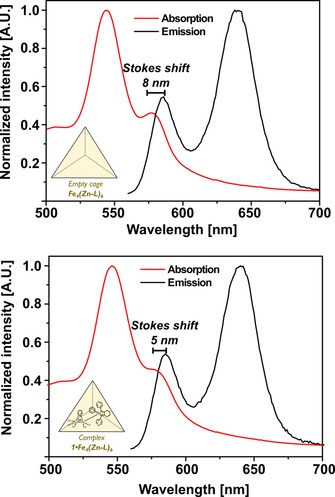
Normalized steady state absorption and fluorescence spectra overlapped. Top: Fe4(Zn‐L)6 shows a Stokes shift of 8 nm. Bottom: 1⋅Fe4(Zn‐L)6 shows a Stokes shift of 5 nm.
Steady‐state fluorescence titration experiments revealed quenching of the fluorescence of Fe4(Zn‐L)6 by 1 in acetonitrile at 298 K. As shown in Figure 7, complex 1 quenches the fluorescence of the cage by about 40 % (550 nm excitation), which corresponds to static quenching of two porphyrin ligands of the cage through ditopic Zn⋅⋅⋅Npy interactions. The obtained titration curve was fitted to a 1:2 host–guest equilibrium equation, giving K 1=1.83×10⁵ m −1 and K 2=6.11×10⁴ m −1 for the two consecutive binding events. These values, which are close to those obtained from the UV/Vis titrations, confirm that the fluorescence quenching corresponds to the same binding events observed during the UV/Vis experiment. The quenching is attributed to electron transfer from the excited state of the porphyrin cage to encapsulated complex 1 in combination with a decreased fluorescence quantum yield of the formed host–guest complex. In fluorescence lifetime measurements the data obtained for the empty cage were fitted to a monoexponential decay function, whereas the host–guest complex has a second time component and was fitted to a biexponential decay function. For the empty cage a fluorescence lifetime of 1.5 ns was obtained, which is identical to that of a cyclic zinc porphyrin tetramer.23 Host–guest complex 1⋅Fe4(Zn‐L)6 gave two lifetimes of 1.5 and 0.03 ns. The former component arises from porphyrins that are not coordinated by 1 and whose lifetime is unaffected by the presence of the catalyst. The shorter lifetime is attributed to uncoordinated porphyrins that are affected by the proximity of the catalyst. The amplitudes of the two species, which are related to their relative concentrations,24 are 59.2 and 40.8 % and were obtained from the biexponential fit (for the fits of the decay curves, see Supporting Information, Section 5). The two porphyrin ligands that are ditopically coordinated by complex 1 do not affect the lifetime of the host–guest complex.
Figure 7.
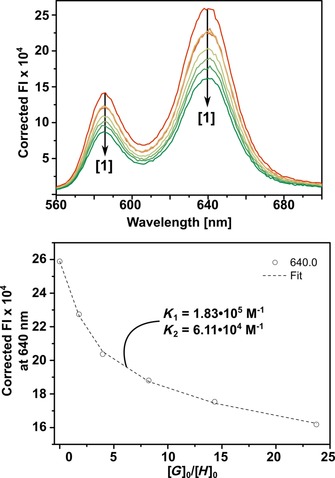
Fluorescence quenching titration between 1 and Fe4(Zn‐L)6 in acetonitrile at 298 K. Top: Overlay of inner and outer filter corrected fluorescence spectra of the titration of Fe4(Zn‐L)6 (host) and 1 (guest) at a constant host concentration of 0.8 μm. Bottom: Variation in the inner and outer filter corrected fluorescence emission intensity at 640 nm versus equivalents of added guest.
To gain further insight into the mechanism of quenching, we performed a Stern–Volmer analysis of the obtained fluorescence titration data. By plotting I 0/I (ratio of fluorescence intensity in the absence and presence of quencher) against the concentration of guest 1 (quencher), a straight line is expected if purely static or dynamic quenching takes place.25 The curved shape of the obtained Stern–Volmer plot (Figure 8, top) suggests that neither mechanism by itself is an accurate description of the system. By using the simple Stern–Volmer equation we assume that quenching occurs in a single type of environment.26 The observed saturation quenching efficiency occurs in cases in which fractions of the quencher and the fluorophore are inaccessible to each other, such as in micelles. By modifying the equation to include a term that accounts for the fraction of accessible fluorophore f a, a modified Stern–Volmer plot can be used to interpret the results (Figure 8, bottom). From the obtained straight line, the intercept gives 1/f a and the slope gives 1/f a K SV, where K SV (K SV=k q τ 0; k q is the quenching rate constant and τ 0 is the fluorescence lifetime in the absence of quencher) is the Stern–Volmer quenching constant. In the present case, the extracted mean value of K SV is around 2.8×10⁵ m −1, from which k q was calculated to be 1.9×10¹⁴ m −1 s−1 by using the lifetime of the empty cage of 1.5 ns as τ 0 (vide supra). The fact that the quenching rate constant is several orders of magnitude larger than the diffusion‐limited rate indicates that binding is involved in the quenching mechanism.26 From the intercept a value of 0.44 was obtained for f a, in good agreement with the static fluorescence quenching studies. The results from the Stern–Volmer analysis imply that formation of the ground‐state host–guest complex promotes efficient static nonradiative quenching of the singlet excited state of Fe4(Zn‐L)6 through ditopic binding of 1 inside the cage.
Figure 8.
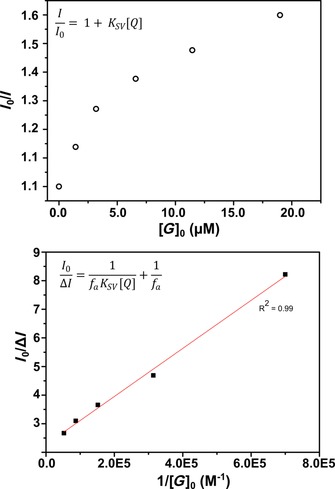
Stern–Volmer analysis of the fluorescence titration data. Top: Stern–Volmer plot of the fluorescence titration of 0.8 μm Fe4(Zn‐L)6 versus the concentration of added guest/quencher 1. Bottom: Modified Stern–Volmer plot of the fluorescence titration of 0.8 μm Fe4(Zn‐L)6 versus the reciprocal of the concentration of added guest/quencher 1.
Confirmation of photoinduced electron transfer by TRIR spectroscopy
Having established that the fluorescence of the cage is quenched by 1, the next step was to assess whether photoinduced electron transfer can take place from excited Fe4(Zn‐L)6 to encapsulated 1. The steady‐state IR spectrum of the encapsulated catalyst showed that the ν(CO) bands of the catalyst are slightly blueshifted on encapsulation in the cage (Figure 9). This is consistent with a more electron poor complex as a result of a change of the electronic properties of the ligand on pyridine coordination. 9b
Figure 9.
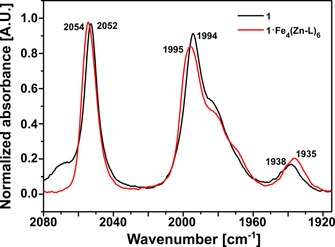
Normalized steady‐state IR spectra of 1 and 1⋅Fe4(Zn‐L)6 overlapped. Measured in acetonitrile in a CaF2 cell with 0.23 mm optical path.
Time‐resolved infrared (TRIR) measurements on a solution of 1⋅Fe4(Zn‐L)6 were performed in which the cage was selectively excited with a laser pulse (585 nm) while probing the IR spectrum with subpicosecond resolution. The absorption‐difference spectra showed bleaching of neutral encapsulated complex 1 at 2043 and 1989 cm−1 in the form of negative bands, while new redshifted bands assigned to monoanion 1− (2022 and 1958 cm−1) appeared (Figure 10, top). The bands in the IR spectrum of the generated monoanionic species change shape with time, indicating that the geometry of the diiron complex changes on photoreduction.12 The band at 2060 cm−1 is attributed to a hot vibrational state arising from direct excitation of 1 with the laser pulse, similar to the hot singlet state observed in TR UV/Vis absorption measurements (for fitted species spectra, see Supporting Information, Section 6).27 The average (CO) shift between 1 and 1− of 26 cm−1 corresponds to that previously obtained for electron transfer from ZnIITPP to 1.5, 9 By global biexponential fitting a time constant of 0.5 ps was obtained for charge separation and 37 ps for charge recombination (Figure 10, bottom). Compared to the previously published system with ZnIITPP, both processes are accelerated when the catalyst is bound in the cage. Use of the Rehm–Weller equation gave the Gibbs free energy for photoinduced electron transfer, which was calculated to be −0.26 eV for the cage and −0.18 eV for ZnIITPP (for calculations, see Supporting Information, Section 8). Clearly there is a stronger driving force for electron transfer from the cage to 1 compared to that from ZnIITPP to 1, in line with the faster electron‐transfer kinetics observed for 1⋅Fe4(Zn‐L)6. The estimated electron‐transfer yield was 1 %, as expected for a system with a relatively low driving force for electron transfer (for calculations, see Supporting Information, Section 7). This is also in line with TR UV/Vis measurements which gave similar spectra and time constants in the presence and absence of 1, which indicate that the catalyst has no real influence on the bulk behavior of the porphyrins of the cage (for TR UV/Vis measurements, see Supporting Information, Section 9).
Figure 10.
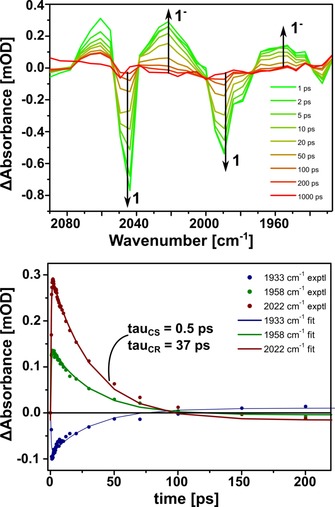
TRIR spectroscopy of 1⋅Fe4(Zn‐L)6. Top: Spectral evolution during TRIR studies. The increasing band at 2060 cm−1 is due to a hot vibrational state. Bottom: Experimental and fitted rise and decay profiles from TRIR studies at three wavelength maxima. mOD=milli optical density.
Electrochemical characterization of 1⋅Fe4(Zn‐L)6
To elucidate the redox behavior of the encapsulated catalyst, empty cage Fe4(Zn‐L)6 and assembly 1⋅Fe4(Zn‐L)6 were subjected to electrochemical investigations in acetonitrile in the presence of 0.1 m nBu4PF6 as electrolyte. Cyclic voltammetry of the empty cage revealed a quasireversible redox event with a cathodic peak potential around −1.3 V [vs. ferrocene/ferrocenium (Fc/Fc+)], followed by a second nonreversible reduction wave at −1.6 V (Figure 11, top left). These waves are assigned to the sequential ligand‐based reduction of two cage iminopyridine ligands at each corner of the cage. Similar sequential reductions have been previously reported for bipyridine‐based tetrahedral iron(II) cages.28 Semidifferential convolution analysis of the voltammogram indicated that the number of electrons in each wave was the same, as expected for the reduction of two identical moieties. A plot of the semidifferential peak current against the scan speed for each reduction wave separately yielded a straight line, indicative of a solution‐based redox event (Figure 11, bottom).29 Moreover, by inspecting the slopes of the plots we could confirm that the first reduction wave is more reversible than the second.
Figure 11.
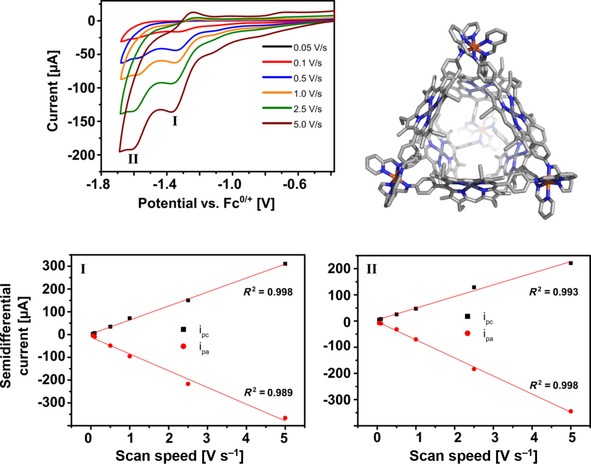
Cyclic voltammogram of 0.4 mm Fe4(Zn‐L)6 in acetonitrile containing 0.1 m nBu4PF6 as electrolyte. Top: Cyclic voltammogram at various scan speeds showing the first two reduction waves. Bottom left: Plot of the semidifferential peak current of the first reduction wave against the scan speed indicating that the redox event is solution‐based. Bottom right: Plot of the semidifferential peak current of the second reduction wave against the scan speed indicating that the redox event is solution‐based.
Next, the electrochemistry of assembly 1⋅Fe4(Zn‐L)6 was studied by cyclic voltammetry. The voltammogram features two reduction waves at −1.2 and −1.3 V, followed by a third reduction event at −1.6 V (Figure 12, blue trace). The second and third events belong to the earlier discussed sequential reductions at the corners of the cage. These two waves are slightly shifted as compared to the free cage as a result of electronic communication between 1 and the cage.31 The first wave, however, is not present in the voltammogram of the empty cage and is assigned to the reduction of encapsulated complex 1. Reduction of the catalyst occurs at a potential that is nearly identical to that of the first reduction of the cage corners (Figure 12, cf. blue and orange traces). For this wave representing the encapsulated catalyst, a plot of the semidifferential peak current against the scan speed was constructed, which yielded a straight line indicative of a solution‐based redox event (Figure 13).
Figure 12.
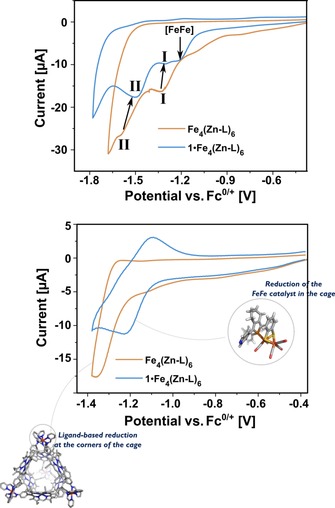
Overlapped cyclic voltammograms of 0.4 mm Fe4(Zn‐L)6 and 0.4 mm 1⋅Fe4(Zn‐L)6 at 0.1 V s−1 in acetonitrile containing 0.1 m nBu4PF6 as electrolyte. Top: Voltammogram recorded until −1.8 V (vs. Fc0/+) for 1⋅Fe4(Zn‐L)6 and until −1.7 V (vs. Fc0/+) for Fe4(Zn‐L)6. The roman numbers show the two redox waves of the cage that shift slightly on encapsulation of 1. [FeFe] refers to encapsulated 1. Bottom: Voltammogram recorded until −1.4 V (vs. Fc/Fc+).
Figure 13.
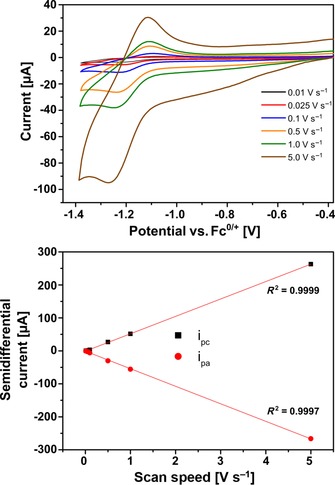
Cyclic voltammogram of 0.4 mm 1⋅Fe4(Zn‐L)6 in acetonitrile containing 0.1 m nBu4PF6 as electrolyte. Top: Cyclic voltammogram at various scan speeds showing the reduction wave of the encapsulated catalyst. Bottom: Plot of the semidifferential peak current of the reduction wave of the catalyst against the scan speed indicating that the redox event is solution‐based.
Stepwise addition of HNEt3PF6 (pK a=10.8) as weak acid to the solution of 1⋅Fe4(Zn‐L)6 resulted in an increase in current at −1.2 V (Figure 14, top). This current continued to increase with increasing acid concentration and was assigned to protonation of the reduced catalyst. The acid is not strong enough to protonate the neutral catalyst, as is clear from the 1H NMR spectrum of 1, which did not change on addition of HNEt3PF6.12 The increase in acid concentration also decreased the reversibility of the back‐oxidation wave, and this indicated that protonation of the reduced catalyst is fast on the timescale of the measurement. Reoxidation of the protonated species was not observed in the window of the measurement.
Figure 14.
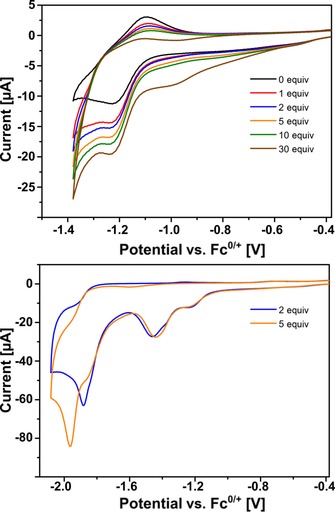
Cyclic voltammogram of 0.4 mm 1⋅Fe4(Zn‐L)6 and increasing concentrations of HNEt3PF6 at 0.1 V s−1 in acetonitrile containing 0.1 m nBu4PF6. Top: First wave showing the increase in current due to protonation of the reduced catalyst and decreased reversibility of the back‐oxidation wave. Bottom: Second wave around −1.9 V (vs. Fc/Fc+) corresponding to proton reduction catalysis.
On scanning to a more negative potential a new band attributed to proton reduction catalysis became visible around −1.9 V (Figure 14, bottom). The current, which is five times higher than that of the wave belonging to the catalyst, indicates that it represents a catalytic event. Moreover, the catalyst in bulk solution has been reported to catalyze the reduction of protons around this potential.11 To determine the rate constant for the catalytic proton reduction, a foot‐of‐the‐wave analysis was performed to give a rate constant k cat of 7×10⁴ m −1 s−1 (Supporting Information, Figure S23).31 This value has the same order of magnitude as that reported for free catalyst 1 in dichloromethane.11 The calculated overpotential η is 0.64 V, which is 20 mV lower than that of the catalyst in bulk solution. With the method reported by Artero and Savéant, a Tafel plot was built from TOFmax=2 k cat[H+]0=1.4×10⁵ s−1 (TOF=turnover frequency), which was extrapolated for a 1 m concentration of substrate (Supporting Information, Figure S24).32
Photocatalytic proton reduction activity of 1⋅Fe4(Zn‐L)6
Having established that 1⋅Fe4(Zn‐L)6 functions as an electrocatalytic proton reduction catalyst, we evaluated its photocatalytic activity in deaerated acetonitrile at room temperature in the presence of CF3COOH (TFA) or H2O as the proton source and a number of different sacrificial electron donors (SED) (Figure 15). The sacrificial electron donors are required to reach more than one turnover, as the oxidized photosensitizer must be reduced before a second catalytic cycle can commence.33 The zinc porphyrin‐based cage acts as the photosensitizer and at the same time it isolates the [FeFe] catalyst from bulk solution.
Figure 15.
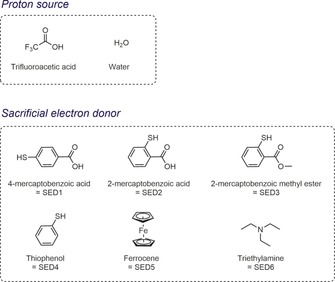
Molecular structures of the proton sources and the SEDs used for the photocatalytic experiments.
The solutions were continuously irradiated with 590 nm visible light from LEDs. The chosen wavelength allowed selective excitation of the porphyrin cage, as the catalyst shows negligible absorption in this region. Moreover, photoinduced electron transfer was previously confirmed by TRIR spectroscopy at nearly the same wavelength (585 nm). After a certain reaction time, an aliquot of the headspace was analyzed by direct injection into a gas chromatograph. First, we studied the photocatalytic activity of 1⋅Fe4(Zn‐L)6 in the presence of TFA as the proton source and 4‐mercaptobenzoic acid (SED1) as SED, inspired by conditions used by Sun et al. for a similar system (Table 1, entry 1). 9d
Table 1.
Photocatalytic proton reduction experiments with various proton sources and sacrificial electron donors.[a]
| |||||
|---|---|---|---|---|---|
| Entry |
1⋅Fe4(Zn‐L)6, c [mm] |
Proton source, c [mm] |
SED [mm] |
λ
exc
[nm] |
H2
evolution |
| 1[b] | 0.08 | TFA, 0.03 | SED1, 0.2 |
590 | yes |
| 2[c] | 0.08 | TFA, 0.2 | SED1, 0.8 |
590 | no |
| 3[d] | 0.08 | TFA, 0.2 | SED1, 0.8 |
590 | no |
| 4[e] | 0.08 | TFA, 4.0 | SED2, 20 |
590 | no |
| 5[e] | 0.08 | TFA, 0.03 | SED3, 0.2 |
590 | no |
| 6 | 0.08 | TFA, 0.03 | SED4, 0.2 |
590 | no |
| 7[d] | 0.08 | TFA, 0.03 | SED4, 1.7 |
590 | no |
| 8[e] | 0.08 | TFA, 0.8 | SED5, 0.8 |
590 | no |
| 9[d,f] | 0.08 | H2O, excess | SED6, excess |
590 | no |
| 10[e,g] | 0.08 | H2O, excess | SED6, excess |
445 | yes |
| 11 | 0.08, catalyst 2+Fe4(Zn‐L)6 |
TFA, 0.03 | SED1, 0.2 |
590 | no |
[a] Reactions were performed with deaerated acetonitrile solutions (5 mL) containing 1⋅Fe4(Zn‐L)6 formed in situ by mixing proton source and SED under continuous irradiation by 2.6 W LED lights. Irradiation time was 2 h and the reaction temperature was 298 K. An aliquot of the headspace was injected into a gas chromatograph by using a gastight syringe. [b] Further 0.4 equiv of TFA with respect to the catalyst was added after 1 h of irradiation, which resulted in more H2 being formed. [c] SED self‐polymerizes and precipitates. [d] Decomposition of the cage was observed after precipitation of porphyrin building block. [e] Free CO was observed in the gas chromatogram owing to decomposition of the catalyst. [f] 5 % NEt3 and CH3CN:MilliQ H2O (8.5:1) as solvent, proton source, and SED. [g] 0.5 % NEt3 and CH3CN:MilliQ water (99:1) as solvent, proton source and SED.
Indeed, after 2 h of irradiation formation of dihydrogen was observed, but the amount corresponded to a turnover number of 0.4, which was the maximum due to the low acid concentration used in the experiment. Addition of a further 0.4 equiv of TFA after 2 h led to formation of additional dihydrogen, confirming that the catalyst is still active after 2 h of irradiation. The low acid concentration was used to prevent pyridine protonation and subsequent catalyst decoordination from the zinc porphyrin cage. To promote more efficient catalysis, we increased both the acid and SED concentration while maintaining the original catalyst concentration (Table 1, entry 2). However, during irradiation, SED1 self‐polymerizes due to the elevated concentration.34 To prevent polymerization we used 2‐mercaptobenzoic acid (SED2) as SED (Figure 15). No dihydrogen was formed irrespective of the concentrations used, because the used donor led to cage decomposition, as evidenced by the formation of a purple precipitate (Table 1, entries 3 and 4). Now the donor stays in solution, as self‐polymerization is prevented, but it decomposes the self‐assembled cage structure due to chelation to the iron corners. Also, the use of the ester analogue (SED3) or thiophenol (SED4) did not lead to hydrogen formation, although with these SEDs the cage was stable (Table 1, entries 6 and 7). However, detection of free CO in the chromatogram indicated catalyst decomposition. Utilization of ferrocene as SED gave the same result (Table 1, entry 8). Most likely, acid functionality in the SED is required to guarantee a higher proton concentration and thereby promote the protonation of anionic intermediates in the catalytic cycle. An experiment with reference catalyst 2 lacking pyridine units, which did not result in photocatalytic hydrogen evolution, demonstrated that the supramolecular interaction between the catalyst and the cage porphyrins is required for catalysis to occur (Table 1, entry 11).
Finally, water was used as proton source and triethylamine as SED. Utilization of acetonitrile/water (8.5:1) in the presence of 5 % triethylamine precipitated the cage and no hydrogen was formed after irradiation of the solution (Table 1, entry 9). The solubility of the cage was limited by the rather high water content. Indeed, on decreasing the contents of water and triethylamine, cage precipitation was prevented and dihydrogen was formed after irradiation at the Soret band of the porphyrin (445 nm) to ensure maximum light absorption. Unfortunately, under these conditions CO was also detected, which indicated catalyst decomposition, most likely as a result of direct excitation of the catalyst (Table 1, entry 10).
Clearly, 4‐mercaptobenzoic acid is the only SED that allows for photocatalytic dihydrogen evolution with 1⋅Fe4(Zn‐L)6, and under these conditions catalyst and cage decomposition is not observed. On using triethylamine as the SED, dihydrogen is also formed but catalyst decomposition occurs. No dihydrogen was evolved in any experiment in which the assembly precipitated. We did not further explore the use of other SEDs such as triethanolamine and propan‐2‐ol, as the efficiency of current system is limited by the relatively weak driving force for electron transfer from the cage to the catalyst in combination with the short lifetime of the charge‐separated state (37 ps). The preorganization of the catalyst–chromophore complex resulted in a change from reductive quenching (via the SED) to oxidative quenching (to the catalyst), which results in these short life times.
Conclusion
Self‐assembled 1⋅Fe4(Zn‐L)6 produces molecular hydrogen as photocatalyst by using visible light as the primary energy source. Catalyst 1 is strongly bound inside the cage by selective ditopic pyridyl–zinc porphyrin interactions with the inner walls of the cavity. Fast photoinduced electron transfer (0.5 ps) from the cage porphyrins to the catalyst residing inside the cage was observed, but also charge recombination is fast (37 ps). TRIR measurements confirmed monoreduction of the catalyst with a quantum yield of 1 %, which may be increased by increasing the driving force for electron transfer. On visible‐light irradiation in the presence of acid, this system reduces protons photocatalytically. Although the turnover number is low at the moment, the system represents one of the few successful examples of utilizing zinc(II) porphyrin‐based photosensitizers. In addition, this system bears a resemblance to nature, as it lowers the overpotential of the catalyst by encapsulation in a second coordination sphere. In the future we will further improve the system by molecular design to enable more efficient electron transfer and photocatalytic proton reduction.
Conflict of interest
The authors declare no conflict of interest.
Supporting information
As a service to our authors and readers, this journal provides supporting information supplied by the authors. Such materials are peer reviewed and may be re‐organized for online delivery, but are not copy‐edited or typeset. Technical support issues arising from supporting information (other than missing files) should be addressed to the authors.
Supplementary
Acknowledgements
We thank the European Research Council (ERC Adv. NAT‐CAT Reek) for financial support. Dongdong Zheng is acknowledged for help with steady‐state fluorescence measurements. Michiel Hilbers is thanked for help with time‐resolved fluorescence measurements. Prof. Dr. J. R. Nitschke is acknowledged for valuable discussions on the supramolecular cage used in this study.
S. S. Nurttila, R. Becker, J. Hessels, S. Woutersen, J. N. H. Reek, Chem. Eur. J. 2018, 24, 16395.
References
- 1. Abe T., Hirano K., Shiraishi Y., Toshima N., Kaneko M., Eur. Polym. J. 2001, 37, 753–761. [Google Scholar]
- 2. Knörzer P., Silakov A., Foster C. E., Armstrong F. A., Lubitz W., Happe T., J. Biol. Chem. 2012, 287, 1489–1499. [DOI] [PMC free article] [PubMed] [Google Scholar]
- 3.For reviews on hydrogenase mimics, see:
- 3a. Gloaguen F., Rauchfuss T. B., Chem. Soc. Rev. 2009, 38, 100–108; [DOI] [PMC free article] [PubMed] [Google Scholar]
- 3b. Barton B. E., Olsen M. T., Rauchfuss T. B., Curr. Opin. Biotechnol. 2010, 21, 292–297; [DOI] [PMC free article] [PubMed] [Google Scholar]
- 3c. Schilter D., Camara J. M., Huynh M. T., Hammes-Schiffer S., Rauchfuss T. B., Chem. Rev. 2016, 116, 8693–8749; [DOI] [PMC free article] [PubMed] [Google Scholar]
- 3d. Georgakaki I. P., Thomson L. M., Lyon E. J., Hall M. B., Darensbourg M. Y., Coord. Chem. Rev. 2003, 238–239, 255–266; [Google Scholar]
- 3e. Darensbourg M. Y., Lyon E. J., Smee J. J., Coord. Chem. Rev. 2000, 206, 533–561; [Google Scholar]
- 3f. Lubitz W., Ogata H., Rüdiger O., Reijerse E., Chem. Rev. 2014, 114, 4081–4148; [DOI] [PubMed] [Google Scholar]
- 3g. Lubitz W., Ogata H., Rüdiger O., Reijerse E., Chem. Rev. 2014, 114, 4081–4148; [DOI] [PubMed] [Google Scholar]
- 3h. Lubitz W., Reijerse E. J., Messinger J., Energy Environ. Sci. 2008, 1, 15–31; [Google Scholar]
- 3i. Artero V., Fontecave M., Coord. Chem. Rev. 2005, 249, 1518–1535; [Google Scholar]
- 3j. Esswein A. J., Nocera D. G., Chem. Rev. 2007, 107, 4022–4047; [DOI] [PubMed] [Google Scholar]
- 3k. Wang M., Han K., Zhang S., Sun L., Coord. Chem. Rev. 2015, 287, 1–14; [Google Scholar]
- 3l. Simmons T. R., Berggren G., Bacchi M., Fontecave M., Artero V., Coord. Chem. Rev. 2014, 270, 127–150. For selected publications on hydrogenase mimics see: [Google Scholar]
- 3m. Mealli C., Rauchfuss T. B., Angew. Chem. Int. Ed. 2007, 46, 8942–8944; [DOI] [PMC free article] [PubMed] [Google Scholar]; Angew. Chem. 2007, 119, 9100–9102; [Google Scholar]
- 3n. Rauchfuss T. B., Inorg. Chem. 2004, 43, 14–26; [DOI] [PubMed] [Google Scholar]
- 3o. Reijerse E. J., Pham C. C., Pelmenschikov V., Gilbert-Wilson R., Adamska-Venkatesh A., Siebel J. F., Gee L. B., Yoda Y., Tamasaku K., Lubitz W., Rauchfuss T. B., Cramer S. P., J. Am. Chem. Soc. 2017, 139, 4306–4309; [DOI] [PMC free article] [PubMed] [Google Scholar]
- 3p. Darensbourg M. Y., Lyon E. J., Zhao X., Georgakaki I. P., Proc. Natl. Acad. Sci. USA 2003, 100, 3683–3688; [DOI] [PMC free article] [PubMed] [Google Scholar]
- 3q. Hsieh C.-H., Ding S., Erdem Ö. F., Crouthers D. J., Liu T., McCrory C. C. L., Lubitz W., Popescu C. V., Reibenspies J. H., Hall M. B., Darensbourg M. Y., Nat. Commun. 2014, 5, 3684; [DOI] [PubMed] [Google Scholar]
- 3r. Lyon E. J., Georgakaki I. P., Reibenspies J. H., Darensbourg M. Y., Angew. Chem. Int. Ed. 1999, 38, 3178–3180; [PubMed] [Google Scholar]; Angew. Chem. 1999, 111, 3373–3376; [Google Scholar]
- 3s. Berggren G., Adamska A., Lambertz C., Simmons T. R., Esselborn J., Atta M., Gambarelli S., Mouesca J.-M., Reijerse E., Lubitz W., Happe T., Artero V., Fontecave M., Nature 2013, 499, 66–69; [DOI] [PMC free article] [PubMed] [Google Scholar]
- 3t. Esselborn J., Lambertz C., Adamska-Venkatesh A., Simmons T., Berggren G., Noth J., Siebel J., Hemschemeier A., Artero V., Reijerse E., Fontecave M., Lubitz W., Happe T., Nat. Chem. Biol. 2013, 9, 607–609; [DOI] [PMC free article] [PubMed] [Google Scholar]
- 3u. Le Goff A., Artero V., Jousselme B., Tran P. D., Guillet N., Métayé R., Fihri A., Palacin S., Fontecave M., Science 2009, 326, 1384–1387; [DOI] [PubMed] [Google Scholar]
- 3v. Stripp S. T., Goldet G., Brandmayr C., Sanganas O., Vincent K. A., Haumann M., Armstrong F. A., Happe T., Proc. Natl. Acad. Sci. USA 2009, 106, 17331–17336; [DOI] [PMC free article] [PubMed] [Google Scholar]
- 3w. Razavet M., Artero V., Fontecave M., Inorg. Chem. 2005, 44, 4786–4795. [DOI] [PubMed] [Google Scholar]
- 4.For selected publications on photocatalytic proton reduction catalysis, see:
- 4a. Streich D., Astuti Y., Orlandi M., Schwartz L., Lomoth R., Hammarström L., Ott S., Chem. Eur. J. 2010, 16, 60–63; [DOI] [PubMed] [Google Scholar]
- 4b. Wu L.-Z., Chen B., Li Z.-J., Tung C.-H., Acc. Chem. Res. 2014, 47, 2177–2185; [DOI] [PubMed] [Google Scholar]
- 4c. Topf C., Kaiser M., Monkowius U., Knör G., Inorg. Chem. Commun. 2017, 77, 47–50; [Google Scholar]
- 4d. Goy R., Bertini L., Rudolph T., Lin S., Schulz M., Zampella G., Dietzek B., Schacher F. H., De Gioia L., Sakai K., Weigand W., Chem. Eur. J. 2017, 23, 334–345; [DOI] [PubMed] [Google Scholar]
- 4e. Troppmann S., König B., ChemistrySelect 2016, 1, 1405–1409; [Google Scholar]
- 4f. Chica B., Wu C.-H., Liu Y., Adams M. W. W., Lian T., Dyer R. B., Energy Environ. Sci. 2017, 10, 2245–2255; [Google Scholar]
- 4g. Keller S. G., Probst B., Heinisch T., Alberto R., Ward T. R., Helv. Chim. Acta 2018, 101, e1800036; [Google Scholar]
- 4h. Junge H., Rockstroh N., Fischer S., Brückner A., Ludwig R., Lochbrunner S., Kühn O., Beller M., Inorganics 2017, 5, 14; [Google Scholar]
- 4i. Cheng M., Wang M., Zhang S., Liu F., Yang Y., Wan B., Sun L., Faraday Discuss. 2017, 198, 197–209; [DOI] [PubMed] [Google Scholar]
- 4j. Li R.-X., Liu X.-F., Liu T., Yin Y.-B., Zhou Y., Mei S.-K., Yan J., Electrochim. Acta 2017, 237, 207–216; [Google Scholar]
- 4k. Li R.-X., Ren X.-T., Tang M.-Y., Chen M.-X., Huang G.-B., Fang C.-H., Liu T., Feng Z.-H., Yin Y.-B., Guo Y.-M., Mei S.-K., Yan J., Appl. Catal. B 2018, 224, 772–782; [Google Scholar]
- 4l. Chen S., Li K., Zhao F., Zhang L., Pan M., Fan Y.-Z., Guo J., Shi J., Su C.-Y., Nat. Commun. 2016, 7, 13169; [DOI] [PMC free article] [PubMed] [Google Scholar]
- 4m. Wang F., Wang W.-G., Wang H.-Y., Si G., Tung C.-H., Wu L.-Z., ACS Catal. 2012, 2, 407–416; [Google Scholar]
- 4n. Wang M., Chen L., Li X., Sun L., Dalton Trans. 2011, 40, 12793–12800; [DOI] [PubMed] [Google Scholar]
- 4o. Wang X.-B., Zheng H.-Q., Rao H., Yao H.-C., Fan Y.-T., Hou H.-W., Appl. Organomet. Chem. 2016, 30, 638–644; [Google Scholar]
- 4p. Yu S., Wang F., Wang J.-J., Wang H.-Y., Chen B., Feng K., Tung C.-H., Wu L.-Z., Pure Appl. Chem. 2013, 85, 1405–1413; [Google Scholar]
- 4q. Zhang P., Wang M., Na Y., Li X., Jiang Y., Sun L., Dalton Trans. 2010, 39, 1204–1206; [DOI] [PubMed] [Google Scholar]
- 4r. Wang F., Liang W.-J., Jian J.-X., Li C.-B., Chen B., Tung C.-H., Wu L.-Z., Angew. Chem. Int. Ed. 2013, 52, 8134–8138; [DOI] [PubMed] [Google Scholar]; Angew. Chem. 2013, 125, 8292–8296; [Google Scholar]
- 4s. Jian J.-X., Liu Q., Li Z.-J., Wang F., Li X.-B., Li C.-B., Liu B., Meng Q.-Y., Chen B., Feng K., Tung C.-H., Wu L.-Z., Nat. Commun. 2013, 4, 2695; [DOI] [PubMed] [Google Scholar]
- 4t. Gao Y.-J., Yang Y., Li X.-B., Wu H.-L., Meng S.-L., Wang Y., Guo Q., Huang M.-Y., Tung C.-H., Wu L.-Z., Chem. Commun. 2018, 54, 4858–4861; [DOI] [PubMed] [Google Scholar]
- 4u. Huang M.-Y., Li X.-B., Gao Y.-J., Li J., Wu H.-L., Zhang L.-P., Tung C.-H., Wu L.-Z., J. Mater. Chem. A 2018, 6, 6015–6021. [Google Scholar]
- 5. Ladomenou K., Natali M., Iengo E., Charalampidis G., Scandola F., Coutsolelos A. G., Coord. Chem. Rev. 2015, 304–305, 38–54. [Google Scholar]
- 6. Jing X., He C., Yang Y., Duan C., J. Am. Chem. Soc. 2015, 137, 3967–3974. [DOI] [PubMed] [Google Scholar]
- 7.For reviews on cage catalysis, see:
- 7a. Leenders S. H. A. M., Gramage-Doria R., de Bruin B., Reek J. N. H., Chem. Soc. Rev. 2015, 44, 433–448; [DOI] [PubMed] [Google Scholar]
- 7b. Yoshizawa M., Klosterman J. K. K., Fujita M., Angew. Chem. Int. Ed. 2009, 48, 3418–3438; [DOI] [PubMed] [Google Scholar]; Angew. Chem. 2009, 121, 3470–3490; [Google Scholar]
- 7c. Wiester M. J., Ulmann P. A., Mirkin C. A., Angew. Chem. Int. Ed. 2011, 50, 114–137; [DOI] [PubMed] [Google Scholar]; Angew. Chem. 2011, 123, 118–142; [Google Scholar]
- 7d. Raynal M., Ballester P., Vidal-Ferran A., van Leeuwen P. W. N. M., Chem. Soc. Rev. 2014, 43, 1734–1787; [DOI] [PubMed] [Google Scholar]
- 7e. Brown C. J., Toste F. D., Bergman R. G., Raymond K. N., Chem. Rev. 2015, 115, 3012–3035; [DOI] [PubMed] [Google Scholar]
- 7f. Vriezema D. M., Aragonès M. C., Elemans J. A. A. W., Cornelissen J. J. L. M., Rowan A. E., Nolte R. J. M., Chem. Rev. 2005, 105, 1445–1489; [DOI] [PubMed] [Google Scholar]
- 7g. Zarra S., Wood D. M., Roberts D. A., Nitschke J. R., Chem. Soc. Rev. 2015, 44, 419–432; [DOI] [PubMed] [Google Scholar]
- 7h. Hooley R. J., J. Rebek, Jr. , Chem. Biol. 2009, 16, 255–264. For selected publications on cage catalysis see: [DOI] [PMC free article] [PubMed] [Google Scholar]
- 7i. Fiedler D., Leung D. H., Bergman R. G., Raymond K. N., Acc. Chem. Res. 2005, 38, 349–358; [DOI] [PubMed] [Google Scholar]
- 7j. Pluth M. D., Bergman R. G., Raymond K. N., Science 2007, 316, 85–88; [DOI] [PubMed] [Google Scholar]
- 7k. Yoshizawa M., Tamura M., Fujita M., Science 2006, 312, 251–254; [DOI] [PubMed] [Google Scholar]
- 7l. Bolliger J. L., Belenguer A. M., Nitschke J. R., Angew. Chem. Int. Ed. 2013, 52, 7958–7962; [DOI] [PubMed] [Google Scholar]; Angew. Chem. 2013, 125, 8116–8120; [Google Scholar]
- 7m. Wang Q.-Q., Gonell S., Leenders S. H. A. M., Dürr M., Ivanović-Burmazović I., Reek J. N. H., Nat. Chem. 2016, 8, 225–230; [DOI] [PubMed] [Google Scholar]
- 7n. Kang J., Santamaria J., Hilmersson G., J. Rebek, Jr. , J. Am. Chem. Soc. 1998, 120, 7389–7390; [Google Scholar]
- 7o. Sarmentero M. A., Fernández-Pérez H., Zuidema E., Bo C., Vidal-Ferran A., Ballester P., Angew. Chem. Int. Ed. 2010, 49, 7489–7492; [DOI] [PubMed] [Google Scholar]; Angew. Chem. 2010, 122, 7651–7654. [Google Scholar]
- 8.
- 8a. Wang J.-L., Wang C., Lin W., ACS Catal. 2012, 2, 2630–2640; [Google Scholar]
- 8b. Wang C., deKrafft K. E., Lin W., J. Am. Chem. Soc. 2012, 134, 7211–7214; [DOI] [PubMed] [Google Scholar]
- 8c. Pullen S., Fei H., Orthaber A., Cohen S. M., Ott S., J. Am. Chem. Soc. 2013, 135, 16997–17003; [DOI] [PMC free article] [PubMed] [Google Scholar]
- 8d. Zhang Z.-M., Zhang T., Wang C., Lin Z., Long L.-S., Lin W., J. Am. Chem. Soc. 2015, 137, 3197–3200. [DOI] [PubMed] [Google Scholar]
- 9.
- 9a. Ladomenou K., Natali M., Iengo E., Charalampidis G., Scandola F., Coutsolelos A. G., Coord. Chem. Rev. 2015, 304–305, 38–54; [Google Scholar]
- 9b. Kluwer A. M., Kapre R., Hartl F., Lutz M., Spek A. L., Brouwer A. M., van Leeuwen P. W. N. M., Reek J. N. H., Proc. Natl. Acad. Sci. USA 2009, 106, 10460–10465; [DOI] [PMC free article] [PubMed] [Google Scholar]
- 9c. Salzl S., Ertl M., Knör G., Phys. Chem. Chem. Phys. 2017, 19, 8141–8147; [DOI] [PubMed] [Google Scholar]
- 9d. Li X., Wang M., Zhang S., Pan J., Na Y., Liu J., Åkermark B., Sun L., J. Phys. Chem. B 2008, 112, 8198–8202; [DOI] [PubMed] [Google Scholar]
- 9e. Song L.-C., Wang L.-X., Tang M.-Y., Li C.-G., Song H.-B., Hu Q.-M., Organometallics 2009, 28, 3834–3841; [Google Scholar]
- 9f. Yu S., Wang F., Wang J.-J., Wang H.-Y., Chen B., Feng K., Tung C.-H., Wu L.-Z., Pure Appl. Chem. 2013, 85, 1405–1413. [Google Scholar]
- 10. Wood D. M., Meng W., Ronson T. K., Stefankiewicz A. R., Sanders J. K. M., Nitschke J. R., Angew. Chem. Int. Ed. 2015, 54, 3988–3992; [DOI] [PubMed] [Google Scholar]; Angew. Chem. 2015, 127, 4060–4064. [Google Scholar]
- 11. Becker R., Amirjalayer S., Li P., Woutersen S., Reek J. N. H., Sci. Adv. 2016, 2, e1501014. [DOI] [PMC free article] [PubMed] [Google Scholar]
- 12. Voss N. R., Gerstein M., Nucleic Acids Res. 2010, 38, W555–W562. [DOI] [PMC free article] [PubMed] [Google Scholar]
- 13. Mecozzi S., J. Rebek, Jr. , Chem. Eur. J. 1998, 4, 1016–1022. [Google Scholar]
- 14.R. Becker in [FeFe]Hydrogenase Mimics for Proton Reduction Catalysis: Supramolecular Proton Reduction Catalysts with Appended Redox-Active and Proton-Responsive Ligands towards Application in a Molecular Artificial Leaf, Ph.D. thesis, University of Amsterdam, 2016.
- 15. Grimme S., Bannwarth C., Shushkov P., J. Chem. Theory Comput. 2017, 13, 1989–2009. [DOI] [PubMed] [Google Scholar]
- 16. Cremers J., Richert S., Kondratuk D. V., Claridge T. D. W., Timmel C. R., Anderson H. L., Chem. Sci. 2016, 7, 6961–6968. [DOI] [PMC free article] [PubMed] [Google Scholar]
- 17. Bhyrappa P., Krishnan V., Nethaji M., J. Chem. Soc. Dalton Trans. 1993, 1901–1906. [Google Scholar]
- 18. Favereau L., Cnossen A., Kelber J. B., Gong J. Q., Oetterli R. M., Cremers J., Herz L. M., Anderson H. L., J. Am. Chem. Soc. 2015, 137, 14256–14259. [DOI] [PMC free article] [PubMed] [Google Scholar]
- 19.S. S. Nurttila, W. Brenner, J. Mosquera, J. R. Nitschke, J. N. H. Reek, Chem. Sci 2018, under review.
- 20. Ghosh M., Mora A. K., Nath S., Chandra A. K., Hajra A., Sinha S., Spectrochim. Acta Part A 2013, 116, 466–472. [DOI] [PubMed] [Google Scholar]
- 21. Venkatramaiah N., Ramakrishna B., Kumar A. R., Veeraiah N., Venkatesan R., J. Alloys Compd. 2012, 513, 318–323. [Google Scholar]
- 22. Piatkevich K. D., Malashkevich V. N., Morozova K. S., Nemkovich N. A., Almo S. C., Verkhusha V. V., Sci. Rep. 2013, 3, 1847. [DOI] [PMC free article] [PubMed] [Google Scholar]
- 23. Yatskou M. M., Koehorst R. B. M., van Hoek A., Donker H., Schaafsma T. J., Gobets B., van Stokkum I., van Grondelle R., J. Phys. Chem. A 2001, 105, 11432–11440. [Google Scholar]
- 24. Saxena A. M., Krishnamoorthy G., Udgaonkar J. B., Periasamy N., J. Chem. Sci. 2007, 119, 61–69. [Google Scholar]
- 25. Barbero N., Barni E., Barolo C., Quagliotto P., Viscardi G., Napione L., Pavan S., Bussolino F., Dyes Pigm. 2009, 80, 307–313. [Google Scholar]
- 26. Cramb D. T., Beck S. C., J. Photochem. Photobiol. A 2000, 134, 87–95. [Google Scholar]
- 27. Li P., Amirjalayer S., Hartl F., Lutz M., de Bruin B., Becker R., Woutersen S., Reek J. N. H., Inorg. Chem. 2014, 53, 5373–5383. [DOI] [PubMed] [Google Scholar]
- 28. Mahata K., Frischmann P. D., Würthner F., J. Am. Chem. Soc. 2013, 135, 15656–15661. [DOI] [PubMed] [Google Scholar]
- 29.
- 29a. Toman J. J., Brown S. D., Anal. Chim. Acta 1981, 123, 187–199; [Google Scholar]
- 29b. Dalrymple-Alford P., Goto M., Oldham K. B., Anal. Chem. 1977, 49, 1390–1394; [Google Scholar]
- 29c. Goto M., Ishii D., J. Electroanal. Chem. Interfacial Electrochem. 1975, 61, 361–365. [Google Scholar]
- 30. Rizzuto F. J., Wood D. M., Ronson T. K., Nitschke J. R., J. Am. Chem. Soc. 2017, 139, 11008–11011. [DOI] [PubMed] [Google Scholar]
- 31. Costentin C., Drouet S., Robert M., Savéant J.-M., J. Am. Chem. Soc. 2012, 134, 11235–11242. [DOI] [PubMed] [Google Scholar]
- 32. Artero V., Saveant J.-M., Energy Environ. Sci. 2014, 7, 3808–3814. [DOI] [PMC free article] [PubMed] [Google Scholar]
- 33.
- 33a. Pellegrin Y., Odobel F., C. R. Chim. 2017, 20, 283–295; [Google Scholar]
- 33b. Eckenhoff W. T., Eisenberg R., Dalton Trans. 2012, 41, 13004–13021. [DOI] [PubMed] [Google Scholar]
- 34. Kricheldorf H. R., Conradi A., Macromolecules 1989, 22, 14–20. [Google Scholar]
Associated Data
This section collects any data citations, data availability statements, or supplementary materials included in this article.
Supplementary Materials
As a service to our authors and readers, this journal provides supporting information supplied by the authors. Such materials are peer reviewed and may be re‐organized for online delivery, but are not copy‐edited or typeset. Technical support issues arising from supporting information (other than missing files) should be addressed to the authors.
Supplementary


