Abstract
Purpose
Catheters and guidewires are used extensively in cardiac catheterization procedures such as heart arrhythmia treatment (ablation), angioplasty, and congenital heart disease treatment. Detecting their positions in fluoroscopic X‐ray images is important for several clinical applications, for example, motion compensation, coregistration between 2D and 3D imaging modalities, and 3D object reconstruction.
Methods
For the generalized framework, a multiscale vessel enhancement filter is first used to enhance the visibility of wire‐like structures in the X‐ray images. After applying adaptive binarization method, the centerlines of wire‐like objects were extracted. Finally, the catheters and guidewires were detected as a smooth path which is reconstructed from centerlines of target wire‐like objects. In order to classify electrode catheters which are mainly used in electrophysiology procedures, additional steps were proposed. First, a blob detection method, which is embedded in vessel enhancement filter with no additional computational cost, localizes electrode positions on catheters. Then the type of electrode catheters can be recognized by detecting the number of electrodes and also the shape created by a series of electrodes. Furthermore, for detecting guiding catheters or guidewires, a localized machine learning algorithm is added into the framework to distinguish between target wire objects and other wire‐like artifacts. The proposed framework were tested on total 10,624 images which are from 102 image sequences acquired from 63 clinical cases.
Results
Detection errors for the coronary sinus (CS) catheter, lasso catheter ring and lasso catheter body are 0.56 ± 0.28 mm, 0.64 ± 0.36 mm, and 0.66 ± 0.32 mm, respectively, as well as success rates of 91.4%, 86.3%, and 84.8% were achieved. Detection errors for guidewires and guiding catheters are 0.62 ± 0.48 mm and success rates are 83.5%.
Conclusion
The proposed computational framework do not require any user interaction or prior models and it can detect multiple catheters or guidewires simultaneously and in real‐time. The accuracy of the proposed framework is sub‐mm and the methods are robust toward low‐dose X‐ray fluoroscopic images, which are mainly used during procedures to maintain low radiation dose.
Keywords: cardiac catheterization procedures, catheter detection, electrophysiology, guidewire detection
1. Introduction
Cardiac catheterization procedures are routinely carried out under X‐ray fluoroscopic guidance to diagnose and treat heart diseases such as atrial fibrillation, congenital heart defects, coronary artery diseases, and more. The procedures generally involve catheters and guidewires, which are visible in the X‐ray images as they are made from high density materials. However, soft tissues are hardly visible under X‐ray. To overcome this problem, static (3D) roadmaps can be overlaid onto X‐ray images to add anatomical information. 3D roadmaps are the anatomical models of soft issues which can be generated from preprocedural computed tomography (CT) images,1, 2, 3 magnetic resonance (MR) images,4, 5 or rotational X‐ray angiography (RXA) images.6, 7, 8 However, the accuracy of 3D roadmap guiding systems rely on the accuracy of: (a) respiratory and cardiac motion compensation, and (b) registration between the 2D X‐ray images and the 3D roadmap. Localizing catheters and guidewires provides more information to help increasing the accuracy of both motion compensation and 2D3D registration. For example, during cardiac electrophysiological (EP) procedures, localizing electrode catheters such as coronary sinus (CS) catheters and lasso catheters, which are routinely used, could be employed to correct respiratory motion.9 Furthermore, the CS catheter in the X‐ray image could be used as a reference to increase the overlaying accuracy of the 3D roadmap (Fig. 1(a) gives an example). The applications of real‐time detection of catheters and guidewires are not limited to EP procedures. In cardiac catheterization procedures for treating congenital heart defects, 3D heart models together with blood vessels models could be automatically registered with 2D X‐ray images if the locations of catheters or guidewires are detected.10 Those soft tissue models could then be overlaid onto live X‐ray images to aid device deployment in the targeted location.
Figure 1.
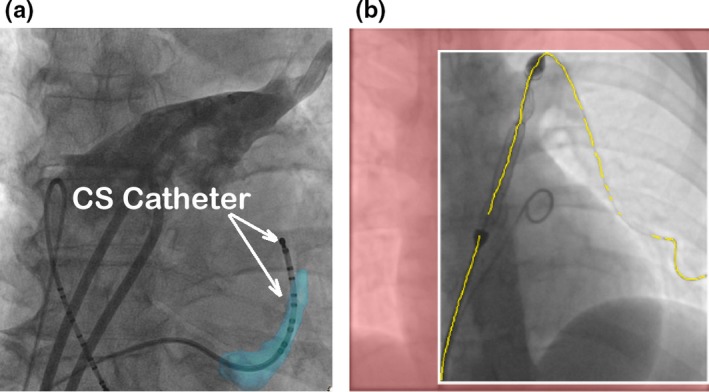
(a) Aligning the CS model (light blue color) with the CS catheter in the X‐ray image for 2D to 3D registration. (b) Localized guidewires are shown in yellow. The predicted collimation box is shown with white boundaries with the area outside set to red. [Color figure can be viewed at http://www.wileyonlinelibrary.com]
Moreover, localizing guidewires and catheters can facilitates optimal collimation.11 Collimators control the field of view by using thick blades to block part of X‐ray radiation leaving the source to the patient. Currently, collimation is controlled manually by human operator and it causes interruption to the clinical work‐flow. Detecting locations of guidewires or catheters can automatically narrow down the region of interest [Fig. 1(b) gives an example]. Therefore, real‐time catheter and guidewire detection, is essential for many image guided applications, such as motion compensation, 2D3D image registration, and X‐ray dose control using collimation. Nonetheless, developing an accurate and robust real‐time detection method is a challenging task as the majority of X‐ray fluoroscopic images are low quality.
Conventional methods using region features, such as pixel intensity, or texture and histogram, cannot track catheters or guidewires well.12 Another category of detection methods, such as active contours and level sets,13, 14, 15 are prone to image artifacts and other wire‐like objects. Brost et al. 16, 17 developed a model‐based lasso catheter tracking algorithm. However, the tracking method required manual initialization or a model provided by the detection method. The proposed method does not work on other catheters or guidewires. Wu et al.18 proposed a learning‐based approach to temporally track and detect catheter electrodes in fluoroscopy sequences. Similar to Brost's method, it only tracks electrodes and required manual initialization. Yatziv et al.19 presented a catheter detection method based on cascade classifiers. Although their method achieved 10 fps and 3.97% detection failure rate, it only detected the catheter tip electrode and could fail when a thicker lasso catheter was present. Ma et al.20, 21 have developed a catheter detection method based on blob detection. However, this method only works on catheters with electrodes and will not detect guidewires. Furthermore, this method only detects the part of catheter with electrodes on it.
For guidewire detection and tracking, the majority of work is only focused on tracking, and require manual initialization. Beyar et al.22 designed a guidewire detection method by using a combination of a filter‐based method, and the Hough transform, to extract wire‐like objects and fit them with polynomial curves. This method would likely fail in X‐ray images, as there is no method to differentiate between image wire‐like artifacts and real wire‐like object. Similarly, Baert et al.,23 used image subtraction and template matching to enhance guidewires, but only detected a part of the guidewire. More recently, a number of learning‐based methods have been developed for guidewire tracking. Barbu et al.,24 used a marginal space learning method to track the target object based on manual annotations. Wang et al.,25 utilized a probabilistic framework, and tracking speed of 2 fps was achieved. Chen et al.26 used a deformed B‐spline model and motion patterns to track guidewires. The B‐spline model was also used together with a convolutional neural networks in Ref. 27. However, all tracking methods need manual or semi‐automatic initialization of the guidewire models. Navab et al.28 applied a machine learning approach on randomly generated deformable models to extract guidewires. However, this was not tested on cases where guidewires have a sudden and large deformation movement.
In this paper, we propose a fully automatic catheter and guidewire detection framework. Two object classifiers were used in the detection framework. The first classifier is based on blob detection and is embedded in the vessel enhancement filter with no additional computational cost. This classifier is used to target electrode catheters. In addition to recognize the type of electrode catheter based on the electrode pattern, the classifier also reduces the influence of wire‐like artifacts. The second classifier uses a k‐nearest neighbor (KNN) algorithm to distinguish between target wire objects and image artifacts. It is used for detecting guidewires or catheters without electrodes. The computational costs of both classifiers are low and they can be used in real‐time applications.
2. Methods
The proposed computational framework is divided into four steps: (a) Multiscale vessel enhancement and blob detection. (b) Centerline extraction and segmentation. (c) Wire path reconstruction. (d) Object classification. For detecting and recognizing electrode catheters, an object classifier using electrode (blob) positions is added after the third step. For detecting guidewires or catheters without electrodes, a KNN classifier is added into the third step.
2.A. Multiscale vessel enhancement and blob detection
A multiscale vessel enhancement filter29 is used to enhance the visibility of wire‐like structures in the X‐ray images. It is based on the idea of approximating wire‐like objects, such as tubular or cylindrical structures.29 In order to detect wire‐likes structures, the vessel filter algorithm finds the local coordinate system aligned with the wire and use the curvature in these directions (x or y axis) to classify different structures. This involves the following five steps:
Step 1) Gaussian smoothing by convolving the 2D input image with a Gaussian kernel of the appropriate scale s. The Gaussian kernel at position , and scale s is defined as follows:
| (1) |
The smoothed image is computed as , where is the convolution operator.
Step 2) Aligning the orthogonal coordinate system with the local features in the image by forming and decomposing the 2 × 2 Hessian matrix at every image pixel. The Hessian matrix consists of second order derivatives that contain information about the local curvature. is defined such as:
| (2) |
where , and the other terms are defined similarly.
Step 3) Eigenvalue decomposition for Hessian matrix .
Step 4) Computing the vessel classification using the eigenvalues. As is a 2 × 2 matrix, there are two eigenvectors and eigenvalues at every image pixel. To quantify any local structures in the image, the eigenvalues for each pixel are arranged in increasing order such that . The ratio differentiates between wire‐like structures and blob‐like structures and is given by . If , detected structures will be blob‐like structures. Otherwise, they will be wire‐like structures.
Step 5) Applying the vessel filter repeatedly using different Gaussian scales to take into account different vessel sizes within the 2D image.
The multiscale parameter s is one of the important parameters in the vessel enhancement filter. If s is set too high, guidewires or catheters will be filtered out. If the range of s is set too large, it will slow down the vessel enhancement filter dramatically. In order to get the optimal result for enhancing catheters and guidewires, the multiscale s of Gaussian kernel should be centered at the average radius of target objects.29 To calculate the average radius, radii of several catheters and guidewires used in clinical cases are measured. To convert them into image pixel space, pixel to mm ratio are obtained from X‐ray Dicom image header. The magnification factor M of the X‐ray system is also estimated, which is based on ( is the distance from the X‐ray source to the detector, and is the distance from the X‐ray source to the patient). The real pixel to mm ratio is defined as: . The final multiscale s is in the range of 2 (Unit is in image pixels).
As a by‐product of the vessel enhancement filter, electrode (blob) positions can be detected as image pixels where the ratio between two eigenvalues is close to 1.0 (). Enabling blob detection adds no additional computational cost for the filter as the eigenvalues of Hessian matrix are always computed inside the vessel enhancement filter. An example of blob detection can be found in Fig. 2.
Figure 2.
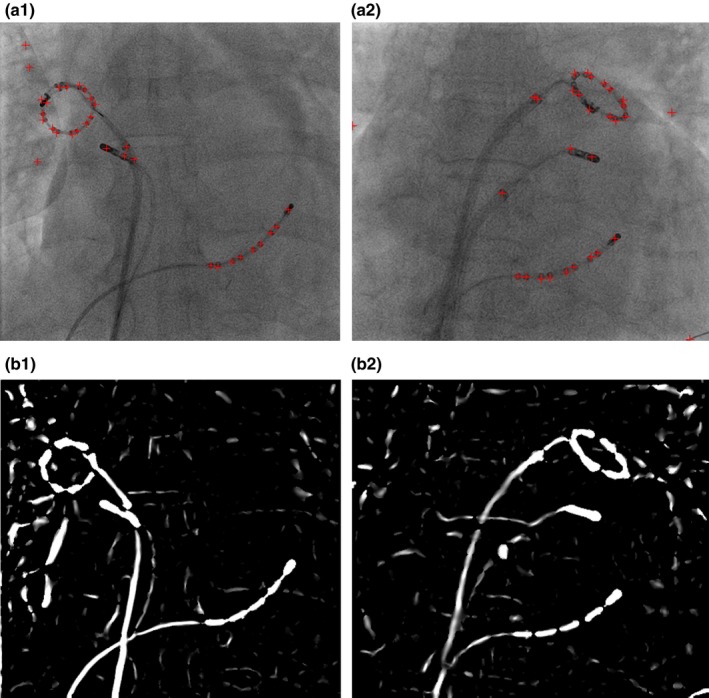
Outputs from vessel enhancement filter. (a) Blob positions (red crosses). (b) Enhanced wire‐like objects. [Color figure can be viewed at http://www.wileyonlinelibrary.com]
2.B. Centerline extraction and segmentation
In order to reduce computational complexity, and achieve real‐time detection speed, after applying the vessel enhancement filter, the image is binarized using Otsu's method.30 Otsu’s method is a nonparametrized and adaptive algorithm as it automatically determines the thresholding level based on minimizing the intra‐class variance. Otsu’s method has been used together with vessel enhancement filter for coronary sinus segmentation on X‐ray images.31
A thinning algorithm32 is applied to the binarized image and the results are one‐pixel‐wide skeletons. Those skeletons are the centerlines of wire‐like objects and they have to be broken down into line segments before wire path reconstruction. The first step of segmentation is to find the branch points and end points of the skeleton. A branch point is the pixel which has more than two neighbors of skeleton pixels in connected 8‐neighbours. End points only have one neighbor [Fig. 3(a)]. Figure 3 presents the flow chart for the centerline segmentation algorithm.
Figure 3.
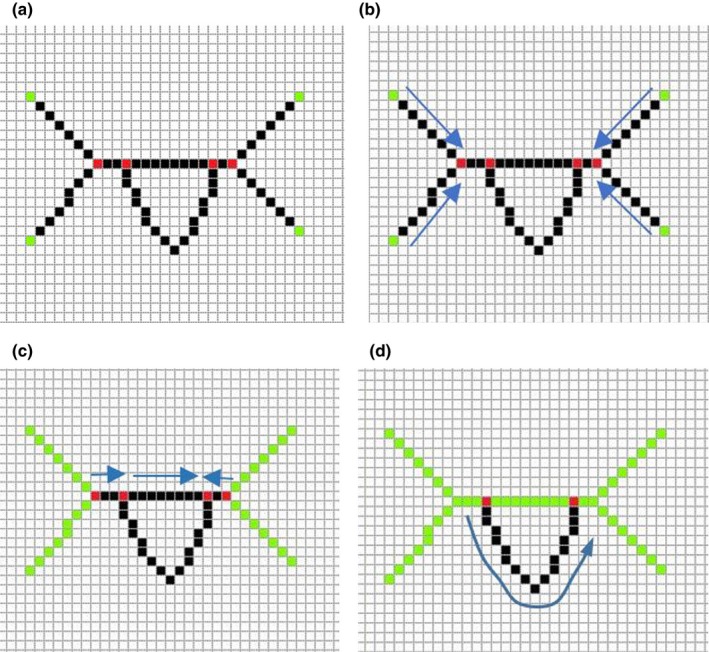
(a) Step one: find the branch and end points. The red points are branch points and green points are end points. (b) Step two: extract segments from one end point to the nearest branch point along the skeleton. (c) Step three: extract segments from one branch point to the nearest branch point along the skeleton. Green line segments are extracted segments. (d) Step four: Detect any unused image pixels within the skeleton. If unused pixels are found, extract line segments from the nearest branch point to another one. [Color figure can be viewed at http://www.wileyonlinelibrary.com]
2.C. Wire path reconstruction
The wire path reconstruction algorithm used in this paper assumed that the catheters and guidewires are relatively rigid so that the path created from multiple line segments (Section 2.B) is smooth. The proposed algorithm probably will not work on very flexible wires such as pacing wires in cardiac resynchronization therapy. However, the main applications for the computational framework is for motion compensation and 2D to 3D registration. Both applications require rigid objects to work with.
Furthermore, in cardiac catheterization procedures for treating congenital heart defects, the first step is to push a guiding catheter toward the area to be treated, which sometimes involves pushing the catheter into a narrow blood vessel [Fig. 4(a)]. Then, a guidewire is pushed through the guiding catheter [Fig. 4(b)]. Finally, a treatment device, such as a balloon or stent, is pushed along guidewire inside the guide catheter to the target area and deployed. Guidewires are thicker and less flexible as they have to support interventional devices.
Figure 4.
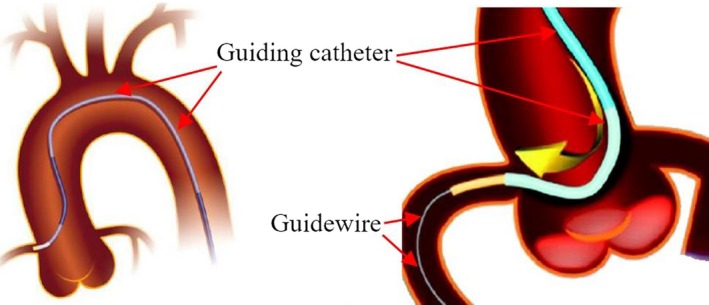
(a) Guiding Catheter. (b) Guiding catheter and guidewire. [Color figure can be viewed at http://www.wileyonlinelibrary.com]
Therefore, a minimum energy method is used to search a smooth path for the completed catheter or guidewire. The cost function for the minimum energy method is defined as:
| (3) |
are the optimal weight parameters. Angle is the angle between two tangent vectors of two line segments (see Fig. 5). is the local curvature ratio between two line segments. is the distance between two end points from two line segments. is the maximum distance for searching candidate line segments. is the distance between an end point and its projected point on the tangent vector (see Fig. 7). L is the length of the line segment.
Figure 5.
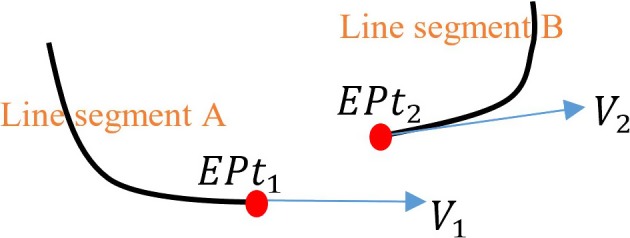
End point and tangent vector definitions for the cost function. [Color figure can be viewed at http://www.wileyonlinelibrary.com]
The cost function contains five parts and each part has been normalized to the range between 0 and 1. The cost function is used to select a pair of line segments which creates a smooth path between them. The first part is to minimize the direction angle difference between two line segments. As shown in Fig. 5, can be calculated as . Where are the dot product between the end tangent vector of line segment A and the end tangent vector of line segment B. and are the length of vector and .
The second part is to minimize the local curvature difference between two line segments. The curvature ratio always has the range between 0 and 1 as it is defined as
| (4) |
where is the local curvature in the end point in line segment A and is the local curvature in the end point in line segment B (Fig. 5).
To compute the local curvature efficiently, an approximation method was developed. In mathematics, the local curvature is defined as 1/R, where R is the radius of an approximation circle which is fitted with the curve. As shown in Fig. 6, the approximation circle touches the curve on the point where the local curvature calculation is required.
Figure 6.
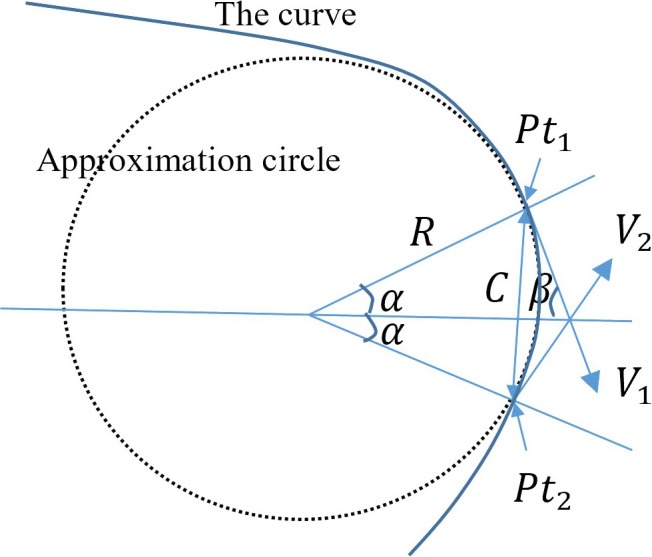
Illustration for local curvature approximation. [Color figure can be viewed at http://www.wileyonlinelibrary.com]
To compute the local curvature efficiently, we assume that and are both on the approximation circle and the curve. Therefore,
| (5a) |
where C is the distance between and . Angle can be computed from angle , which is defined as
| (5b) |
2 is the angle between two tangent vectors ( and ) of the curve. As , .
Then, the Eq. 5(a) can be rewritten as
| (5c) |
As , . is always great than 0, otherwise the tangent (right angle) triangle will not exist. So,
| (5d) |
Finally, Eq. 5(c) is rewritten as
| (5e) |
Local curvature is computed as
| (6) |
The Eq. (6) is very efficient to compute as the computational cost of dot product of two vectors is very low (compared with curve fitting or curve derivative calculations). The computation of local curvatures was only carried out in the region of two end points for each line segment. and should not be neighbor image pixels along line segment as curvature computation could be distracted by incorrectly identified endpoints which arise from image noise. Instead, there should be a gap of 3 or 4 image pixels between and .
The third part of Eq. (3) is to minimize the distance which is between two end points from two line segments. Similarly, the fourth part of Eq. (3) is to minimize the distance which is between an end point and its projected point on the tangent vector. As shown in Fig. 7, is the connection vector between two end points and . The distance is the length of . The distance is computed as , where is the angle between and . is the tangent vector at the end point . The final part of Eq. (3) is to penalize short line segments to avoid distracting by image noise. L is the length of the line segment which is measured in the number of image pixels. The minimum value of L is 2 as single‐pixel line segments are excluded from path searching algorithm. in Eq. (3) is the maximum distance for searching candidate line segments. In order to accommodate the low‐contrast guiding catheters or guidewires, the maximum searching distance is set to 10% of image width or image height (whichever is longer). An example of path reconstruction of the low‐contrast wire guiding catheter is shown in Fig. 17(e).
Figure 7.
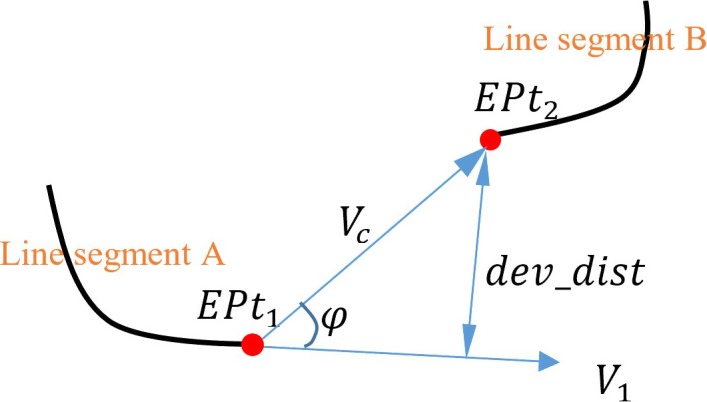
con_dist and dev_dist distance definitions. [Color figure can be viewed at http://www.wileyonlinelibrary.com]
To find out the optimal weight parameters () for Eq. (3), 610 training images from eight image sequences were used. Among eight image sequences, five sequences (212 images) contain electrode catheters and three sequences (398 images) contain guiding catheters or guidewires. A brute‐force approach was employed to search possible combinations of weights. were set to a range from 0.2 to 1.0 with a step size 0.2. Total number of combinations are . The selection of optimal weights is based on achieving maximum success rate of detection. A successful detection is defined as the maximum distance between the detected object and the manually annotated object is below 2.5 mm (around six image pixels). The choice of 2.5 mm is motivated by the size of the smallest target structures for cardiac catheterization procedures. After applying optimal weight, Eq. (3) is redefined as following:
| (7) |
As all catheters or guidewires are inserted from the blood vessels in arms, legs or necks into the heart, wire path reconstruction algorithm could start with the longest line segment which is close to the image boundaries. Then, the algorithm computes the energy costs (Eq. (7)) for all line segments within the maximum searching distance and the one with the lowest energy cost is selected. Repeat the previous step until no more line segments are within the maximum searching distance or stopping criterion is triggered. The stopping criterion is , which means that the wire path is going to make a sharp turn (). The wire path reconstruction algorithm can be repeated several times in order to extract multiple wire objects. Examples of path reconstruction for electrode catheters and guidewires are shown in Fig. 17.
2.D. Object classification
To improve the robustness of detection framework against image artifacts, an additional step has been added after or within the third step. This step not only reduces the influence of image artifacts, but also can recognize different types of electrode catheters based the electrode patterns.
2.D.1. Lasso catheter ring detection
If the X‐ray image contains a lasso catheter, the pattern of blob (electrode) positions from the vessel enhancement filter can be used to distinguish the lasso catheter ring from other catheters or guidewires. The physical shape of the lasso catheter ring (Fig. 8) is a closed circular curve. When it is perspectively projected onto a 2D imaging plane by the X‐ray system, the projected shape becomes a circle or an ellipse. Under some particular view orientations, the ellipse can collapse to a line segment. To accommodate different shapes of lasso ring, blob grouping and ring object selecting based on a cost function were developed.
Figure 8.
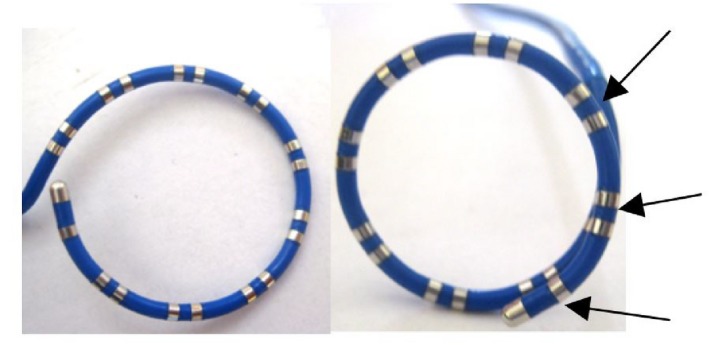
Lasso catheter ring. Electrodes are overlapped in the areas indicated by arrows. [Color figure can be viewed at http://www.wileyonlinelibrary.com]
Blob grouping selects a number of blobs which are close together. A distance‐based clustering (partition) method is applied to all blobs in the X‐ray image to yield several groups. The distance threshold used in the clustering method is set to 2*, where is the maximum gap distance between two neighboring electrodes in all lasso catheters used in our clinical cases. The reason for using 2* is to tolerate small detection errors to localize the positions of electrodes. Any blob group with less than half of expected number of blobs will be removed from the detection. The expected number of blobs is the number of electrodes (20 in our case) which lasso catheter has. The reason of using is to tolerate missing electrodes. The missing of electrodes happens when two electrodes are very close or overlapped. Two electrodes will be detected as one blob (see Fig. 8).
After blob grouping, principle component analysis (PCA) is used to compute the center of the estimated enclosing circle and two principle vectors. The first principle vector is the direction of semimajor axis of the ellipse. The second vector is the direction of semiminor axis [Fig. 9(a)]. To estimate the radius of semimajor axis, all blob points are projected onto the first principle vector and the radius is half of the distance between two end points. The radius of semiminor axis is estimated as the maximum distance between blob points and their projected points on the semimajor axis. To remove outliers, all blob points are converted into the polar coordinate system by using the center as the reference point. Any blob point with a sudden large change in radius will be removed. After removing outlier blobs, PCA as well as ellipse equation are recalculated.
Figure 9.
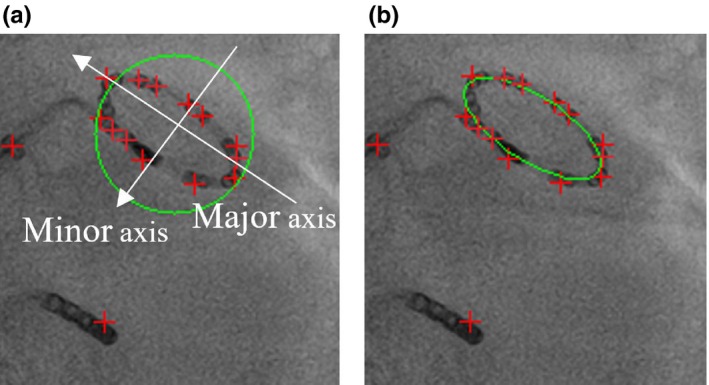
(a) Estimated enclosing circle. (b) Final detected lasso catheter ring. [Color figure can be viewed at http://www.wileyonlinelibrary.com]
Then, a cost function is used to compute a score for each of ring‐like objects. The cost function is defined as
| (8) |
where RC is the radius of the semimajor axis of the detected lasso ring. is the radius of the semiminor axis. is the average radius of lasso ring, which is computed from training image dataset (Section 2.C), in which all lasso rings have been manually annotated. N is the number of blobs found in the blob group and is the expected number of electrodes. In Eq. (8), when the lasso ring collapses to a line segment, . In this special case, the cost function has two parts. The first part is to test whether the size of detected ring is close to the average radius or not. The second part is to compute the density of blobs on the line segment. The collapsed lasso ring has higher density of blobs. Finally, the ring‐like object with the lowest score is selected as the detected lasso catheter ring.
2.D.2. Lasso catheter body detection
If the remaining wire body of lasso catheter needs to be detected, existing detected wire objects which were found by wire path reconstruction algorithm are checked first. Two conditions must be met if the wire is detected as the body of lasso catheter. (a) One of its end points must be connected to the lasso ring. (b) If one end point connects to the ring, its tangent vector must be aligned with the tangent vector from the lasso ring. It can be calculated as . However, if none of detected wire objects satisfy those two conditions, the unused line segments from centerline segmentation algorithm will be searched. If one of them meets the two conditions, the wire path algorithm will be used to trace the path from the lasso ring to one of image edges.
2.D.3. CS catheter detection
Similar to lasso catheter detection, the pattern of blob positions can be used to distinguish the CS catheter from other catheters or guidewires. CS catheter detection should be applied after lasso catheter ring detection, if both catheters appear in the X‐ray image. As all CS catheters used in our clinical cases contain 10 electrodes and electrodes are nearly evenly spaced, a cost function is developed as following:
| (9) |
The first part is related to the number of electrodes on the catheter and it will reach zero when . N is the number of blobs in the wire object. is the expected number of electrodes on the catheter. The second part is to test the blob gap distance. is the distance between an blob and its nearest neighbour blob. is the mean distance of all . The second part of Eq. (9) will be zero when all are the same, which means that electrodes are evenly spaced.
The first step of CS catheter detection is to select a number of blobs which are located on the detected wire object. This step is an extra step in detection algorithm if compared with lasso ring detection. The extra step ensures that only blobs on wire objects need to be included in pattern recognition and ignore other blobs, which makes the detection algorithm robust toward noise and outliers. Then, a distance‐based clustering (partition) method is applied to those selected blobs to yield several groups. The distance threshold used in the clustering method is set to 2*, where is the maximum gap distance between two neighbor electrodes in all CS catheters used in our clinical cases. The reason for choosing 2* is to tolerate small detection errors to localize the positions of electrodes. As there might be several detected wire objects, any wire object with less than half of expected number of electrodes () is discarded. Then, Eq. (9) is used to compute a score for each of the remaining wire objects. The wire object with the lowest score is selected as the detected CS catheter.
2.D.4. Wire objects classification
Although the vessel enhancement filter can enhance and detect wire‐like objects, it could still be affected by some image artifacts, such as calcium deposits and rib bone boundaries (Fig. 10). For CS catheter and lasso ring detection, electrodes on the wire provide reliable information to distinguish target objects from image artifacts. For guidewires or guiding catheter, it is necessary to recognize as many artifacts as possible so that the wire path reconstruction algorithm will not be distracted by image artifacts.
Figure 10.

Image artifacts (indicated by red arrows) in X‐ray images. [Color figure can be viewed at http://www.wileyonlinelibrary.com]
In order to recognize artifacts, a k‐nearest neighbor (KNN) algorithm is used. Instead of applying KNN on the whole image to detect artifacts, a localized KNN image classifier is developed to process only wire‐like objects, which are obtained from the previous centerline segmentation step. First, 500 sample images of artifacts (negative data) and 500 sample images of target objects (positive data) are manually located and labeled from training image dataset. The orientation vectors are computed and sample images are organized around the detected main axis. Then, the sample images were flipped along the X and Y axis to create a total of 4000 sample images for both positive and negative data. This not only increases the number of training samples, but also solves the asymmetrical problem.
The size of sample images is 20 × 40 pixels. Figure 11 gives some examples. There are some bended wire images in positive data, which gives some flexibilities for KNN to recognize bended wires or catheters. All positive and negative sample images are filtered by Sobel filter and normalized so that they all have the same value of the average intensity. This step is to prevent the wrong classification which is caused by the difference in the average intensity between two images. Sober filter is used to enhance the edges, which are the important feature to distinguish wires and artifacts. The wires has two strong edges in both sides. On the other hand, artifacts often have just one strong edge and the other edge is weak (see Fig. 11).
Figure 11.
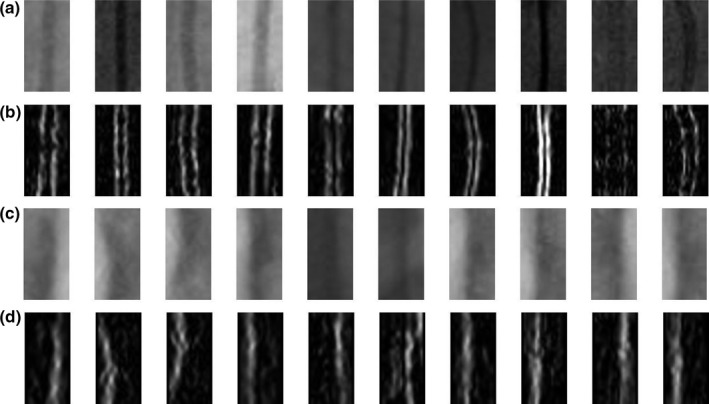
Training samples for KNN. (a) Positive data including guiding catheters and guidewires. (b) Positive data after applying Sobel filter and normalization. (c) Negative data such as calcium deposit and rib bones. (d) Negative data after applying Sobel filter and normalization.
In current implementation, five nearest neighbors are used for KNN classifications. KNN uses Euclidean distances which are . Some of failed classifications are illustrated in Fig. 12.
Figure 12.

Failed classifications for negative data (artifacts were classified as wire objects). (a) Intersection with a catheter. (b) X‐ray contrast agent injection. (c) Calcium deposit.
3. Results
110 image sequences (11,234 images) were acquired in 63 different clinical cases. Image data were collected from St. Thomas hospital, London and University Hospital of Bordeaux, France. The frame size of each sequence is 512 × 512, with pixel sizes between 0.342 and 0.433 mm. The proposed detection framework has been tested on 102 image sequences (10,624 images). The remaining 610 images are used as training data for finding optimal weights and training KNN image classifier. Among 63 clinical cases, 42 cases are cardiac electrophysiology (EP) interventions and remaining cases are cardiac catheterization procedures for treating congenital heart defects (CHD). 3521 X‐ray images from EP cases contain one CS catheter and 2377 images contain one CS catheter and one lasso catheter. Remaining test images (4726 images) are from treatment of CHD and images contain maximum two target wire objects such as guiding catheters or guidewires.
To establish ground truth for evaluation, electrode catheters, guiding catheters or guidewires are manually annotated by a clinical expert. An annotated object starts from the edge of the image and ends at its tip. For lasso catheter ring, the manual annotation is a closed curve. They are used as the ground truth for accuracy tests. The detection precision is defined as the average of shortest distances from points on a detected object to the corresponding annotated object. For the technique to be acceptable in clinical practice, failed detections are considered to be the ones where any points on the detected object has larger errors than a preset threshold (e.g., a threshold of 2.5 mm (around 6 image pixels) 24 is used in this evaluation), which is the average diameter of guidewires or catheters) and it also corresponds to the size of the smallest target structures for cardiac catheterization procedures.
To determine intraobserver variation, the same clinical expert was asked to perform the manual annotation again on 400 randomly selected X‐ray images. The error distances between the first annotation and second one are 0.19 ± 0.09 mm and the maximum error is 0.36 mm. Therefore, the result indicates that there were no significant intraobserver differences. To determine interobserver variation, the second clinical expert was invited to perform the manual annotation on the same randomly selected dataset. The error distances between the first expert's annotation and the second expert's annotation are 0.22 ± 0.11 mm and the maximum error is 0.43 mm. Both annotations were used as the gold standard and two sets of average error distances between a detected object and one of corresponding gold‐standard objects were calculated. The p‐values of t‐tests were calculated for two sets of average error distances. The P‐values was 0.24, which indicates that there were no significant interobserver differences.
3.A. CS and lasso catheter detection results
The results of CS catheter detection and lasso catheter detection using X‐ray images from EP cases are shown in Table 1.
Table 1.
CS and lasso catheter detection results
| CS catheter | Lasso ring | Lasso body | |
|---|---|---|---|
| Raw errors (mm) | 0.95 ± 0.89 | 0.89 ± 0.68 | 1.03 ± 0.94 |
| Successful rate | 91.4% | 86.3% | 84.8% |
| Errors after removing failed images (mm) | 0.56 ± 0.28 | 0.64 ± 0.36 | 0.66 ± 0.32 |
| Missing rate | 7.2% | 4.3% | 9.8% |
There are two error measurements in Table 1. The first one (raw errors) is from all test images. The second one excludes the images where the detection has failed. The missing rate is defined as the percentage of detected wire objects which the majority (>50%) of points have the error distances larger than the threshold (2.5 mm). Missing rate can tell what percentage of target catheters is missed. The missed catheter is mainly because the detection framework obtains the wrong catheter when the cost function gives the wrong answer. Missing rate is lower for the lasso ring than the CS catheter. This explains why the errors of the lasso ring detection for all images are lower than the errors of the CS catheter detection. In 95.7% of images, the detection framework detects the correct lasso ring object. But 9.4% ((100%–86.3%)–4.3%) of images has failed detection because some parts of detected ring have larger errors. Figure 13 gives two examples.
Figure 13.
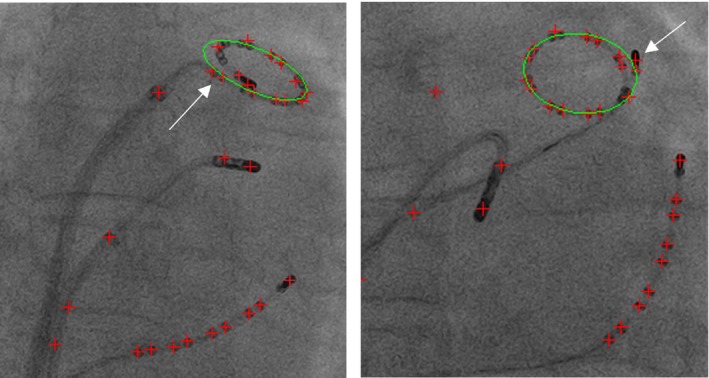
Two examples of failed lasso ring detection (some areas have large errors). Green ellipse is the detected lasso ring. Red crosses are detected blob positions. Both have the large deviation of the fitted ellipse, which is distracted by the blobs nearby (either by the catheter tip electrode or last few electrodes on the lasso catheter). [Color figure can be viewed at http://www.wileyonlinelibrary.com]
In the other hand, CS catheter has higher detection errors and higher missing rate but the successful rate is also higher if compared with the lasso catheter detection. The failed cases often happen when only part of CS catheter was visible within the X‐ray images. The detection framework completely missed the CS catheter and detected the wrong catheter. The other failed cases are caused by detecting the wrong part of catheter when the CS catheter is overlapped with other catheters. Two examples of successful detection are shown in Figs. 14 and 15 gives two failed examples.
Figure 14.
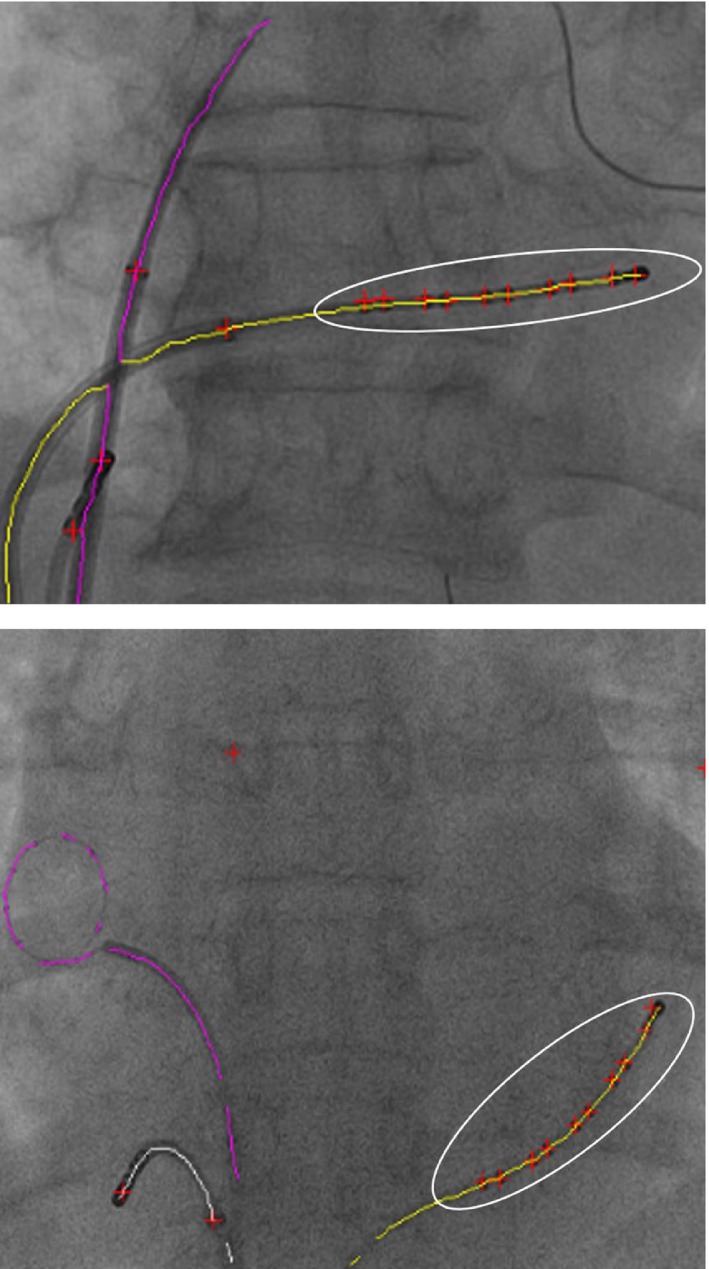
Two examples of successful CS catheter detection. The white ellipse highlights the selected group of blobs on the detected CS catheter. Red crosses are detected blobs. [Color figure can be viewed at http://www.wileyonlinelibrary.com]
Figure 15.
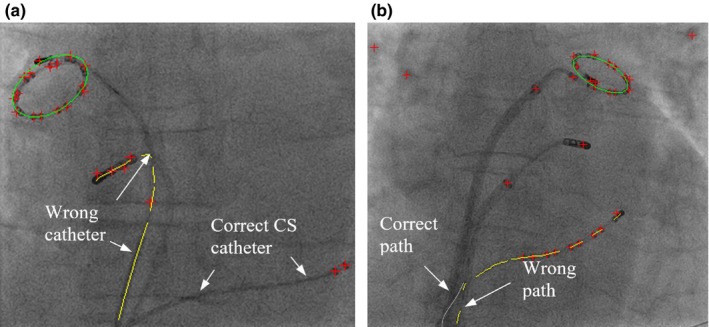
Two examples of failed CS catheter detection. Yellow lines are detected CS catheters. Red crosses are detected blob positions. (a) Failure due to the detected wrong catheter. (b) Failure due to overlapping catheters near the image edge. There are small deviations of the fitted ellipses because of the nearby catheter tip electrode. [Color figure can be viewed at http://www.wileyonlinelibrary.com]
The lasso body detection has the highest detections error and highest missing rate. This is because the main body of lasso catheter is more frequently overlapped with other catheters than the CS catheter. Step‐by‐step of detection workflow and results for both CS and lasso catheter are presented in Fig. 17.
3.B. Guidewire and guiding catheter detection results
Overall, the detection errors for guidewires and guiding catheters are 0.62 ± 0.48 and successful rate is 83.5%. The individual errors for guidewires or guiding catheters were given in Table 2. Similar to catheter detection results, both raw results and results after removing failed cases were calculated. The results with or without a local KNN image classifier were also calculated.
Table 2.
Detect errors for guidewires and guiding catheters
| KNN classifier | Guiding catheter | Guidewire |
|---|---|---|
| With | ||
| Raw errors (mm) | 1.08 ± 0.89 | 0.93 ± 0.72 |
| Successful rate | 82.5% | 85.2% |
| Errors (mm)a | 0.68 ± 0.42 | 0.59 ± 0.31 |
| Missing rate | 7.6% | 6.5% |
| Without | ||
| Raw errors (mm) | 1.93 ± 1.38 | 1.29 ± 0.96 |
| Successful rate | 72.4% | 79.3% |
| Errors (mm)a | 0.73 ± 0.46 | 0.61 ± 0.34 |
| Missing rate | 18.4% | 10.8% |
The second error measurement excludes all failed detection images.
Guiding catheters have larger errors and higher missing rates when the KNN image classifier was not integrated into the detection framework. This is due to lower image contrast for guiding catheters compared with guidewires as guiding catheters are mainly made from plastic materials and guidewires are made from high density metal wires. Therefore, under X‐ray, guiding catheters have lower image contrast. The wire path reconstruction algorithm was sometimes distracted from surrounding image artifacts (Fig. 16 gives an example). However, after the KNN local image classifier removed majority of image artifacts, guiding catheter, and guidewires has similar results.
Figure 16.
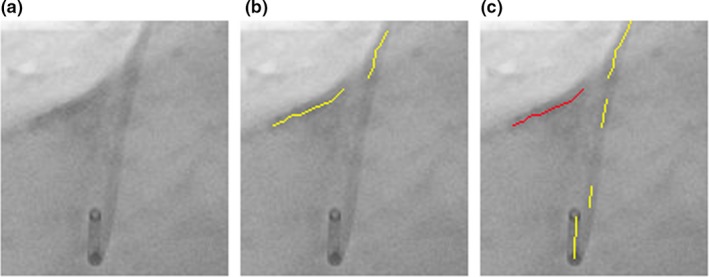
(a) Original image. (b) The wire path reconstruction distracted by image artifacts. (c) The correct wire path (yellow lines). The detected image artifacts (red lines). [Color figure can be viewed at http://www.wileyonlinelibrary.com]
In order to evaluate the performance of KNN classifier, both false positive (FP) rate and true negative (TN) rate are calculated among all test images (4726 images) which are from treatment of CHD. FP is defined as the image artifacts are classified as wire objects and TN is defined as the wire objects are labeled as image artifacts. The results show that TN rate is 4.1% and FP rate is 7.4%. Some artifacts are classified as wire objects because they are overlapped with a wire object or they are from contrast agent injection (Fig. 13).
Finally, step‐by‐step of detection workflow and results for both guidewires and guiding catheters are presented in Fig. 17.
Figure 17.
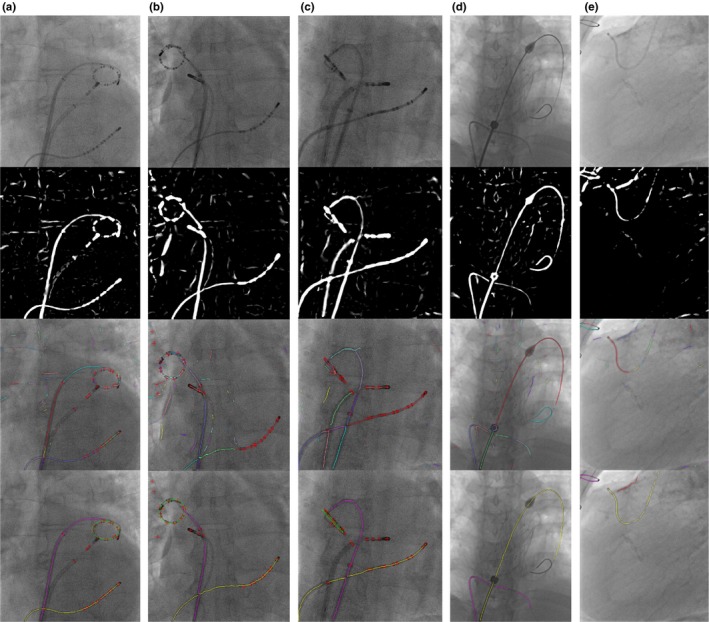
Detection workflow. From top to bottom, the first row are original images. The second row are images after applying vessel filter. The third row are results of centreline extraction and segmentation. The bottom row are final detection results. The figures are best viewed in color. (a) (b) (c) CS and lasso catheter detection. In the final result image, the yellow line is CS catheter, the green circle or ellipse is lasso catheter ring and the purple line is lasso catheter body. Red crosses are the locations of blobs. (d) Guidewire detection. The yellow and purple line are two guidewires. (e) Guiding catheter detection. The yellow line is the guiding catheter. The purple line is the other wire object. The red line is the image artifacts (calcium deposit). [Color figure can be viewed at http://www.wileyonlinelibrary.com]
The tip detection precision is also evaluated. The error is defined as the distance between the detected guidewire or catheter tip position and manual annotated tip position. The error is 0.57 ± 0.38 mm.
The major computational load of the proposed detection framework is the vessel enhancement filter algorithm. The software of the proposed framework was developed using OpenCV and the performance was evaluated on an Intel Core i7 2.9 GHz laptop with a single‐threaded CPU implementation. The low level image processing functions of OpenCV are accelerated by using the Intel IPP library which provides high performance low‐level routines for imaging. Currently, a frame rate of 15 fps is achieved for CS catheter detection, guidewire, and guiding catheter detection without the KNN classifier. A frame of 12 fps is achieved for simultaneous detection of CS and lasso catheters. The frame rate is reduced to 11 fps for guidewire and guiding catheter detection with the KNN classifier.
4. Conclusion and discussions
This paper presents and validates a novel and real‐time catheter and guidewire detection framework. The proposed framework does not require any user interaction or prior models. The novelty of proposed framework is the combination of blob detection and wire detection without adding extra computational workload. Combining the electrode (blob) pattern and wire pattern makes the framework robust against other wire‐like objects or image artifacts. Therefore, it can efficiently and robustly work on low‐dose X‐ray images. The framework also enables the fully automatic recognition of CS and lasso catheters based on the pattern of electrodes. As the proposed framework detects both electrode positions and the entire length of a catheter, it opens up more clinical applications. For example, the wire body of a CS catheter can be used for both automatic 2D to 3D registration10 and motion compensation9 in image guided applications for cardiac interventional procedures. Both electrode points and the wire body of a detected catheter could be also used together in the accurate 3D reconstruction of the detected catheter. Electrode points are used as key points for phase matching in biplane image sequences.33 The biplane image sequences are the two image sequences acquired in different acquisition angles. Phase matching is to match the cardiac motion and respiratory motion phases, which can largely reduce 3D reconstruction errors. The accurate 3D models of catheters could provide enhanced functionality during procedures for guidance and also for postprocedural analysis.
The proposed framework can be also used for detecting guidewires and guiding catheters. However, the electrode pattern might not be found in the target object. In order to distinguish between the wire‐like target objects and image artifacts, a localized machine learning algorithm (KNN classifier) is used. As the KNN classifier has low FP and TN rates, it can reliably identify image artifacts and reduce the influence of artifacts for wire path reconstruction algorithm. However, there could be other real wire objects such as metal wires left by the open‐heart surgery (Fig. 11) or ECG cables. The KNN classifier cannot identify them as artifacts as those wires has smooth edges on the both sides after applying Sobel filter. However, those wires only distract the path reconstruction algorithm when they are closely overlapping with the target wire object.
Currently, the proposed framework has achieved the frame rate of up to 15 fps. This frame rate is considered as real‐time for cardiovascular intervention procedures as the average maximum frame rate for modern intervention X‐ray systems is 15 fps. In the low dose X‐ray image setting, the frame rate will drop to average 7.5 fps to reduce X‐ray radiation doses. Therefore, our detection framework is sufficient for using in real‐time imaging applications. Furthermore, if the detected models of catheters or guidewires could be fed into a template‐based tracking method, it not only can produce an even faster tracking method but also can largely increase the accuracy and successful rate compared with the original detection framework. Because the proposed frame work does not require any user interaction or prior models, it could autonomously detect and recognize all wire objects if knowledge about catheters and guidewires such as the number of electrodes, catheter tip size, guiding catheter diameter and etc. are passed onto the detection framework. This could lead to a context‐aware detection framework. For example, it can automatically recognize the stage of procedures as in the different stage of procedure different catheters are used.
In conclusion, a fully automatic detection framework is presented for the detection of the electrode catheter as well as guiding catheters and guidewires in real time. The framework not only detects the target wire objects, but also the electrode positions of catheters. This could lead to wider clinical applications.
Conflict of interest
The authors have no conflicts to disclose.
Supporting information
Video S1: Guidewire detection demo video.
Video S2: CS and Lasso catheter detection demo video.
Video S3: 4 Examples of CS and Lasso catheter detection.
Acknowledgments
This research was supported by the National Institute for Health Research (NIHR) Biomedical Research Centre based at Guy's and St Thomas’ NHS Foundation Trust and King's College London and a NIHR research grant II‐LB‐0814‐20001. The views expressed are those of the author(s) and not necessarily those of the NHS, the NIHR or the Department of Health. Concepts and information presented are based on research and are not commercially available. Due to regulatory reasons, the future availability cannot be guaranteed.
References
- 1. Ector J, De Buck S, Huybrechts W, et al. Biplane three‐dimensional augmented fluoroscopy as single navigation tool for ablation of atrial fibrillation: accuracy and clinical value. Heart Rhythm. 2008;5:957–964. [DOI] [PubMed] [Google Scholar]
- 2. Knecht S, Skali H, O'Neill MD, et al. Computed tomography‐fluoroscopy overlay evaluation during catheter ablation of left atrial arrhythmia. Europace. 2008;10:931–938. [DOI] [PubMed] [Google Scholar]
- 3. Sra J, Narayan G, Krum D, et al. Computed tomography‐fluoroscopy image integration‐guided catheter ablation of atrial fibrillation. J Cardiovasc Electrophysiol. 2007;18:409–414. [DOI] [PubMed] [Google Scholar]
- 4. Rhode KS, Sermesant M, Brogan D, et al. A system for real‐time XMR guided cardiovascular intervention. IEEE Trans Med Imaging. 2005;24:1428–1440. [DOI] [PubMed] [Google Scholar]
- 5. Mountney P, Behar JM, Toth D, et al. A planning and guidance platform for cardiac resynchronization therapy. IEEE Trans Med Imaging. 2017;36:2366–2375. [DOI] [PubMed] [Google Scholar]
- 6. Orlov MV, Hoffmeister P, Chaudhry GM, et al. Three‐dimensional rotational angiography of the left atrium and esophagus: a virtual computed tomography scan in the electrophysiology lab. Heart Rhythm. 2007;4:37–43. [DOI] [PubMed] [Google Scholar]
- 7. Al‐Ahmad A, Wigström L, Sandner‐Porkristl D, et al. Time‐resolved three‐dimensional imaging of the left atrium and pulmonary veins in the interventional suite: a comparison between multisweep gated rotational three‐dimensional reconstructed fluoroscopy and multislice computed tomography. Heart Rhythm. 2008;5:513–519. [DOI] [PubMed] [Google Scholar]
- 8. Nolker G, Gutleben KJ, Marschang H, et al. Three‐dimensional left atrial and esophagus reconstruction using cardiac C‐arm computed tomography with image integration into fluoroscopic views for ablation of atrial fibrillation: accuracy of a novel modality in comparison with multislice computed tomography. Heart Rhythm. 2008;5:1651–1657. [DOI] [PubMed] [Google Scholar]
- 9. Ma Y, King A, Gogin N, et al. Clinical evaluation of respiratory motion compensation for anatomical roadmap guided cardiac electrophysiology procedures, IEEE Transactions on Biomedical Engineering, 2011. [DOI] [PubMed]
- 10. Truong M, Liu A, Housden J, Penney G, Pop M, Rhode K. Novel looped‐catheter‐based 2D‐3D registration algorithm for MR, 3DRX and X‐ray images: validation study in an ex‐vivo heart. STACOM, LNCS. 2017;10124:152–162. [Google Scholar]
- 11. Alhrishy M, Toth D, Narayan SA, et al. A machine learning framework for context specific collimation and workflow phase detection, CMBBE, 2018.
- 12. Yilmaz A, Javed O, Shah M. Object tracking: a survey. ACM Comput Surv. 2006;38:13. [Google Scholar]
- 13. Kass M, Witkin A, Terzopoulos D. Snakes: active contour models”. Int J Comput Vision. 1987;1():321–331. [Google Scholar]
- 14. Zhu SC, Yuille AL. Forms: a flexible object recognition and modeling system. Int J Comput Vision. 1996;20:187–212. [Google Scholar]
- 15. Schenderlein M, Stierlin S, Manzke R, Rasche V, Dietmayer K. Catheter tracking in asynchronous biplane fluoroscopy images by 3D B‐snakes, SPIE Medical Imaging, 2010; 7625.
- 16. Brost A, Liao R, Hornegger J, Strobel N. 3‐D respiratory motion compensation during EP procedures by image‐based 3‐D lasso catheter model generation and tracking. MICCAI, LNCS. 2009;5761:394–401. [DOI] [PubMed] [Google Scholar]
- 17. Brost A, Liao R, Hornegger J, Strobel N. Respiratory motion compensation by model‐based catheter tracking during EP procedures. Med Image Anal. 2010;14:695–706. [DOI] [PubMed] [Google Scholar]
- 18. Wu W, Chen T, Barbu A, et al. Learning‐based hypothesis fusion for robust catheter tracking in 2D X‐ray fluoroscopy. CVPR, 2011:1097–1104.
- 19. Yatziv L, Chartouni M, Datta S, Sapiro G. Toward multiple catheters detection in fluoroscopic image guided interventions. IEEE Trans Inf Technol Biomed. 2012;16:770–781. [DOI] [PubMed] [Google Scholar]
- 20. Ma Y, King AP, Gogin N, et al. Real‐time respiratory motion correction for cardiac electrophysiology procedures using image‐based coronary sinus catheter tracking. MICCAI, LNCS. 2010;6361:391–399. [DOI] [PubMed] [Google Scholar]
- 21. Ma Y, Gogin N, Cathier P, et al. Real‐time x‐ray fluoroscopy‐based catheter detection and tracking for cardiac electrophysiology interventions. Med Phys. 2013;40:071902‐1–071902‐13. [DOI] [PubMed] [Google Scholar]
- 22. Palti‐Wasserman D, Brukstein AM, Beyar R. Identifying and tracking a guide wire in the coronary arteries during angioplasty from x‐ray images. IEEE Trans Biomed Eng. 1997;44:152–164. [DOI] [PubMed] [Google Scholar]
- 23. Baert SAM, Viergever MA, Niessen WJ. Guide wire tracking during endovascular interventions. IEEE Trans Med Imaging. 2003;22:965–972. [DOI] [PubMed] [Google Scholar]
- 24. Barbu A, Athitsos V, Georgescu B, Boehm S, Durlak P, Comaniciu D Hierarchical learning of curves application to guidewire localization in fluoroscopy, CVPR, 2007.
- 25. Wang P, Chen T, Zhu Y, Zhang W, Zhou SK, Comaniciu D. Robust guidewire tracking in fluoroscopy. CVPR; 2009. [Google Scholar]
- 26. Chen BJ, Wu Z, Sun S, Zhang D, Chen T. Guidewire tracking using a novel sequential segment optimization method in interventional x‐ray videos, Proc IEEE Int Symp Biomed Imaging, 2016: 103–106.
- 27. Wang L, Xie XL, Bian GB, Hou ZG, Cheng XR, Prasong P. Guide‐wire detection using region proposal network for X‐ray image‐guided navigation, International Joint Conference on Neural Networks, 2017; 3169–3175.
- 28. Pauly O, Heibel H, Navab N. A machine learning approach for deformable guide‐wire tracking in fluoroscopic sequences, MICCAI, 2010. [DOI] [PubMed]
- 29. Frangi AF, Niessen WJ, Vincken KL, Viergever MA. Multiscale vessel enhancement filtering, MICCAI, 1998.
- 30. Otsu N. A threshold selection method from gray‐level histograms. IEEE Trans Syst Man Cybern. 1979;9:62–66. [Google Scholar]
- 31. Fazlali HR, Karimi N, Soroushmehr SMR, et al. Vessel region detection in coronary X‐ray angiograms, International Conference on Image Processing, 2015.
- 32. Zhang TY, Suen CY. A fast parallel algorithm for thinning digital patterns. Commun ACM. 1984;27:236–239. [Google Scholar]
- 33. Panayiotou M, King AP, Ma Y, et al. A statistical model of catheter motion from interventional x‐ray images: application to image‐based gating. Phys Med Biol. 2013;58:7543–7562. [DOI] [PubMed] [Google Scholar]
Associated Data
This section collects any data citations, data availability statements, or supplementary materials included in this article.
Supplementary Materials
Video S1: Guidewire detection demo video.
Video S2: CS and Lasso catheter detection demo video.
Video S3: 4 Examples of CS and Lasso catheter detection.


