

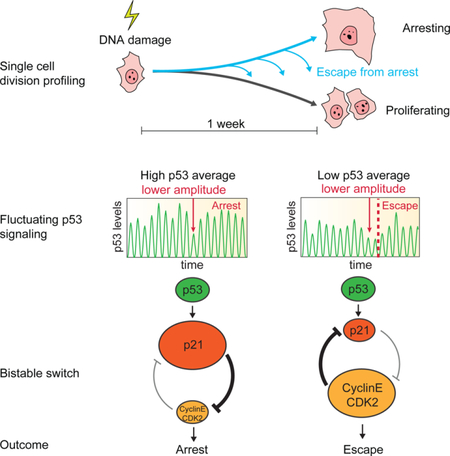
Summary
Biological signals need to be robust and filter small fluctuations, yet maintain sensitivity to signals across a wide range of magnitudes. Here we studied how fluctuations in DNA damage signaling relate to maintenance of long-term cell cycle arrest. Using live-cell imaging, we quantified division profiles of individual human cells in the course of one week after irradiation. We found a subset of cells that initially establish cell cycle arrest, and then sporadically escape and divide. Using fluorescent reporters and mathematical modeling, we determined that fluctuations in the oscillatory pattern of the tumor suppressor p53 trigger a sharp switch between p21 and CDK2, leading to escape from arrest. Transient perturbation of p53 stability mimicked the noise in individual cells and was sufficient to trigger escape from arrest. Our results show that the self-reinforcing circuitry that mediates cell cycle transitions can translate small fluctuations in p53 signaling into large phenotypic changes.
Keywords: Systems biology, live-cell imaging, DNA damage, cell cycle arrest, signaling dynamics, p53, single cells, heterogeneity
Graphical Abstract
eTOC Blurb
Reyes et al. show that individual human cells vary in their ability to maintain cell cycle arrest in the course of one week after DNA damage. They show that fluctuations in the oscillatory dynamics of the tumor suppressor p53 can trigger a switch from an arrested to a proliferative state.
Introduction
In response to DNA damage, proliferating cells can either repair the damage and resume growth, or activate anti-proliferative programs such as cell death (apoptosis) or senescence, a state characterized by the long-term enforcement of cell cycle arrest and the loss of recovery potential (Fig 1A). While pro- apoptosis therapy has been used for several decades as a tool for destroying the growth of cancerous cells, recent studies also highlighted the therapeutic potential of pro-senescence cancer therapy (Collado and Serrano, 2010; Nardella et al., 2011; Xue et al., 2011). However, as opposed to apoptosis, which is a terminal cell fate, senescing cells require continuous activation of the pathways responsible for maintaining the arrested state (Beauséjour et al., 2003; Dirac and Bernards, 2003) (Figure 1A). It is unclear how senescing cells respond to fluctuations in these pathways over prolonged times.
Figure 1. DNA damage leads to heterogeneous division profiles over long timescales.
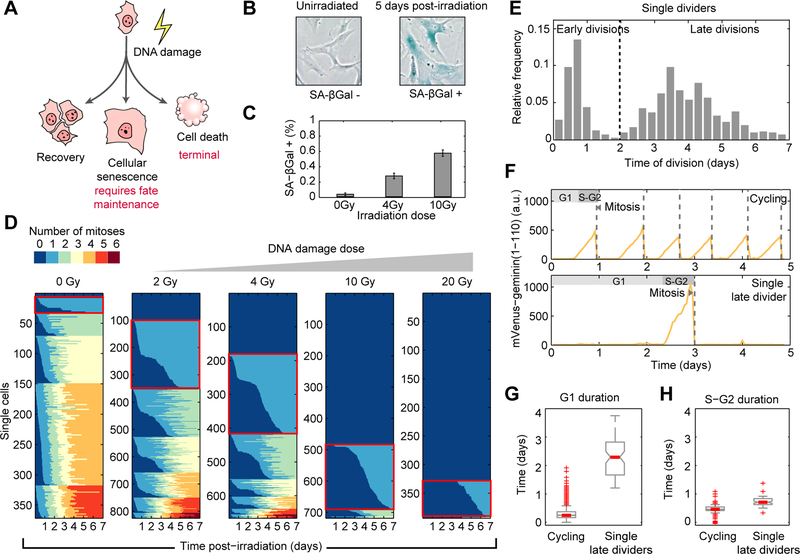
(A) DNA damage can lead to different cellular outcomes, including terminal cell fates. Cellular senescence requires active maintenance.
(B) Representative images of cells assayed for senescence associated β-galactosidase (SA-β-gal) activity 6 days post-irradiation.
(C) Frequency of SA-β-gal positive cells 6 days post-irradiation, as a function of damage dose.
(D) Division profiles obtained after tracking individual telomerase-immortalized primary cells and annotating mitoses in the course of one week after DNA damage. Panels aggregate single cells exposed to a particular irradiation dose. Each row represents the division profile of an individual cell over time. Colors change upon mitosis. Cells are grouped by their total number of mitoses, and ordered by the timing of their first mitosis. Red boxes highlight the single divider populations.
(E) Distribution of mitosis timing in single dividers.
(F) Single cell quantification of mVenus-hGeminin(1–110) reporter for a multiple divider (top) and a late divider (bottom).
(G, H) Distributions of G1 and S/G2 duration in unirradiated cycling cells or irradiated late dividers (n = 77 cells per condition).
The tumor suppressor protein p53 is a master transcriptional regulator of the response of human cells to DNA damage (Lakin and Jackson, 1999). Upon cellular exposure to ionizing radiation, p53 stabilization leads to the transcriptional induction of hundreds of genes involved in DNA repair, cell cycle arrest, apoptosis and cellular senescence (Riley et al., 2008). In addition, p53 regulates the expression of proteins involved in controlling its levels. In particular, the direct p53 transcriptional target Mouse- Double-Minute 2 (MDM2) E3 ubiquitin ligase tags p53 for proteosomal-dependent degradation (Haupt et al., 1997), forming a negative feedback loop. Dynamically, the interaction of p53 and MDM2 generates oscillatory dynamics of p53 activation characterized by a stereotyped frequency and noisy amplitude (Lahav et al., 2004). While pulsatile p53 dynamics have been quantified in multiple cell lines over 24h after DNA damage (Geva-Zatorsky et al., 2006; Stewart-Ornstein and Lahav, 2017), the long- term evolution of such dynamics has not been explored. In addition, while it was shown that activation of p53 during G2 is sufficient to trigger entry into senescence (Krenning et al., 2014), it is not known the extent to which heterogeneity in p53 signaling over time affect the long term maintenance of the senescence state in individual cells.
Here, we studied the way fluctuations in DNA damage signaling relate to cell fate heterogeneity in the long-term response of human cells to ionizing radiation. Using live-cell imaging, we identified a subpopulation of cells that initially established cell cycle arrest, but escaped such state in the presence of damage through sporadic cell cycle re-entry events spanning ~1 week after irradiation. Using fluorescent reporters for p53 and its downstream target, the CDK inhibitor p21, we showed that cell-to-cell variation in the level of these proteins contributes to heterogeneity in the ability of individual cells to maintain the arrested state over long timescales. We further showed that escape from cell cycle arrest is characterized by a sharp switch between p21 levels and CDK2 activity. By analyzing natural variability in p53 signaling in the vicinity of this transition, we showed that transient fluctuations in p53 pulse amplitude are amplified into escape from arrest as a consequence of the double-negative feedback interaction between p21 and CDK2. Taken together, we identified two levels at which heterogeneity in DNA damage signaling shapes the long term ability of human cells to maintain cell cycle arrest in the presence of persistent DNA damage: (i) low historical average p53 amplitude defines a permissive state in which (ii) transient decrease of p53 pulse amplitude triggers escape events. Our work revealed an unanticipated heterogeneity in the long-term potential to revert the arrested state shaped by natural variability in DNA damage signaling.
Results
Long-term live cell imaging reveals heterogeneity in cell cycle arrest maintenance after DNA damage.
We used fluorescent live cell imaging to study DNA damage-induced senescence in individual human cells. We irradiated cells and developed a semi-automated tracking method to quantify the number and timing of division events that an isogenic population of cells experience in the course of one week, during which they undergo senescence (Krenning et al., 2014) (Figure 1B, C and Movie S1). Division profiles revealed large heterogeneity between single cells, ranging from cells that did not divide at all, through cells that divided only once (single dividers Fig 1D red squares), and cells that showed multiple divisions (Figure 1D), the proportion of which changed with irradiation dose (Figure 1D). Single dividers exhibited bimodality in their mitosis timing: the first phase of divisions occurred within the first day after DNA damage, and the second phase started ~2 days post-irradiation and was broadly distributed, spanning an entire week (Figure 1E). Note that single dividers were present in every dose of DNA damage, ranging from non-physiological levels that lead to loss of recovery potential, to those that are used in radiation therapy (Lomax et al., 2013). We identified single dividers even in non-irradiated controls, suggesting that heterogeneity in timing and number of divisions is present in cells that engage in a long-term arrested program due to DNA damage generated during regular cycling even without an external source of stress. Using the mVenus-hGeminin(1–110) fluorescent reporter for cell cycle progression (Sakaue-Sawano et al., 2008) (Figure 1F), we found that heterogeneity in the second phase is mainly attributed to time spent in a G0/G1 state (Figure 1F-H), suggesting that late dividing cells initially arrested in G1 and then escaped from the arrest. Taken together, these results revealed that arrested cells hold the potential for reversion of cell cycle arrest for prolonged timescales (~1 week).
Escaper cells re-enter the cell cycle in the presence of DNA damage
We next sought to understand the molecular features that underlie heterogeneity in the long-term maintenance of cell cycle arrest in response to ionizing radiation. Over long timescales, unrepaired sites of damage become large chromatin domains, known as persistent DNA damage foci (Fumagalli et al., 2014). Given the active role that residual DNA damage plays in the maintenance of cell cycle arrest and senescence (Fumagalli, et al. 2012), we asked whether complete repair of DNA damage was a necessary condition for cell cycle re-entry after a prolonged period of cell cycle arrest. We used a previously established mCherry-53bp1 fluorescent fusion protein to quantify the amount of DNA damage in live individual cells (Dimitrova et al., 2008; Karanam et al., 2012). Upon irradiation, mCherry-53bp1 accumulated at sites of double stranded DNA breaks, forming discrete foci (Figure 2A). We showed that the mCherry-53bp1 reporter co-localizes with the canonical double stranded DNA breaks marker γ- H2AX after irradiation, making it a suitable proxy to quantify the persistence of DNA damage in our experimental live cell system (Figure 2B).
Figure 2. Cells escape G1 arrest in the presence of DNA damage.
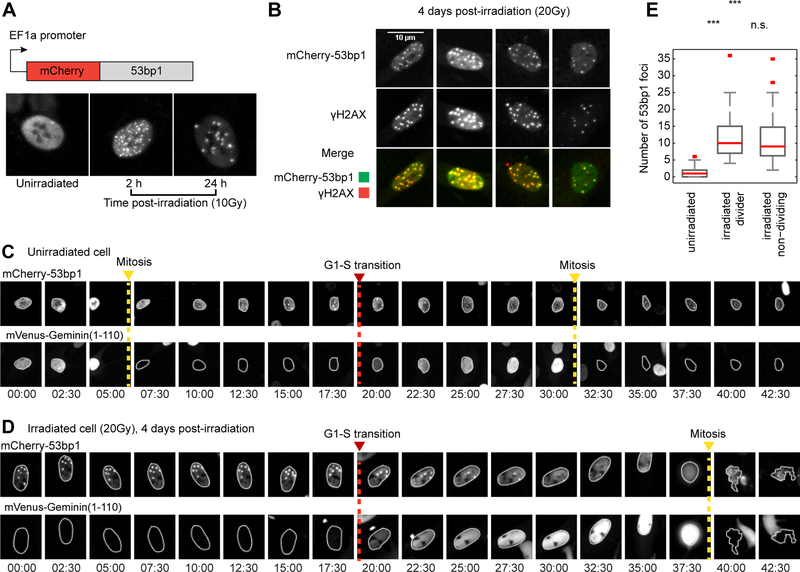
(A) Cells expressing mCherry-53bp1 were exposed to 10Gy gamma irradiation. DNA damage leads to foci of mCherry-53bp1 (2h post-irradiation); over time the number of foci decreases (24h post- irradiation).
(B) Cells expressing mCherry-53bp1 received 20Gy gamma irradiation and were fixed 4 days post-DNA damage. To assess the reliability of mCherry-53bp1 as a marker of persistent DNA damage foci cells were immunostained for the canonical DNA damage marker phospho-γ-H2A.X. Four representative cells showing co-localization of mCherry-53bp1 and γ-H2AX are shown.
(C) Non-irradiated cells co-expressing mCherry-53bp1 and mVenus-hGeminin(1–110) fluorescent reporters were imaged for 2 days. Image strips of these two markers are shown for a single cell tracked through two mitosis events. Tracked cell is outlined in each image. mVenus-hGeminin(1–110) is degraded upon mitosis (yellow dashed line) and starts accumulating upon S-phase entry (red dashed line). mCherry-53bp1 shows spontaneous foci formation and resolution throughout the cell cycle.
(D) Cells received 20Gy gamma irradiation and were imaged for 48h, 4 days after DNA damage. Image strips of mCherry-53bp1 and mVenus-hGeminin(1–110) are shown for an individual cell tracked through an arrest escape event, as evidenced by the onset of mVenus-hGeminin(1–110) accumulation (red dashed line). mCherry-53bp1 shows the presence of DNA damage prior to escape from cell cycle arrest.
(E) Distribution of the number of 53bp1 foci in non-irradiated cells in G1, irradiated escaper cells and cells that maintain cell cycle arrest in the timeframe of the experiment.
To test whether late dividing cells undergo G1-S transitions in the presence of DNA damage, we treated cells with a high dose of γ-irradiation and imaged them 4 days after DNA damage, for 48h. We selected a dose of 20Gy, after which cells either don’t divide or divide only once within the timescale of our observations (Figure 1D). This allowed us to avoid the confounding effect of a small subpopulation of cells that recover from damage and divide multiple times after lower doses of DNA damage. We used the mVenus-hGeminin(1–100) reporter (Sakaue-Sawano et al., 2008) to identify entry into S phase and the mCherry-53bp1 to measure DNA damage in each cell. We found that cells that underwent G1-S transitions did so with DNA damage. Specifically, they exhibited a significantly higher number of 53bp1 foci than unirradiated cells (Figure 2C-E), implying that complete repair of DNA damage is not necessary to trigger cell cycle re-entry in long-term arrested cells. Notably, within the irradiated population, there was no significant difference between the number of 53bp1 foci in cells that escaped the arrest and those that remained arrested (Figure 2E). These results suggest that late divisions do not reflect heterogeneity in the presence or amount of DNA damage; rather, they result from variability in the way individual cells process information about the presence of DNA damage through downstream signaling. We termed these late dividing cells ‘escapers’.
Cell-to-cell variation in p53 and p21 contributes to heterogeneity in arrest maintenance
We next sought to determine whether escape events can be explained by levels of the molecular players that control cell cycle arrest. The p53 signaling pathway links DNA damage sensing with cell cycle arrest (Lakin and Jackson, 1999) (Figure 3A). Upon irradiation, the tumor suppressor protein p53 transcriptionally activates hundreds of genes involved in DNA repair, cell cycle arrest and apoptosis (Riley et al., 2008). One of such target genes, the Cyclin Dependent Kinase (CDK) inhibitor p21 (El-Deiry et al., 1993), directly enforces G1 arrest through sequestration of Cyclin-CDK complexes (Brugarolas et al., 1995; Harper et al., 1993; Xiong et al., 1993). Both p53 and p21 are necessary to establish cell cycle arrest after damage in our experimental system (Figure 3B). Note that knockdown of p53 either 2 days or 7 days post-irradiation triggered cell cycle re-entry in arrested cells (Figure 3C), demonstrating the important role that p53 signaling plays for both the establishment and maintenance of the arrested state.
Figure 3. Cell-to-cell variation in DNA damage signaling contributes to heterogeneity in arrest maintenance.
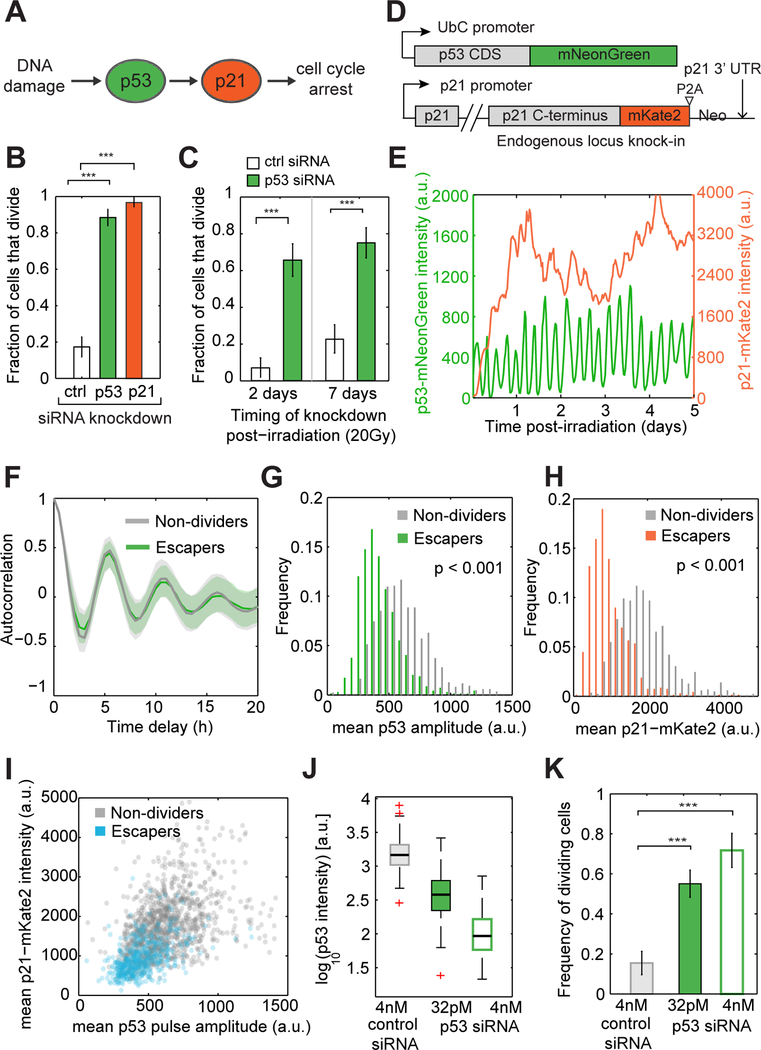
(A) In response to DNA damage p53 transcriptionally activates p21 which arrest the cell cycle.
(B) Fraction of cells that divide after siRNA mediated depletion of p53 or p21, 2 days post-DNA damage (20Gy). n > 150 cells per condition, *** p < 0.001, two-tailed binomial proportion test.
(C) siRNA mediated depletion of p53 at 2 days or 7 days post-DNA damage leads to cell cycle re-entry. n > 90 cells per condition, *** p < 0.001, two-tailed binomial proportion test.
(D) A fluorescent fusion protein and endogenous tagging allows quantification of p53 and p21 dynamics in individual cells.
(E) Representative p53 and p21 trajectories of a single cell exposed to 10Gy γ-irradiation.
(F) Autocorrelation functions estimated from p53 trajectories of non-dividers (n = 1105 cells) or escapers (n = 503 cells). Bold lines and shaded areas correspond to median and interquartile range, respectively.
(G, H) Distributions of mean p53 pulse amplitude (G) and mean p21-mKate2 intensity (H) after γ- irradiation in escapers (n = 503 cells) and non-dividers (n = 1105 cells).
(I) Correlation of mean p53 pulse amplitude and mean p21-mKate2 intensity. Each dot represents a single cells.
(J) Distributions of p53-mNeonGreen intensity in p53 (4nM and 32pM) or control siRNA treated cells, 3 days post-irradiation (20Gy).
(K) Fraction of cells that divide within 2 days after siRNA knockdown (I). n > 100 cells per condition, *** p < 0.001, two-tailed binomial proportion test.
To quantitatively measure the relationship between p53, p21 and escape from arrest in individual cells we established a cell line harboring a p53 fluorescent fusion protein (Lahav et al., 2004) and applied a recently developed CRISPR-Cas9 based method (Stewart-Ornstein and Lahav, 2016) to endogenously tag p21 with the fluorescent protein mKate2 (Figure 3D, Figure S1). After irradiation, we observed that oscillatory p53 dynamics, which were previously described during the first 24h post-irradiation (Geva-Zatorsky et al., 2006) persisted for the entire experimental time (5 days) (Figure 3E, Movie S2). In agreement with studies on single cell p53 dynamics in other cell lines (Loewer et al., 2013; Stewart-Ornstein and Lahav, 2017), p53 oscillations had a stereotyped period of ~5.5h (Figure 3F) and noisy amplitude (Figure 3E) which was previously attributed to arise from intrinsic fluctuations in the feedback control circuit that generates p53 pulses (Geva-Zatorsky et al., 2006). Following p53 activation, p21 levels increased (Figure 3E, Movie S2). The derivative of p21 trajectories revealed a pulsatile rate of protein accumulation that matched upstream p53 dynamics with a time delay of ~1.5h (Figure S2). Beyond this tight relationship at the level of dynamics, we observed a correlation between the amplitude of individual p53 pulses and subsequent p21 protein production pulses (Spearman’s r = 0.41), suggesting that fluctuations in p53 pulse amplitude contribute to temporal variability in p21 protein levels (Figure S2).
We next asked whether general features of p53 and p21 trajectories can explain the difference between escaper and non-divider cells. While the period of p53 oscillations was similar between non-dividing and escaper cells (Figure 3F), escapers fluctuated around a lower averaged amplitude of p53 compared to non-dividers (Figure 3G). Similar behavior was observed for the averaged levels of p21 (Figure 3H), which correlated with p53 averaged amplitude at the single cell level (Figure 3I). Consistently, we were able to increase the percentage of cell cycle re-entry of arrested cells by partial siRNA-based knockdown of p53 (Figure 3J, K). Taken together, our results show that cell-to-cell variability in the levels of p53 and p21 contribute to heterogeneity in the long-term maintenance of cell cycle arrest after irradiation, with escapers having overall lower averaged levels of p53 and p21 than non-dividing cells.
Escape from cell cycle arrest is characterized by a sharp switch in p21 levels and CDK2 activity
While the distributions of p53 and p21 differed significantly between non-dividers and escapers, there was an extensive overlap between them (Figure 3G, H), suggesting that properties of p53 and p21 trajectories beyond average levels might be linked to the escape from arrest. To further understand the series of molecular events leading to arrest escape, we followed p21 dynamics in individual cells several hours before cell cycle re-entry. While non-dividers maintained sustained p21 levels through the entire duration of the experiment (Figure 4A), p21 was sharply degraded upon escape from G1 arrest and S- phase entry (Figure 4B, Figure S3). Note that this sharp degradation of p21 in escaper cells was preceded by significantly high levels of p21 compared to regularly dividing cells that enter S phase (Figure S4), arguing that elevated levels of p21 are insufficient for preventing escape.
Figure 4. Escape from cell cycle arrest is characterized by a sharp switch in the balance between p21 and CDK2 activity.
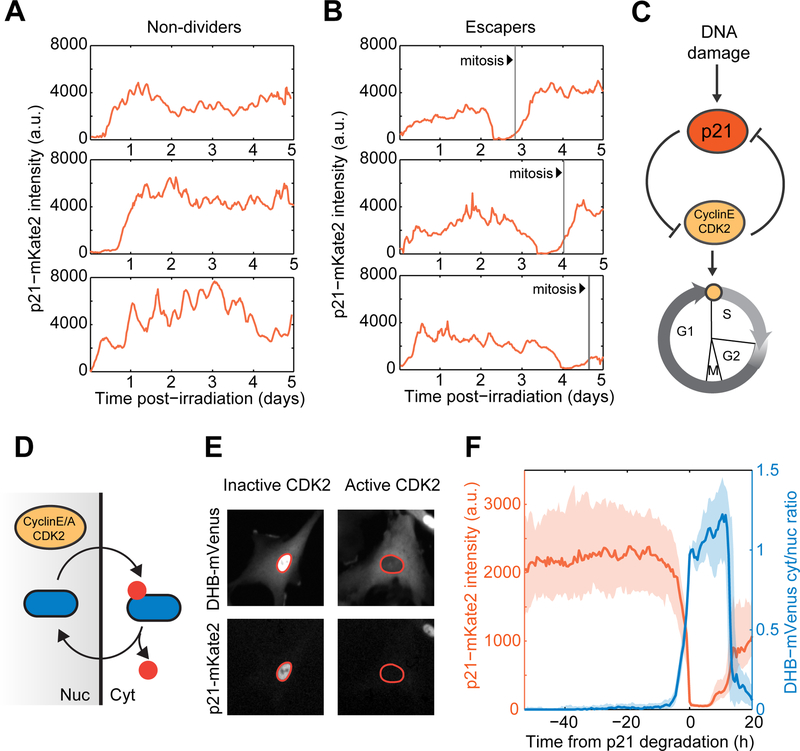
(A,B) Representative single cell trajectories of p21-mKate2 levels in irradiated non-dividers and escapers. Vertical lines denote mitosis events.
(C) p21 arrests the cell cycle by inhibiting the function of the CDK2/CyclinE complex which in turns leads to p21 degradation upon S-phase entry, forming a double negative feedback loop.
(D) CyclinE-CDK2 dependent phosphorylation triggers cytoplasmic retention of DHB-mVenus, which serves as a quantitative proxy for CDK2 activity in live cells.
(E) Representative images of cells harboring CDK2 activity reporter and p21-mKate2 fluorescent protein. Nuclei are outlined in orange.
(F) Dynamics of p21 and CDK2 activity in the vicinity of escape events. Irradiated cells were in silico synchronized to the time of p21 degradation. Bold lines and shaded areas correspond to median and interquartile ranges, respectively (n = 80 cells).
p21 halts cell cycle progression through direct inhibition of Cyclin-CDK complexes. The CyclinE- CDK2 complex in turn drives transition into S-phase and leads to p21 degradation, forming a double negative feedback loop (Bornstein et al., 2003; Coleman et al., 2015) (Figure 4C). Using a recently established translocation based fluorescent reporter of CDK2 activity (Spencer et al., 2013) (Figure 4D, E), we found that the onset of sharp p21 degradation was tightly correlated with an increase in CDK2 activity, leading to a switch in the abundance and activity of these two molecular players (Figure 4F, Movie S3). This transition occurred within a time window of ~5h (Figure S5A-B). To understand the relationship between p21 behavior and the probability of escape, we pooled single cell trajectories from escapers and non-dividers and computed the fraction of cells that would re-enter the cell cycle within a 5h escape window as a function of p21 levels or fold-increase/decrease over time. The probability of escape increased sharply with decreasing p21 levels and increasing fold-degradation (Star Methods and Figure S5D-E). Instantaneous levels and dynamics of p21 protein were most informative of escape in the vicinity of G1/S transitions (< 20h). High p21 levels at any given time point increased the probability, but did not guarantee the long-term maintenance of the arrested state (Figure S5F-G). Thus, while elevated levels of p21 in escapers are sufficient to establish and maintain the arrested state for several days, transient excursions into low levels can trigger the switch between p21 and CDK2. We sought to determine the molecular mechanism that triggers such an abrupt switch.
Escape from arrest is preceded by a transient decrease in p53 pulse amplitude
The interplay between p21 and CDK2 can function as a bistable toggle switch in a deterministic dynamics framework (Tyson and Novák, 2010). To understand whether and how this core circuit might be affected by temporal fluctuations stemming from p53, we adapted a previously developed computational model that accounts for deterministic dynamics of p21 and CDK2 interactions (Overton et al., 2014), and introduced pulsatile p53 dynamics as the only source of variation in p21 production (Figure 5A, Supplementary Text). We used single cell time series of paired p53/p21 and p21/CDK2 reporters to calculate the parameters governing p21 production, degradation and p21-dependent CDK2 inactivation (STAR Methods and Figure S6). Our model showed that sequences of low amplitude p53 pulses preceded sporadic events of p21 degradation (Figure 5B, C), suggesting that the double negative feedback between p21 and CDK2 can indeed translate fluctuations in p53 pulses into escape from arrest.
Figure 5. Stochastic series of low amplitude p53 pulses precedes the onset of G1/S transition.
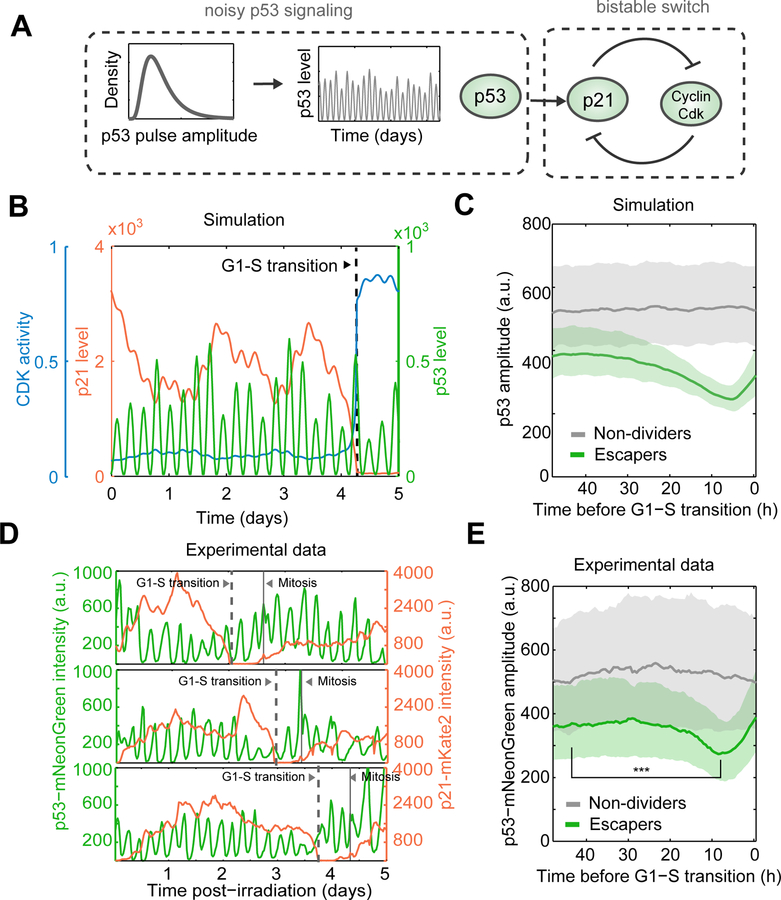
(A) Schematic of our computational modeling approach. p53 trajectories are generated by randomly sampling pulse amplitude values, and represent the input into a deterministic ODE based model of p21 and CDK2 (Overton et al., 2014).
(B) Representative simulation result capturing escape from cell cycle arrest.
(C) Simulated p53 trajectories were in silico aligned to the time of p21 degradation. Random non- dividing cells were sampled to match the timescale of escape events. Median trajectories +/− interquartile range are compared in the vicinity of G1-S transitions.
(D) p53 and p21 dynamics were quantified in the same cell. Three representative single cell trajectories of escapers are shown.
(E) p53 trajectories were in silico synchronized to the time of p21 degradation for escapers. Trajectories from non-dividers were randomly sampled to match the time of escape events. Bold line and shaded area correspond to median and interquartile range, respectively. (n = 503 cells per group) *** p < 0.001, two tailed t-test. Escapers show overall lower levels of p53 than non-dividers, and a dip in p53 pulse amplitude prior to the p21/CDK2 switch that leads to the escape from arrest.
To test whether local fluctuations in p53 pulse amplitude indeed contribute to escape from cell cycle arrest, we quantified p53 dynamics in >1000 individual cells that either maintained or escaped the arrested state in the course of 5 days post-irradiation (Figure 5D). We used p21 degradation events to in silico align individual cells at the time of cell cycle re-entry, allowing a retrospective view at p53 fluctuations in the vicinity of G1-S transitions. We found that a transient decrease in p53 pulse amplitude preceded the onset of p21 degradation events, a pattern that was absent in trajectories from non-dividers randomly sampled to match the timing of unsynchronized escape events (Figure 5E).
Transient artificial decrease of p53 is sufficient to trigger cell cycle re-entry in arrested cells
We next sought to directly manipulate p53 levels in a way that mimics the natural noise and test the effect on cell cycle re-entry in long-term arrested cells. To this end we established a system that allows quantitative and reversible control of the p53 protein levels in single cells. Such system consists of two inducible components: (i) a doxycyclin (dox) inducible shRNA targeting the endogenous p53 mRNA (Figure 6A) and (ii) a shRNA resistant exogenous p53 (Gaglia et al., 2013), fused to the YFP fluorescent protein and to a DHFR destabilizing domain (Iwamoto et al., 2010) (Figure 6B), which render the protein stable only in the presence of trimethoprim (TMP). Addition of TMP in the absence of damage resulted in similar p53 levels to those of untreated cells, implying that the DHFR(DD)-YFP domains do not disrupt homeostatic control of p53 under basal conditions (Figure 6C). Addition of dox alone prevented the induction of p53 protein in response to ionizing radiation, which was rescued by TMP-mediated stabilization of p53-DHFR(DD)-YFP (Figure 6C). Treatment with increasing concentrations of TMP led to a gradual increase in the average p53 levels (Figure 6D), which translated into a gradual increase in p21 protein levels (Figure 6E) and a corresponding decrease in the fraction of cycling cells in the population, as quantified by pRb staining (Figure 6F). Moreover, we showed that p53 pulse amplitude could be reversibly modulated by changing the concentration of TMP over time (Figure 6G). Taken together, our inducible system allows the functional replacement of the endogenous p53 for an exogenous version of p53 which can be simultaneously quantified and modulated.
Figure 6. Transient decrease in p53 protein levels is sufficient to trigger cell cycle re-entry in arrested cells.
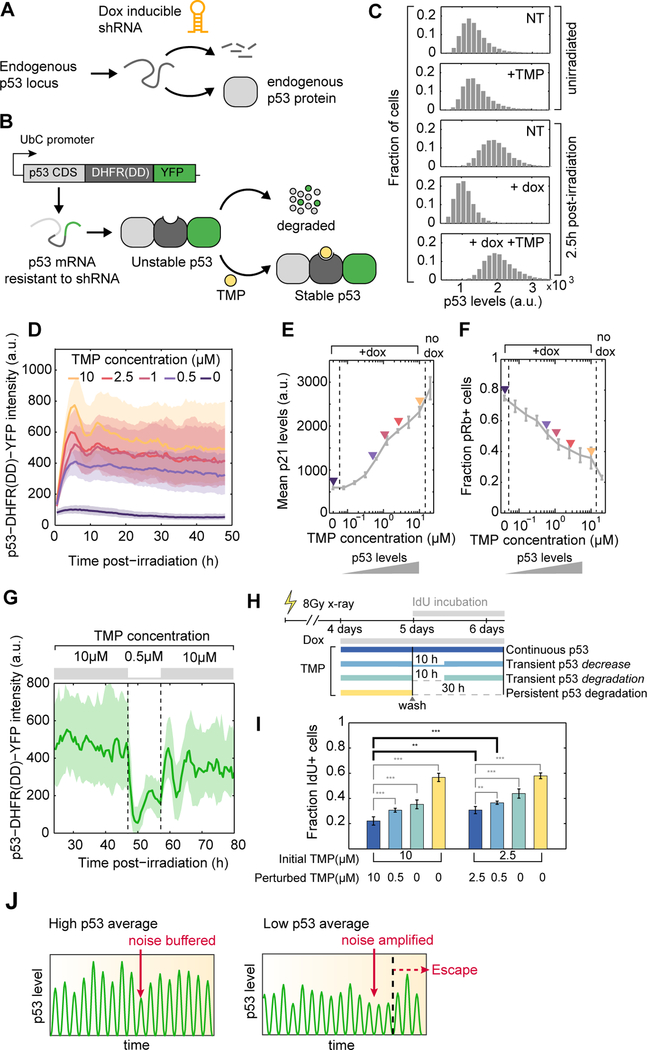
(A) A dox-inducible shRNA allows depletion of endogenous p53 protein.
(B) Exogenous expression of a p53 protein fused to a DHFR destabilizing domain is stable only in the presence of TMP. The p53-DHFR(DD)-YFP mRNA is resistant to the inducible shRNA described in (A).
(C) Distributions of p53 protein levels in single cells, as quantified by immunofluorescence. TMP- dependent stabilization of p53-DHFR(DD)-YFP effectively rescues shRNA-mediated depletion of endogenous p53 in response to DNA damage.
(D) p53-DHFR(DD)-YFP levels can be gradually modulated by addition of increasing doses of TMP. Medians +/− interquartile ranges of single cell trajectories are shown (n > 100 cells per condition).
(E, F) Cells received 2Gy xray and were treated with increasing concentrations of TMP in the presence of dox. Average p21 levels and the fraction of pRb positive cells were quantified 2 days post-irradiation using immunofluorescence (n = 3 biological replicates).
(G) Transient decrease in TMP concentration reversibly reduced p53 levels in individual cells. Medians +/− interquartile ranges of single cell trajectories are shown (n = 67 cells).
(H) Schematic of experimental design to test the effect of transient disruption of p53 signaling on cell fate. Cells received 8Gy xray and were treated with dox and TMP 4 days post-irradiation for 24h. Media was washed and replaced with original TMP concentration (continuous p53), a low TMP concentration for 10h (transient decrease), no TMP (transient degradation) for 10h or no TMP until the end of experiment (persistent degradation). Media was supplemented with IdU to quantify the proportion of cells that go through S-phase post-wash.
(I) Proportion of cells that incorporate IdU as a function of TMP treatment schedule and base TMP concentration (n = 6 biological replicates, ** p < 0.01, *** p < 0.001).
(J) Heterogeneity in p53 pulse amplitude defines a permissive state within which temporal fluctuations in signaling drive cell cycle transitions. In a cell with high amplitude of p53 pulses the noise is buffered. In a cell with lower averaged p53 pulse amplitude the noise is amplified and results in escape from arrest.
We used TMP-mediated control of p53 levels to transiently disrupt p53 function in long-term arrested cells and to test the effect of such perturbation on the maintenance of the arrested state. We exposed cells to a high dose of ionizing radiation and treated them with TMP and dox 4 days after damage. Five days post-irradiation, we washed the media and either fully removed TMP or reduced its concentration (0.5μM) for 10h, after which TMP was replenished to its original concentration (Figure 6H). We found that transient reduction or depletion of p53 levels are sufficient to disrupt cell cycle arrest, as measured by an increase in the fraction of cells incorporating the thymidine analog IdU (Figure 6I). Moreover, lowering the basal level of p53 before the transient perturbation increased the proportion of IdU incorporating cells (Figure 6I), in agreement with the insights derived from our analysis of natural cell- to-cell heterogeneity in p53 signaling.
Together, our single cell analyses of both natural and induced variability in DNA damage signaling support a model in which quantitative variation in p53 pulse amplitude defines a permissive state within which temporal fluctuations in DNA damage signaling drive cell cycle transitions (Figure 6J). Specifically, low average p53 pulse amplitude primes cells into a cellular state in which transient fluctuations in p53 are amplified into escape from cell cycle arrest. Therefore, both the average and tails of the p53 distribution contribute to the noise-driven cell cycle transitions of individual cells.
Discussion
The variability in cellular outcomes after DNA damage is often conceptualized in the form of discrete cellular states (i.e. arrested and cycling) that are quantifiable at fixed timepoints or short-term observations. By studying the response of single cells to ionizing radiation, we discovered that arrested cells differed in their ability to maintain cell cycle arrest. Critically, long-term observations allowed us to identify cell cycle arrest escape events in real time. These events were rare within short time windows, but amounted to an appreciable frequency as the timescale of our observations became longer. Previous work in individual RPE cells showed that the majority of cells that received DNA damage during G2 skipped mitosis and established a long-term, and presumably permanent, G0 arrest (Krenning et al., 2014). Consistent with our observations, Krenning and colleagues identified a small fraction of cells that were able to re-enter the cell cycle over extended timescales. Here we extended these findings by focusing on the molecular underpinnings of such rare events. We revealed a critical relationship between temporal variability in DNA damage signaling and the unfolding of phenotypic variation over long timescales. In addition, our single cell data showed that escape from arrest does not necessarily entail the resumption of active proliferation. Cells varied both in the timescale to escape from cell cycle arrest, and in the number of times they divided after this initial escape. Efforts to understand the molecular requirements for the maintenance and reversion of the senescent phenotype will benefit from studying the arrested state at these two different levels. Moreover, it will be important to determine the conditions under which sporadic escape events lead to the re-establishment of active proliferation, as quantified by colony formation in vitro and tumor growth in vivo.
Early efforts to determine the molecular players required for the maintenance of the senescent phenotype identified a critical role for p53 signaling (Beauséjour et al., 2003; Dirac and Bernards, 2003; Gire and Wynford-Thomas, 1998). While it has been shown that other signaling pathways can compensate for p53 loss after the establishment of senescence (Jacobs and de Lange, 2004; Mallette et al., 2004; Sugrue et al., 1997), it was also shown that loss of p53 could lead to S-phase entry without the resumption of active proliferation (Beauséjour et al., 2003). In our system, active p53 signaling was necessary for the establishment and maintenance of cell cycle arrest after DNA damage (Figure 3C), however even in the presence of functional p53fluctuations in its levels led to heterogeneity in arrest maintenance. Future work will address the extent to which combinatorial fluctuations in distinct tumor suppressor pathways collectively shape the propensity for cells to maintain or escape cell cycle arrest.
Whether cellular noise is beneficial for cells or an obstacle they need to buffer and cope with is an unsolved question. On one hand, fluctuations in signaling have been functionally linked to the generation of phenotypic diversity that shapes multicellular development (Kalmar et al., 2009) and allows cells to adapt to changes in their environment (Balaban et al., 2004; Spencer et al., 2009). On the other hand, noise was shown to impose limits to cellular control circuits (Lestas et al., 2010), and cells have evolved mechanisms to distinguish bona fide signals from noise (Sokolik et al., 2015). In the context of DNA damage signaling, it is surprising that cells re-enter the cell cycle even in the presence of high DNA damage (Figure 2). One potential explanation is that p53 pulses emerged as a trade-off between the need to respond sensitively to DNA damage while maintaining the potential to recover. Indeed, previous work has shown that perturbation of p53 from pulsatile to sustained dynamics led to loss of proliferation potential in cells that would otherwise recover from damage (Purvis et al., 2012). While periodic p53 activation allows recovery it also creates the risk of escape from arrest as a byproduct of its fluctuations.
Self-reinforcing feedback loops confer stability to cellular states, but can also be engaged in triggering switches from noisy input signals. The double-negative feedback between p21 and CDK2 has been implicated in the establishment of quiescence after mitosis by re-enforcing initial accumulation of p21 during previous S and G2 phases (Barr et al., 2017; Spencer et al., 2013). Moreover, it was shown that this circuit translates heterogeneity in p21 levels into fractional quiescence entry during unperturbed proliferation (Overton et al., 2014). Here, we found that the same circuit architecture is engaged during escape from arrest. Critically, levels of p21 that were sufficient to trigger entry into the arrested state, were not necessarily sufficient to maintain such state in the presence of fluctuations from upstream signaling. Specifically, the double negative interaction between p21 and CDK2 amplified transient decreases in p53 pulse amplitude, ultimately leading to the disruption of cell cycle arrest homeostasis. A similar noise driven switch has been shown in Bacillus subtilis, in which an excitable system of negative and positive feedback loops led to transient differentiation (Süel et al., 2006). Thus, the interaction between noisy signaling and self-reinforcing circuits may be a common mechanism that translates fluctuations that occur over short timescales in phenotypic changes that occur over long timescales. Careful quantitative measurements in single cells will be required to determine whether other systems show similar responses to fluctuations, and specifically whether cells can more efficiently filter fluctuations in oscillatory systems than non-oscillatory systems, giving some hints to the puzzling function of oscillations in transcriptional regulation.
The long-term maintenance of cell cycle arrest has emerged as a critical factor for the success of cytotoxic chemotherapy (Collado and Serrano, 2010; Nardella et al., 2011). However, it has been recognized that specific genetic alterations, including p53 loss, can lead to the reversion of the senescent phenotype and the resumption proliferation (Beauséjour et al., 2003; Dirac and Bernards, 2003). This raises the possibility that therapy induced senescent cells may constitute a latent cellular reservoir of damaged cells that could contribute to tumor repopulation and the emergence of resistance to DNA damaging therapies (Kahlem et al., 2004; Schmitt et al., 2002). Little is known about the dynamics by which cells could transition from a senescent state into active proliferation. It will be important to understand the extent to which noise driven cell cycle re-entry can facilitate early stages of senescence escape and the emergence of resistance to cytotoxic chemotherapy.
STAR Methods
CONTACT FOR REAGENTS AND RESOURCE SHARING
Further information and requests for resources and reagents should be directed to and will be fulfilled by the Lead Contact, Galit Lahav (Galit@hms.harvard.edu).
EXPERIMENTAL MODEL AND SUBJECT DETAILS
Cell lines
RPE cells immortalized with telomerase overexpression (RPE-hTERT, a kind gift from S.J. Elledge, Harvard Medical School) were grown in DMEM/F12 supplemented with 10% fetal bovine serum (FBS), 100U/mL penicillin, 100mg/mL streptomycin and 250ng/mL fungizone (Gemini Bio-Products). For microscopy, DMEM/F12 + 5% FBS lacking phenol red and riboflavin, was used. When necessary, media was supplemented with selective antibiotics (400μg/mL G418, 2μg/mL puromycin). Cells were grown in an incubator with controlled temperature (37°C), CO2 (5%) and relative humidity (80%). RPE cells were authenticated by Short-Tandem-Repeats at the Dana Farber Molecular Diagnostics Laboratory.
Cell line construction
To endogenously tag p21 with the fluorescent protein mKate2, we used the eFlut toolset as previously described (Stewart-Ornstein and Lahav, 2016). The resulting tagged coding sequence includes a P2A cleavable Neomycin resistance protein, allowing selection for cells harboring the tag without disrupting the endogenous p21 3’UTR. To establish the p21-mKate2/p53-mNeonGreen dual reporter cell line, p21- mKate2 cells were infected with a p53-mNeonGreen lentiviral vector. Single cell clones were expanded through limited dilution and subsequently screened for marker expression. To establish the p21- mKate2/DHB-mVenus reporter line, clonal p21-mKate2 tagged cells were infected with the DHB- mVenus lentiviral vector (a kind gift from S. Spencer, University of Colorado Boulder, Spencer et al. 2012). Cells were further infected with mCerulean3-NLS lentiviral vector, a constitutive nuclear marker.
To establish the RPE p53-DHFR(DD)-YFP cell line, RPE cells were first infected with Tet-on-pLKO- shp53 which allows doxycyclin inducible expression of an shRNA targeting endogenous p53 (Brummelkamp et al., 2002; Wiederschain et al., 2009). Next, we infected cells with a construct harboring the p53 coding sequence fused to the DHFR destabilizing domain (Iwamoto et al., 2010) and YFP. The exogenous p53 has 7 synonymous point mutations that allow it to escape from the dox inducible shRNA silencing. This modified p53 was functionally validated in a previous study (Gaglia et al., 2013). Single cells clones were expanded and the effects of doxycyclin and TMP on p53 function were tested as described in Fig. 6C-F (main text).
METHODS DETAILS
Irradiation
To acutely induce DNA damage, cells were exposed to time-controlled doses of γ-irradiation in a 60Co irradiator or x-ray in a RS-2000 irradiator (Radsource).
Live-Cell Microscopy
Cells were grown in poly-D-lysine-coated glass bottom plates (MatTek Corporation) and imaged using a Nikon Eclipse TE-2000 inverted microscope with a 10X Plan Apo objective and a Hammamatsu Orca ER camera, equipped with environmental chamber controlling temperature, atmosphere (5% CO2) and humidity. For long-term live cell imaging experiments (>5 days), media was replaced every day to maintain growth factor stimulation throughout the entire duration of imaging. Images were acquired every 30 min using the MetaMorph Software.
siRNA knockdown
Small interfering RNA (siRNA) targeting p53, p21 or control siRNA were delivered to irradiated cells using RNAiMAX reagent (Thermo Fisher Scientific), following manufacturer protocol. Media was replaced 5h post-delivery, and cells were imaged for >2 days to quantify cell cycle re-entry. Live reporters allowed confirmation of target knockdown.
Senescence Associated β-Galactosidase Assay
Senescence Associated β-Galactosidase activity was assayed using the corresponding staining kit purchased from Cell Signaling (cat#9860), following manufacturer protocol. Cells received γ- irradiation, replated 3 days post-irradiation adjusting for differences in cell density associated with different damage doses, and stained for β-Galactosidase activity. Cells were imaged using a Nikon Eclipse TE-2000 inverted microscope equipped with an IDEA digital color camera and a 10X Plan Apo objective.
Immunofluorescence
Cells were plated in poly-D-lysine coated glass bottom dishes (MatTek Corporation) and fixed with 4% paraformaldehyde for 10min at room temperature at the appropriate time after treatment. Cells were permeabilized with 0.1% Triton-X and blocked with 2% BSA in 1X PBS. Cells were incubated overnight with primary antibody (1:100 dilution), washed, and stained with secondary fluorescent antibodies and DAPI (1:104 dilution) for 1h, followed by a final wash. Cells were imaged using a Nikon Eclipse TE-2000 inverted microscope with a 20X Plan Apo objective and a Hammamatsu Orca ER camera.
Western Blot
Cells were harvested with RIPA buffer (Cold Spring Harbor Protocols) containing protease and phosphatase inhibitors. Protein samples were separated by electrophoresis on 4%−12% Bis-Tris gradient gels (Invitrogen) and transferred to Pure Nitrocellulose Blotting Membrane (Life Sciences). Membranes were blocked with 4% BSA, incubated with primary antibody overnight (1:1000–1:2000 dilution), washed, and incubated with secondary fluorescent conjugate antibodies, followed by a last wash. Membranes were scanned using LI-COR Odyssey CLX.
Transient perturbation of p53
To transiently perturb p53 levels, we used trimethoprim (TMP)-mediated stabilization of an exogenous p53-DHFR(DD)-YFP construct, coupled with doxycyclin (dox)-inducible shRNA depletion of endogenous p53 mRNA. Cells received 8Gy x-ray and media was changed 4 days post-irradiation into doxycyclin (250ng/mL) and trimethoprim (basal concentration of 10uM or 2.5uM) supplemented media. One day after, cells were washed 4 times with dox (250ng/mL) and IdU (2.5uM) containing media. Depending on treatment schedule, TMP was added to a final concentration of 10uM, 2.5uM or 0.5uM immediately after wash, and replenished to its base concentration 10h after wash. Cells were fixed 1 day after this transient perturbation. To probe for IdU incorporation, cells were treated with 2N HCl for 20min, followed by a standard immunofluorescence protocol (described above) with primary anti-BrdU staining. Cells were imaged using the Cytell Cell Imaging System (GE Healthcare Life Sciences) with 10X magnification.
Mathematical modeling
The aim of our computational model described here was to develop an intuition regarding the way fluctuations in p21 levels stemming from variable p53 oscillations could give place to stochastic switching between a p21high/CDK2low (arrest) to a p21low/CDK2high (escape) state. We consider a deterministic model with three molecular species: p53 protein, p21 mRNA, p21 protein and CDK2 activity, which depends on p21 levels. This model consists of a simplified architecture of the core double negative feedback loop between p21 and CDK2, and is adapted from a previously develop computational model (Overton et al. 2014). The dynamics of this system are described by the following coupled ordinary differential equations:
| (1) |
| (2) |
| (3) |
We assume that CDK2 activity depends on the instantaneous levels of p21:
| (4) |
The model receives p53 time trajectories with fixed period and variable amplitude as an input. To generate trains of p53 pulses with random amplitudes, we used a custom matlab script that sequentially generates individual cosine peaks, sets the base at 0 and scales the amplitude to a randomly sampled value from a log normal distribution: and , with m and CV specified in Table S1 and Figure S6B. Each pulse is sampled independently. Computational analysis of the effect of fluctuations in p53 pulse amplitude on the core p21-CDK2 double negative feedback loop was performed using ode45 solver in Matlab (Mathworks). Statistics on features of p53 trajectories in the vicinity of transitions were estimated from 5,000 simulated cells (main text Fig. 5).
Determination of model parameters
p21 mRNA half-life was previously estimated to be between 1.2 h and 3.26 h (Hafner et al., 2017; Kim et al., 2012; Yang et al., 2017). We set p21 mRNA half-life to 2h in our simulations.
To estimate the half-life of p21 protein in damaged cells, we quantified the decay of p21-mKate2 5h after knockdown of p53 (Figure S6C). We excluded the timepoints corresponding to the sharp degradation of p21 during the G1-S transition and trajectories that had residual p53 activity, as quantified by the p53-mNeonGreen reporter. We estimated a median protein half-life of ~5h (Figure S6D-E). This estimate is in disagreement with previous reports in the literature, which resulted in much shorter half-lives (30min – 1h) using population level assays (Chang and Eastman, 2012; Yang et al., 2017). This disagreement could potentially arise as a result of averaging of cells in distinct stages of the cell cycle (p21 degradation rate is markedly increased during S-phase) and thus, we think that our estimate better represents p21 half-life in our experimental conditions. However, we note that our measurements could overestimate p21 protein half-life due to the effect of residual p21 mRNA after p53 depletion, and thus represent an upper bound of the actual half-life.
We next estimated the function describing p53-dependent p21 production rate. In non-divider cells, where CDK2 activity is low we assumed that
And therefore p21 protein dynamics dominated by basal degradation, yielding a simplified form of equation (2):
| (5) |
Solving for p21mRNA from equation (3), we obtained
| (6) |
Finally, solving for f(p53) in equation (1) and substituting p21mRNA from (4) we obtained
| (7) |
| (8) |
Note that since we don’t directly measure p21mRNA, we can only estimate the product of p21 transcription and translation rates as a function of p53 (referred here as p21 production rate). We computed the first and second derivatives from p21 protein trajectories estimated the temporal evolution of p21 production accounting for the previously defined p21 mRNA and protein half-lives. For each pulse of p53 we identified the corresponding pulse of p21 production and used paired pulse amplitudes to infer the input-output function linking p53 levels with p21 production. Our analysis suggests that p53 dependent p21 production is well described by Michaelis-Menten kinetics (Figure S6F):
| (9) |
We computed the average CDK2 activity as a function of p21 levels from paired measurements of p21- mKate2 and DHB-mVenus in single cells (main text Figure 4F). This function was well described by a decaying hill function with a hill coefficient of ~5 (Figure S6G).
Lastly, we used paired p21-mKate2 and DHB-mVenus trajectories to estimate the CDK2-dependent contribution to p21 degradation. Solving for h(CDK2activity) in equation (2),
| (10) |
Figure S6H shows the way the first term in this equation, which can be inferred using only p21-mKate2 trajectories, varies as a function of CDK2activity. As expected, p21 degradation increases as a function of CDK2 activity. Moreover, we don’t find evidence for saturation of p21 degradation rate within the range of CDK2 activity that cells experience during G1-S transitions. Note that since we don’t have experimental data that simultaneously monitors p53, p21 and CDK2 activity in the same cell, our measurements are expected to underestimate the contribution of CDK2 activity to p21 degradation due to the continuous production of p21 protein. In our simulations, we introduced a scaling factor h to find a regime in which we observed heterogeneity in long-term fate (arrest maintenance or escape). Our model recapitulated the sharp increase in the probability of escape with decreasing p21 levels (Figure S6I-J) and increasing relative p21 degradation rate (Figure S6K). The discrepancy between simulations and experimental data could be attributed to unaccounted sources of heterogeneity in p21 dynamics (for instance, cell-to-cell variation in p21 production and degradation rates) and in other molecular players known to play a role in orchestrating G1-S transitions (for instance CyclinD/CDK4 complexes). A summary of the parameters used in our simulations is presented in Table S1.
QUANTIFICATION AND STATISTICAL ANALYSES
Single Cell Tracking and quantification
A semi-automated method was developed that allows tracking and cell fate annotation of individual, fast moving cells over long timescales. Our method relies on (i) automatic identification of single cell centroids using intensity and shape information of a constitutive nuclear marker; (ii) centroid linkage and track propagation using nearest-neighbor criteria; and (iii) real-time user correction of tracking, and annotation of cell fate events. Tracking data was then used to quantify intensity of fluorescent reporters from background subtracted images by averaging 10 pixels within the cell nucleus. In order to quantify cytoplasmic-nuclear ratio of fluorescence intensity, cytoplasmic signal was estimated by averaging the intensity of a 3 pixels-wide ring surrounding segmented nuclei, which was then divided by the average nuclear intensity. Cells were tracked using only information about a constitutively expressed nuclear marker and were thus blind to the dynamics of molecular players of interest, such as p53 and p21. Only cells that remained within the field of view throughout the entire duration of the experiment were considered for downstream analyses.
Statistical analysis of single cell trajectories
We operationally defined escapers as those cells that (i) arrested for at least 2 days after irradiation and (ii)divided only once after this prolonged phase of cell cycle arrest within long-term observations (> 5 days). These stand in contrast with non-divider cells, which remain arrested throughout the entire duration of the experiment. We compared p53, p21 and CDK2 levels and dynamics between these two subpopulations, which differed in fate but were otherwise exposed to the same environment. Since escape events were unsynchronized and broadly distributed throughout the experiment, we used in silico synchronization to project trajectories into comparable time axes in relationship with escape events. In addition, we randomly selected a non-divider cell trajectory and shifted it relatively to the timing of cell cycle re-entry for each escaper cell. This allowed us to compare non-divider and escaper cells within the same data analysis framework.
Owing to the strong p21 degradation program active during this S-phase, the onset of p21 protein accumulation is delayed in cells damaged during S-phase, (Stewart-Ornstein and Lahav, 2016). To compute historical averages of p21 levels in single cells, we considered only timepoints after p21 induced above basal levels, effectively controlling for cell cycle related differences in induction timing.
Estimating escape probability from single cell trajectories
To estimate the probability that a cell would escape from cell cycle arrest within a given time window (τ), we pooled single cell measurements of p21-mKate2 from both non-dividers and escapers from the time of p21 induction up until the time of p21 degradation. For each instantaneous measurement, we recorded the time until escape. In the case of non-dividers, this timing was set to infinity. We then quantified the fraction of cells that would escape in τ hours or less given that we observed p21 in a specific bin. For our initial analysis we chose τ = 5h, as this time-frame encompassed the duration from CDK2 activation to complete p21 degradation in most escaper cells (Figure S5A-B). We observed an ultrasensitive response curve, with a sharp increase in escape probability as cells approached low levels of p21 (Figure S5D). Interestingly, an instantaneous measurement of the fold change in p21 (Δp21/p21) yielded a sharper change in escape probability than absolute p21 levels over this 5h timescale (Figure S5E).
To understand how fast our ability to predict cell fate decayed over time, we repeated this analysis varying τ from 30min to 64h. Since the marginal probability of escape within τ hours (independent of any information of p21) increases with τ, we normalized the conditional escape probabilities (when we consider p21) by such marginal probability. This allowed us to quantify the extent to which knowing information about p21 increased our ability to predict whether a cell would escape or not within a particular time-frame. As shown in Figure S5F-G, both absolute and fold change values of p21 are most predictive when we measure them close to the transition. Such predictive power decays rapidly as we increase τ up to 10h~20h and stabilize at longer timescales (Figure S5H-I). Intuitively, the fact that instantaneous measurements of p21 protein levels are informative of cell fate over long timescales mirrors our observation that escaper cells induce p21 to lower average levels than non-dividers, and therefore operate closer to the transition (main text Figure 3). While variability in levels or fold change in p21 provide additional information about the timing of escape over short timescales, this additional information is quickly lost within a time-frame corresponding to 2–4 pulses of p53.
Supplementary Material
Highlights.
Live single cell profiling post-irradiation reveals heterogeneity in arrest maintenance
Heterogeneity in arrest maintenance results from noisy p53 pulse amplitude
The interplay between p21 and CDK2 translates p53 fluctuations into escape from arrest
High p21 levels are sufficient to establish arrest, but insufficient to maintain it
ACKNOWLEDGEMENTS
We thank T. Mitchinson, J. Paulsson, S. Gaudet for helpful feedback and discussions, members of the Lahav laboratory for comments, support, and ideas; U. Alon, M. Shreberck and C.A. Myrvold for kindly providing feedback on the manuscript, and S. Spencer for kindly providing feedback on the manuscript and for sharing the DHB-mVenus fluorescent reporter. We thank the Nikon Imaging Center at Harvard Medical School for support with live cell imaging; and J. Moore and S. Terrizzi for help with FACS sorting. This research was supported by NIH grant GM116864. J.R. received support from CONACyT/Fundacion Mexico en Harvard (404476), and Harvard Graduate Merit Fellowship. J.-Y. Chen received support from the NIH P50 grant GM107618 and is a Fellow of the Jane Coffin Child Memorial Fund for Medical Research. J.S.-O. received support from NIH grant CA207727. Materials and data are available upon request.
Footnotes
Publisher's Disclaimer: This is a PDF file of an unedited manuscript that has been accepted for publication. As a service to our customers we are providing this early version of the manuscript. The manuscript will undergo copyediting, typesetting, and review of the resulting proof before it is published in its final citable form. Please note that during the production process errors may be discovered which could affect the content, and all legal disclaimers that apply to the journal pertain.
DECLARATION OF INTERESTS
The authors declare that they have no competing interests.
SOFTWARE AVAILABILITY
Custom MATLAB scripts are available upon request. The p53Cinema software package for tracking and quantifying single cell data can be downloaded at https://github.com/balvahal/p53CinemaManual.
REFERENCES
- Balaban NQ, Merrin J, Chait R, Kowalik L, and Leibler S (2004). Bacterial persistence as a phenotypic switch. Science (80-.) 305, 1622–1625. [DOI] [PubMed] [Google Scholar]
- Barr AR, Cooper S, Heldt FS, Butera F, Stoy H, Mansfeld J, Novák B, and Bakal C (2017). DNA damage during S-phase mediates the proliferation-quiescence decision in the subsequent G1 via p21 expression. Nat. Commun 8, 14728. [DOI] [PMC free article] [PubMed] [Google Scholar]
- Beauséjour CM, Krtolica A, Galimi F, Narita M, Lowe SW, Yaswen P, and Campisi J (2003). Reversal of human cellular senescence: Roles of the p53 and p16 pathways. EMBO J 22, 4212–4222. [DOI] [PMC free article] [PubMed] [Google Scholar]
- Bornstein G, Bloom J, Sitry-Shevah D, Nakayama K, Pagano M, and Hershko A (2003). Role of the SCFSkp2 ubiquitin ligase in the degradation of p21Cip1 in S phase. J. Biol. Chem 278, 25752–25757. [DOI] [PubMed] [Google Scholar]
- Brugarolas J, Chandrasekaran C, Gordon JI, Beach D, Jacks T, and Hannon GJ (1995). Radiation-induced cell cycle arrest compromised by p21 deficiency. Nature 377, 552–557. [DOI] [PubMed] [Google Scholar]
- Brummelkamp TR, Bernards R, and Agami R (2002). A system for stable expression of short interfering RNAs in mammalian cells. Science 296, 550–553. [DOI] [PubMed] [Google Scholar]
- Chang LJ, and Eastman A (2012). Differential regulation of p21waf1 protein half-life by DNA damage and Nutlin-3 in p53 wild-type tumors and its therapeutic implications. Cancer Biol. Ther 13, 1047–1057. [DOI] [PMC free article] [PubMed] [Google Scholar]
- Coleman KE, Grant GD, Haggerty RA, Brantley K, Shibata E, Workman BD, Dutta A, Varma D, Purvis JE, and Cook JG (2015). Sequential replication-coupled destruction at G1/S ensures genome stability. Genes Dev 29, 1734–1746. [DOI] [PMC free article] [PubMed] [Google Scholar]
- Collado M, and Serrano M (2010). Senescence in tumours: evidence from mice and humans. Nat. Rev. Cancer 10, 51–57. [DOI] [PMC free article] [PubMed] [Google Scholar]
- Dimitrova N, Chen Y-CM, Spector DL, and de Lange T (2008). 53BP1 promotes non- homologous end joining of telomeres by increasing chromatin mobility. Nature 456, 524–528. [DOI] [PMC free article] [PubMed] [Google Scholar]
- Dirac AMG, and Bernards R (2003). Reversal of senescence in mouse fibroblasts through lentiviral suppression of p53. J. Biol. Chem 278, 11731–11734. [DOI] [PubMed] [Google Scholar]
- El-Deiry WS, Tokino T, Velculescu VE, Levy DB, Parsons R, Trent JM, Lin D, Mercer WE, Kinzler KW, and Vogelstein B (1993). WAF1, a potential mediator of p53 tumor suppression. Cell 75, 817–825. [DOI] [PubMed] [Google Scholar]
- Fumagalli M, Rossiello F, Mondello C, and D’Adda Di Fagagna F (2014). Stable cellular senescence is associated with persistent DDR activation. PLoS One 9, 44–46. [DOI] [PMC free article] [PubMed] [Google Scholar]
- Gaglia G, Guan Y, Shah JV, and Lahav G (2013). Activation and control of p53 tetramerization in individual living cells. Proc. Natl. Acad. Sci 110, 15497–15501. [DOI] [PMC free article] [PubMed] [Google Scholar]
- Geva-Zatorsky N, Rosenfeld N, Itzkovitz S, Milo R, Sigal A, Dekel E, Yarnitzky T, Liron Y, Polak P, Lahav G, et al. (2006). Oscillations and variability in the p53 system. Mol. Syst. Biol 2, 1–13. [DOI] [PMC free article] [PubMed] [Google Scholar]
- Gire V, and Wynford-Thomas D (1998). Reinitiation of DNA synthesis and cell division in senescent human fibroblasts by microinjection of anti-p53 antibodies. Mol. Cell. Biol 18, 1611–1621. [DOI] [PMC free article] [PubMed] [Google Scholar]
- Hafner A, Stewart-Ornstein J, Purvis JE, Forrester WC, Bulyk ML, and Lahav G (2017). P53 pulses lead to distinct patterns of gene expression albeit similar DNA-binding dynamics. Nat. Struct. Mol. Biol 24, 840–847. [DOI] [PMC free article] [PubMed] [Google Scholar]
- Harper JW, Adami GR, Wei N, Keyomarsi K, and Elledge SJ (1993). The p21 Cdk-interacting protein Cip1 is a potent inhibitor of G1 cyclin-dependent kinases. Cell 75, 805–816. [DOI] [PubMed] [Google Scholar]
- Haupt Y, Maya R, Kazaz A, and Oren M (1997). Mdm2 promotes the rapid degradation of p53. Nature 387, 296–299. [DOI] [PubMed] [Google Scholar]
- Iwamoto M, Björklund T, Lundberg C, Kirik D, and Wandless TJ (2010). A general chemical method to regulate protein stability in the mammalian central nervous system. Chem. Biol 17, 981–988. [DOI] [PMC free article] [PubMed] [Google Scholar]
- Jacobs JJL, and de Lange T (2004). Significant role for p16INK4a in p53-independent telomere- directed senescence. Curr. Biol 14, 2302–2308. [DOI] [PubMed] [Google Scholar]
- Kahlem P, Dörken B, and Schmitt C (2004). Cellular senescence in cancer treatment: friend or foe? J. Clin. Invest 113, 169–174. [DOI] [PMC free article] [PubMed] [Google Scholar]
- Kalmar T, Lim C, Hayward P, Muñoz-Descalzo S, Nichols J, Garcia-Ojalvo J, and Arias AM (2009). Regulated fluctuations in Nanog expression mediate cell fate decisions in embryonic stem cells. PLoS Biol 7, 33–36. [DOI] [PMC free article] [PubMed] [Google Scholar]
- Karanam K, Kafri R, Loewer A, and Lahav G (2012). Quantitative Live Cell Imaging Reveals a Gradual Shift between DNA Repair Mechanisms and a Maximal Use of HR in Mid S Phase. Mol. Cell 47, 320–329. [DOI] [PMC free article] [PubMed] [Google Scholar]
- Kim BC, Lee HC, Lee JJ, Choi CM, Kim DK, Lee JC, Ko YG, and Lee JS (2012). Wig1 prevents cellular senescence by regulating p21 mRNA decay through control of RISC recruitment. EMBO J 31, 4289–4303. [DOI] [PMC free article] [PubMed] [Google Scholar]
- Krenning L, Feringa FM, Shaltiel IA, vandenBerg J, and Medema RH (2014). Transient activation of p53 in G2 phase is sufficient to induce senescence. Mol. Cell 55, 59–72. [DOI] [PubMed] [Google Scholar]
- Lahav G, Rosenfeld N, Sigal A, Geva-Zatorsky N, Levine AJ, Elowitz MB, and Alon U (2004). Dynamics of the p53-Mdm2 feedback loop in individual cells. Nat. Genet 36, 147–150. [DOI] [PubMed] [Google Scholar]
- Lakin ND, and Jackson SP (1999). Regulation of p53 in response to DNA damage. Oncogene 18, 7644–7655. [DOI] [PubMed] [Google Scholar]
- Lestas I, Vinnicombe G, and Paulsson J (2010). Fundamental limits on the suppression of molecular fluctuations. Nature 467, 174–178. [DOI] [PMC free article] [PubMed] [Google Scholar]
- Loewer A, Karanam K, Mock C, and Lahav G (2013). The p53 response in single cells is linearly correlated to the number of DNA breaks without a distinct threshold. BMC Biol 11, 114. [DOI] [PMC free article] [PubMed] [Google Scholar]
- Lomax ME, Folkes LK, and O’Neill P (2013). Biological consequences of radiation-induced DNA damage: Relevance to radiotherapy. Clin. Oncol 25, 578–585. [DOI] [PubMed] [Google Scholar]
- Mallette FA, Goumard S, Gaumont-Leclerc MF, Moiseeva O, and Ferbeyre G (2004). Human fibroblasts require the Rb family of tumor suppressors, but not p53, for PML-induced senescence. Oncogene 23, 91–99. [DOI] [PubMed] [Google Scholar]
- Nardella C, Clohessy JG, Alimonti A, and Pandolfi PP (2011). Pro-senescence therapy for cancer treatment. Nat. Rev. Cancer 11, 503–511. [DOI] [PubMed] [Google Scholar]
- Overton KW, Spencer SL, Noderer WL, Meyer T, and Wang CL (2014). Basal p21 controls population heterogeneity in cycling and quiescent cell cycle states. Proc. Natl. Acad. Sci. U. S. A 111, E4386–93. [DOI] [PMC free article] [PubMed] [Google Scholar]
- Purvis JE, Karhohs KW, Mock C, Batchelor E, Loewer A, and Lahav G (2012). p53 dynamics control cell fate. Science (80-.) 336, 1440–1444. [DOI] [PMC free article] [PubMed] [Google Scholar]
- Riley T, Sontag E, Chen P, and Levine A (2008). Transcriptional control of human p53-regulated genes. Nat. Rev. Mol. Cell Biol 9, 402–412. [DOI] [PubMed] [Google Scholar]
- Sakaue-Sawano A, Kurokawa H, Morimura T, Hanyu A, Hama H, Osawa H, Kashiwagi S, Fukami K, Miyata T, Miyoshi H, et al. (2008). Visualizing Spatiotemporal Dynamics of Multicellular Cell-Cycle Progression. Cell 132, 487–498. [DOI] [PubMed] [Google Scholar]
- Schmitt CA, Fridman JS, Yang M, Lee S, Baranov E, Hoffman RM, and Lowe SW (2002). A senescence program controlled by p53 and p16INK4a contributes to the outcome of cancer therapy. Cell 109, 335–346. [DOI] [PubMed] [Google Scholar]
- Sokolik C, Liu Y, Bauer D, McPherson J, Broeker M, Heimberg G, Qi LS, Sivak DA, and Thomson M (2015). Transcription Factor Competition Allows Embryonic Stem Cells to Distinguish Authentic Signals from Noise. Cell Syst 1, 117–129. [DOI] [PMC free article] [PubMed] [Google Scholar]
- Spencer SL, Gaudet S, Albeck JG, Burke JM, and Sorger PK (2009). Non-genetic origins of cell-to-cell variability in TRAIL-induced apoptosis. Nature 459, 428–432. [DOI] [PMC free article] [PubMed] [Google Scholar]
- Spencer SL, Cappell SD, Tsai FC, Overton KW, Wang CL, and Meyer T (2013). The proliferation-quiescence decision is controlled by a bifurcation in CDK2 activity at mitotic exit. Cell 155, 369–383. [DOI] [PMC free article] [PubMed] [Google Scholar]
- Stewart-Ornstein J, and Lahav G (2016). Dynamics of CDKN1A in Single Cells Defined by an Endogenous Fluorescent Tagging Toolkit. Cell Rep 14, 1800–1811. [DOI] [PMC free article] [PubMed] [Google Scholar]
- Stewart-Ornstein J, and Lahav G (2017). p53 dynamics in response to DNA damage vary across cell lines and are shaped by efficiency of DNA repair and activity of the kinase ATM. Sci. Signal 10, 1–11. [DOI] [PMC free article] [PubMed] [Google Scholar]
- Süel GM, Garcia-Ojalvo J, Liberman LM, and Elowitz MB (2006). An excitable gene regulatory circuit induces transient cellular differentiation. Nature 440, 545–550. [DOI] [PubMed] [Google Scholar]
- Sugrue MM, Shin DY, Lee SW, and Aaronson SA (1997). Wild-type p53 triggers a rapid senescence program in human tumor cells lacking functional p53. Proc. Natl. Acad. Sci. U. S. A 94, 9648–9653. [DOI] [PMC free article] [PubMed] [Google Scholar]
- Tyson JJ, and Novák B (2010). Functional Motifs in Biochemical Reaction Networks. Annu. Rev. Phys. Chem 61, 219–240. [DOI] [PMC free article] [PubMed] [Google Scholar]
- Wiederschain D, Wee S, Chen L, Loo A, Yang G, Huang A, Chen Y, Caponigro G, Yao YM, Lengauer C, et al. (2009). Single-vector inducible lentiviral RNAi system for oncology target validation. Cell Cycle 8, 498–504. [DOI] [PubMed] [Google Scholar]
- Xiong Y, Hannon GJ, Zhang H, Casso D, Kobayashi R, and Beach D (1993). P21 Is a Universal Inhibitor of Cyclin Kinases. Nature 366, 701–704. [DOI] [PubMed] [Google Scholar]
- Xue W, Zender L, Miething C, Dickins RA, Hernando E, Krizhanovsky V, Cordon-Cardo C, and Lowe SW (2011). Senescence and tumour clearance is triggered by p53 restoration in murine liver carcinomas. Nature 473, 544–544. [DOI] [PMC free article] [PubMed] [Google Scholar]
- Yang HW, Chung M, Kudo T, and Meyer T (2017). Competing memories of mitogen and p53 signalling control cell-cycle entry. Nature 549, 404–408. [DOI] [PMC free article] [PubMed] [Google Scholar]
Associated Data
This section collects any data citations, data availability statements, or supplementary materials included in this article.