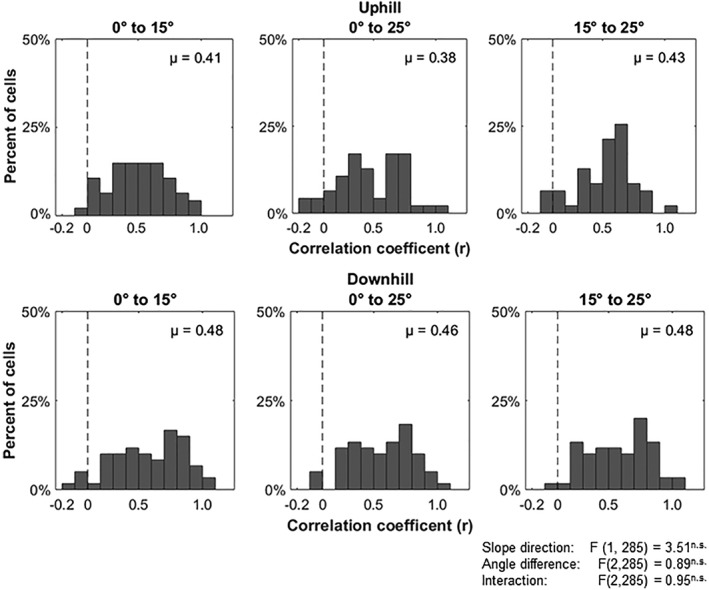
Figure 5.

Place cell activity correlations across tilt‐slope direction conditions. All plots show a histogram of correlations values of place cell activity between pairs of conditions. The dotted line is the average correlation value from shuffling the location of firing rate bins. No significant differences were found in the difference in tilt angle to the degree of place cell activity difference on uphill or downhill runs
