Abstract
Purpose
To calculate the prevalence of all vitreomacular interface (VMI) disorders and stratify according to age, sex and (pre)diabetes status.
Methods
The presence of VMI disorders was assessed in 2660 participants aged between 40 and 75 years from The Maastricht Study who had a gradable macular spectral‐domain optical coherence tomography (SD‐OCT) volume scan in at least one eye [mean 59.7 ± 8.2 years, 50.2% men, 1531 normal glucose metabolism (NGM), 401 prediabetes, 728 type 2 diabetes (DM2, oversampled)]. A stratified and multivariable logistic regression analysis was used.
Results
The prevalence of the different VMI disorders for individuals with NGM, prediabetes and DM2 was, respectively, 5.7%, 6% and 6.7% for epiretinal membranes; 6%, 9.6% and 6.8% for vitreomacular traction; 1.1%, 0.7% and 0.3% for lamellar macular holes; 0.1%, 0% and 0% for pseudoholes; 1.1%, 1.9% and 5.5% for macular cysts. None of the participants was diagnosed with a macular hole. The prevalence of epiretinal membranes, vitreomacular traction and macular cysts was higher with age (p < 0.001). Vitreomacular traction and lamellar macular holes were more frequent in women (p < 0.01). DM2 is positively associated [OR = 3.9 (95% CI 2.11–7.22, p < 0.001)] with macular cysts and negatively associated with lamellar macular holes [OR = 0.2 (95% CI 0.04–0.9, p = 0.036)] after adjustment for age and sex. The calculated prevalence of VMI disorders was 15.9%.
Conclusions
The calculated prevalence of VMI disorders in individuals aged between 40 and 75 years is 15.9%. The prevalence depends on age, sex and glucose metabolism status for several types of VMI disorders.
Keywords: epidemiology, glucose metabolism status, optical coherence tomography, retina, vitreomacular interface disorders
Introduction
Optical coherence tomography (OCT) provides two‐dimensional high‐resolution cross‐sectional scans of the retina that are used to classify different vitreomacular interface (VMI) disorders such as epiretinal membranes, vitreomacular traction, lamellar macular holes, pseudoholes, macular holes and macular cysts (Duker et al. 2013). The pathophysiology of most of these VMI disorders is based on changes in the vitreous humour. With ageing, the vitreous liquefies and collapses, causing a complete or incomplete posterior vitreous detachment. Incomplete posterior vitreous detachment is associated with abnormal vitreomacular adhesions (Duker et al. 2013). These can become symptomatic and may lead to the development of VMI disorders such as vitreomacular traction and an operculum (Duker et al. 2013; Syed & Dhillon 2013). Another VMI disorder is an epiretinal membrane which plays a role in the development of lamellar macular holes, pseudoholes, macular holes and macular oedema (Syed & Dhillon 2013). All these are serious conditions associated with visual disturbances, such as metamorphopsia and diminished visual acuity. Furthermore, VMI disorder can trigger other retinal pathologies, such as myopic traction maculopathy, or contribute to the development of more severe diabetic retinopathy (Duker et al. 2013).
The prevalence of VMI disorders has been investigated in a few studies such as the Blue Mountains Eye Study (Mitchell et al. 1997), the Beaver Dam Eye Study (Klein et al. 1994; Meuer et al. 2015), the Baltimore Eye Study (Rahmani et al. 1996), the Beijing Eye Study (Wang et al. 2006), the Handan eye Study (Duan et al. 2009), a study in Minnesota (McCannel et al. 2009) and a study in rural and urban Southern India (Sen et al. 2008). Most of these studies based their diagnosis on fundus photography and/or clinical diagnosis that lead to underreporting of the prevalence of VMI disorders. Only two studies, the Beaver Dam Eye Study and the Handan Eye Study, used OCT imaging. The Beaver Dam Eye Study investigated the prevalence of epiretinal membranes, vitreomacular traction, macular cysts, paravascular cysts, lamellar macular holes and full‐thickness macular holes (Meuer et al. 2015). The Handan Eye Study investigated only the prevalence of epiretinal membranes (Duan et al. 2009). They did not investigate whether there are differences in prevalence between individuals with prediabetes or type 2 diabetes (DM2) compared with individuals with normal glucose metabolism (NGM).
The aim of the current study was to calculate the prevalence of epiretinal membranes, vitreomacular traction, lamellar macular holes, pseudoholes, full‐thickness macular holes and macular cysts and stratify according to age, sex and (pre)diabetes status.
Methods
Study population and design
We used data from The Maastricht Study, an observational prospective population‐based cohort study. The rationale and methodology have been described previously (Schram et al. 2014). In brief, the study focuses on the aetiology, pathophysiology, complications and comorbidities of DM2 and is characterized by an extensive phenotyping approach. Eligible for participation were all individuals aged between 40 and 75 years and living in the southern part of the Netherlands. Participants were recruited through mass media campaigns and from the municipal registries and the regional Diabetes Patient Registry via mailings. Recruitment was stratified according to known DM2 status, with an oversampling of individuals with DM2, for reasons of efficiency. The present report includes cross‐sectional data from the first 3451 participants, who completed the baseline survey between November 2010 and September 2013. From the 8th of December 2011, OCT measures were included in the measurement protocol. The examinations of each participant were performed within a time window of 3 months. To achieve a representative study population, individuals between the ages of 40 and 75 years old were included, whereas individuals with DM2 were excluded randomly (based on national reference data) (Fig. 1) (Nielen 2014).
Figure 1.
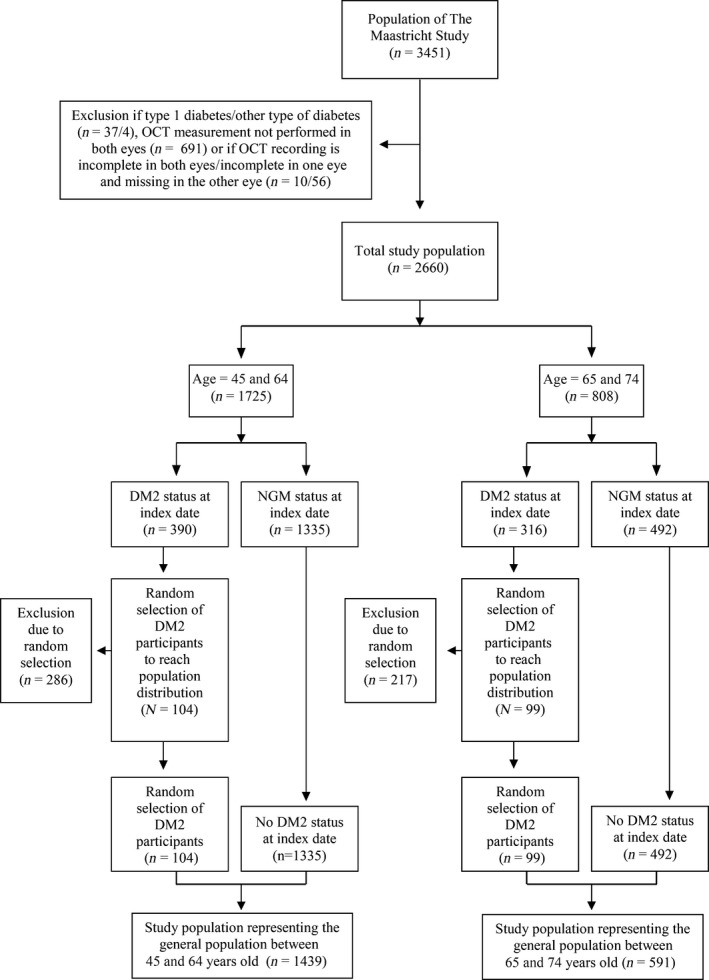
Random sampling to achieve a study population representative for the general population. DM2 = type 2 diabetes mellitus, NGM = normal glucose metabolism, OCT = optical coherence tomography.
The study has been approved by the institutional medical ethical committee (NL31329.068.10) and the Minister of Health, Welfare and Sports of the Netherlands (Permit 131088‐105234‐PG). All participants gave written informed consent.
Glucose metabolism status
To determine glucose metabolism status, all participants, except those who used insulin, underwent a standardized 2‐hr 75‐g oral glucose tolerance test (OGTT) after an overnight fast. For safety reasons, participants with a fasting glucose level above 11.0 m, as determined by a finger prick, did not undergo the OGTT. For these individuals (n = 13), fasting glucose level and information about diabetes medication were used to determine glucose metabolism status. Glucose metabolism status was defined according to the WHO 2006 criteria into NGM, impaired fasting glucose (IFG), impaired glucose tolerance (IGT), prediabetes (i.e. IFG and/or IGT) and DM2 (WHO 2006). Individuals without type 1 diabetes (T1DM) on diabetes medication were classified as having DM2 (Schram et al. 2014). For this study, individuals with DM1, individuals with latent autoimmune diabetes of adults, steroid‐induced diabetes and individuals who underwent a pancreas transplantation were excluded.
Assessment of vitreomacular interface disorders
All participants were examined with the Spectralis OCT (Heidelberg Engineering, Heidelberg, Germany, Heidelberg Eye Explorer software version 5.7.5.0) with the eye tracking function enabled. A macular volume scan (17 ART, 73 sections, 60 μm) was performed in both eyes by experienced examiners masked to the conditions of the participants. All the cross sections of the macular volume scans were reviewed and scored for the presence of VMI disorders (Fig. 2) by two experienced graders in a masked fashion based on a prespecified protocol. All the observed VMI disorders were checked by a vitreoretinal surgeon. A random sample of the OCTs reviewed by the least experienced researcher and graded with no abnormalities was also checked by a vitreoretinal surgeon. The agreement was 100%. The following VMI disorders were scored: epiretinal membranes (Fig. 2A), vitreomacular traction syndromes (classified as vitreomacular traction without elevation of the fovea, with elevation of the fovea without cysts and with elevation of the fovea with cysts) (Fig. 2B), lamellar macular holes (Fig. 2C), pseudoholes (Fig. 2D), full‐thickness macular holes and focal or diffuse macular cysts (Fig. 2E). We defined focal macular cysts by the presence of one or more foveal cysts and diffuse macular cysts by the presence of several cysts over a larger surface (Girach & Lund‐Andersen 2007; Klein et al. 2009). Individuals with an incomplete volume scan were excluded.
Figure 2.
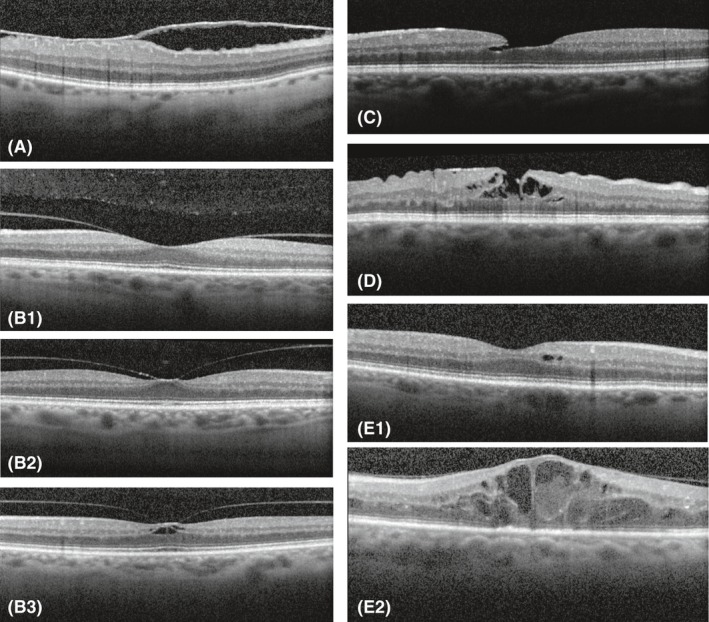
(A) Epiretinal membrane. (B1) Vitreomacular traction syndrome without elevation of the fovea. (B2) Vitreomacular traction syndrome with elevation of the fovea but without cysts. (B3) Vitreomacular traction syndrome with elevation of the fovea with cysts. (C) Lamellar hole. (D) Pseudohole. (E1) Focal macular cysts. (E2) Diffuse macular cysts.
Statistical analysis
Statistical analyses were performed in spss Statistics 23 for Windows (SPSS, Inc.). Differences between group characteristics were tested using one‐way analysis of variance (anova) for continuous variables and χ 2 tests for categorical variables. We combined the categories IFG and IGT into prediabetes. First, the overall analysis was conducted, and the prevalence of VMI disorders in individuals with NGM, prediabetes and DM2 was calculated. Next, analyses were adjusted for age and sex. Finally, multivariable logistic regression was used to analyse the association between glucose metabolism status (prediabetes and DM2; determinant) and the presence of VMI disorders (outcome). The results were presented as odds ratios (OR) with their 95% confidence intervals (95% CIs). A p‐value less than 0.05 was considered statistically significant.
In our study population, patients with DM2 were oversampled in comparison with the general population. To achieve a study population representative for the general population between the ages of 40 and 75 years old, individuals with DM2 were randomly excluded based on national reference data (Fig. 1). In patients between 45 and 64 years, the prevalence of DM2 is 6.5%. Therefore, 286 participants with DM2 within this age category, were randomly excluded (n = 104 included). In patients between 65 and 74 years, the prevalence of DM2 is 16.1%. Within this age category, 217 participants were excluded (n = 99 included). In the obtained study population representing the general population, we studied the prevalence stratified according to age and sex.
Results
Selection of participants and general characteristics
Figure 3 shows the flow diagram of the study. From the 3451 participants that were selected, 41 participants with DM1 or other types of diabetes were excluded. Of the remaining 3410 participants, a valid OCT measurement was available in 2660 participants. The main reason for these missing data was the later implementation of OCT measurements (n = 691) after the Maastricht Study was started. The OCT was included from the 8th of December 2011 onwards. In addition, participants with an incomplete volume scan (n = 66) were excluded. These categories are not mutually exclusive and result in a total exclusion of 791 participants.
Figure 3.
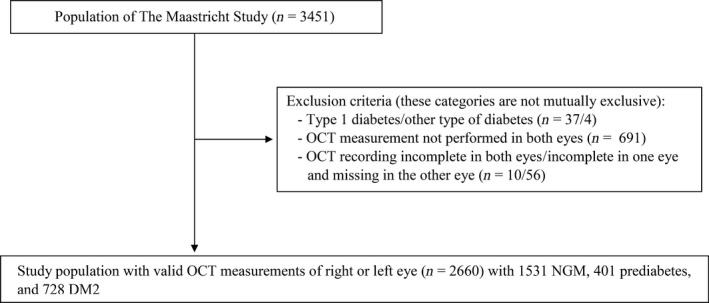
Flow diagram of the study. DM2 = type 2 diabetes mellitus, NGM = normal glucose metabolism, OCT = optical coherence tomography.
Thus, 2660 participants were available for statistical analysis. Participants who were excluded due to missing values were more likely to be male (55.8% versus 50.2% men, p < 0.01). Figure 1 shows the study population representative for the general population in selected age groups based on the availability of national reference data, that is 45 to 64 years (6.5% with DM2, n = 104) and 65 to 74 years (16.1% with DM2, n = 99).
General characteristics of the included participants are shown in Table 1 stratified by glucose metabolism. Of the 2660 participants, 1531 participants had NGM (57.6%), 401 participants had prediabetes (15.1%) and 728 participants had DM2 (27.4%). Age and sex were significantly different in individuals with prediabetes or DM2, compared with individuals with NGM (p < 0.001).
Table 1.
Prevalence of vitreomacular interface disorders according to study population and glucose metabolism status
| Vitreomacular interface disorders | Total study population (N = 2660) | Study population representing the general population (N = 2030) | NGM (N = 1531) | Prediabetes (N = 401) | DM2 (N = 728) | p‐value (chi‐squared test) | |
|---|---|---|---|---|---|---|---|
| Prediabetes versus NGM | DM2 versus NGM | ||||||
| Age (years), mean (SD) | 59.7 (8.2) | 59.8 (7.3) | 57.9 (8.0) | 61.2 (7.5) | 62.4 (7.8) | <0.001a | <0.001a |
| Male sex, n (%) | 1334 (50.2%) | 940 (46.3%) | 636 (41.5%) | 212 (52.9%) | 486 (66.8%) | <0.001a | <0.001a |
| Epiretinal membrane, n (%) | 161 (6.1%) | 124 (6.1%) | 88 (5.7%) | 24 (6.0%) | 49 (6.7%) | 0.856 | 0.36 |
| Vitreomacular traction, n (%) | |||||||
| Total | 183 (6.9%) | 143 (7%) | 92 (6.0%) | 38 (9.6%) | 53 (6.8%) | 0.001a | 0.248 |
| Without elevation fovea | 132 (5.0%) | 100 (4.9%) | 60 (3.9%) | 33 (8.3%) | 39 (5.4%) | <0.001a | 0.133 |
| With elevation fovea without cysts | 49 (1.8%) | 41 (2.0%) | 31 (2.0%) | 5 (1.3%) | 13 (1.3%) | 0.342 | 0.713 |
| With elevation fovea with cysts | 2 (0.1%) | 2 (0.1%) | 1 (0.1%) | 0 (0.0%) | 1 (0.1%) | 0.614 | 0.589 |
| Not assessable | 29 (1.1%) | 24 (1.2%) | 23 (1.5%) | 1 (0.3) | 5 (0.7%) | 0.05 | 0.107 |
| Lamellar hole, n (%) | 22 (0.8%) | 19 (0.9%) | 17 (1.1%) | 3 (0.7%) | 2 (0.3%) | 0.523 | 0.042a |
| Pseudohole, n (%) | 2 (0.1%) | 2 (0.1%) | 2 (0.1%) | 0 (0.0%) | 0 (0.0%) | 0.469 | 0.329 |
| Macular hole, n (%) | 0 (0.0%) | 0 (0.0%) | 0 (0.0%) | 0 (0.0%) | 0 (0.0%) | – | – |
| Macular cyst, n (%) | |||||||
| Total | 64 (2.4%) | 38 (1.8%) | 16 (1.1%) | 8 (1.9%) | 40 (5.5%) | 0.125 | <0.001a |
| Focal | 42 (1.6%) | 23 (1.1%) | 10 (0.7%) | 3 (0.7%) | 29 (4.0%) | 0.826 | <0.001a |
| Diffuse | 22 (0.8%) | 15 (0.7%) | 6 (0.4%) | 5 (1.2%) | 11 (1.5%) | 0.043a | <0.001a |
DM2 = type 2 diabetes mellitus, NGM = normal glucose metabolism, SD = standard deviation.
p < 0.05.
Prevalence of vitreomacular interface disorders
Table 1 shows the prevalence of VMI disorders according to the glucose metabolism status. In individuals with NGM, prediabetes and DM2, respectively, 5.7%, 6% and 6.7% had an epiretinal membrane; 6%, 9.6% and 6.8% vitreomacular traction; 1.1%, 0.7% and 0.3% a lamellar macular hole; 0.1%, 0% and 0% a pseudohole; 1.1%, 1.9% and 5.5% macular cysts (Fig. 4). None of the participants had a macular hole. In the study population representing the general population, 6.1% had an epiretinal membrane, 7% vitreomacular traction, 0.9% a lamellar macular hole, 0.1% a pseudohole, 0% a macular hole and 1.8% macular cysts (Fig. 5). The prevalence of the subcategories of the vitreomacular traction syndromes and macular cysts in the study population representing the general population between the ages of 45 and 75 years old is shown in Figs. 6 and 7.
Figure 4.
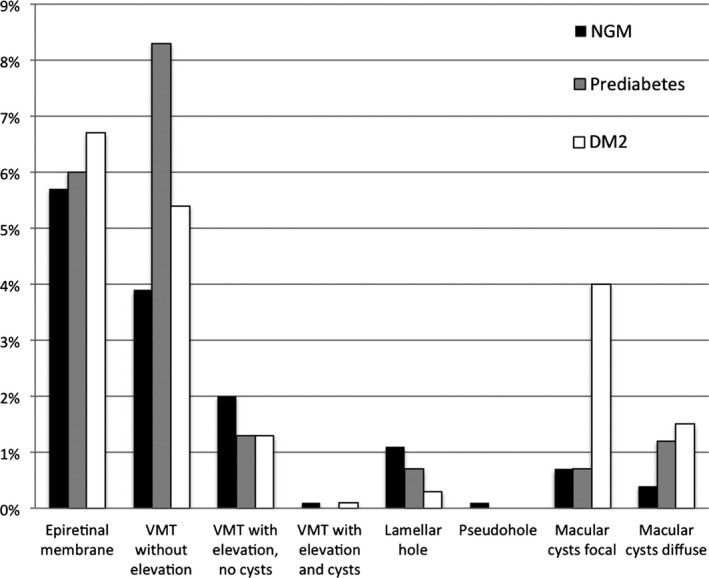
Prevalence of vitreomacular interface disorders according to glucose metabolism status in the total study population. DM2 = type 2 diabetes mellitus, NGM = normal glucose metabolism, VMT = vitreomacular traction.
Figure 5.
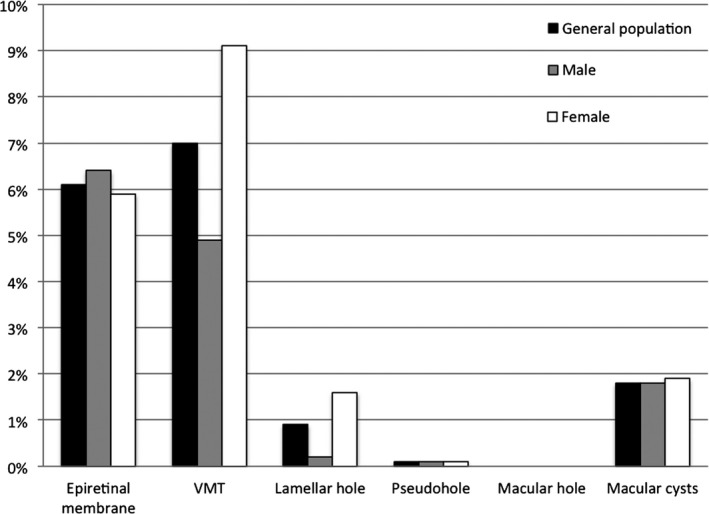
Prevalence of vitreomacular interface disorders in the study population representing the general population and according to sex. VMT = vitreomacular traction.
Figure 6.
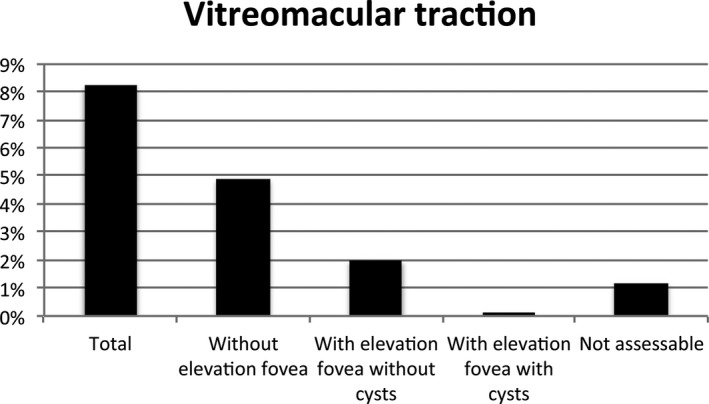
Prevalence of the subcategories of vitreomacular traction syndromes in the study population representing the general population.
Figure 7.
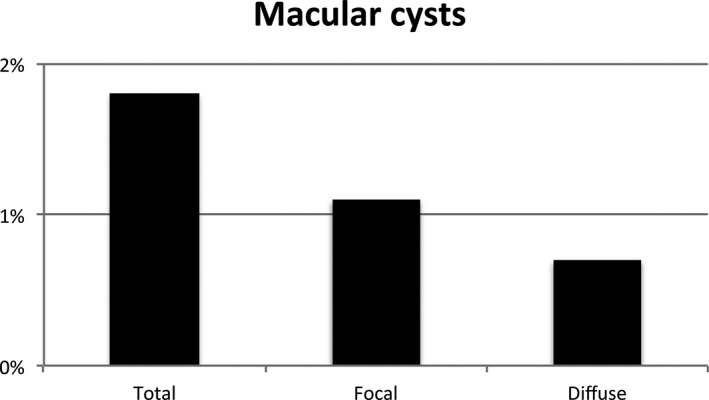
Prevalence of the subcategories of macular cysts in the study population representing the general population.
The prevalence of macular cysts was significantly higher in individuals with DM2 compared with individuals with NGM (p < 0.001). The prevalence of lamellar macular holes was significantly lower in individuals with DM2 compared with individuals with NGM (p = 0.042).
Table 2 shows the association between glucose metabolism status and the presence of VMI disorders in the total study population. Macular cysts were positively associated [OR = 3.90 (95% CI 2.11–7.22, p < 0.001)] with DM2 in comparison with NGM after adjustment for age and sex. Lamellar macular holes were negatively associated [OR = 0.2 (95% CI 0.04–0.9, p = 0.036)] with DM2 in comparison with NGM after adjustment for age and sex.
Table 2.
Association of vitreomacular interface disorders with glucose metabolism status in the total study population
| Total study population (N = 2660) | ||||||||
|---|---|---|---|---|---|---|---|---|
| Crude analysis | Adjusted for age and sex | |||||||
| Prediabetes versus NGM | DM2 versus NGM | Prediabetes versus NGM | DM2 versus NGM | |||||
| OR (95% CI) | p‐Value | OR (95% CI) | p‐Value | OR (95% CI) | p‐Value | OR (95% CI) | p‐Value | |
| Epiretinal membrane | 1.04 (0.66–1.66) | 0.856 | 1.18 (0.83–1.70) | 0.361 | 0.75 (0.46–1.20) | 0.229 | 0.72 (0.49–1.06) | 0.094 |
| Vitreomacular traction | 1.62 (1.09–2.41) | 0.017a | 1.22 (0.86–1.73) | 0.276 | 1.35 (0.90–2.03) | 0.154 | 0.97 (0.67–1.41) | 0.879 |
| Lamellar hole | 0.67 (0.2–2.3) | 0.526 | 0.25 (0.06–1.07) | 0.061 | 0.54 (0.16–1.90) | 0.339 | 0.20 (0.04–0.90) | 0.036a |
| Pseudohole | NA | NA | NA | NA | NA | NA | NA | NA |
| Macular hole | NA | NA | NA | NA | NA | NA | NA | NA |
| Macular cysts | 1.93 (0.82–4.54) | 0.133 | 5.51 (3.06–9.90) | <0.001a | 1.52 (0.64–3.60) | 0.346 | 3.90 (2.11–7.22) | <0.001a |
95% CI = 95% confidence interval, DM2 = type 2 diabetes mellitus, NGM = normal glucose metabolism, OR = odds ratio.
p < 0.05.
Table 3 shows the prevalence of VMI disorders in the study population representing the general population in selected age groups by decades, that is 40 to 49 years (n = 265), 50 to 59 years (n = 775), 60 to 69 years (n = 842) and 70 to 75 years (n = 148). The prevalence of epiretinal membranes, vitreomacular traction and macular cysts increases with age (p < 0.001) (Fig. 8).
Table 3.
Prevalence of vitreomacular interface disorders in the study population representing the general study population according to age
| Age (years) | Study population representing the general population (N = 2030) | ||||
|---|---|---|---|---|---|
| 40–49 years (N = 265) | 50–59 years (N = 775) | 60–69 years (N = 842) | 70–75 years (N = 148) | p‐Value | |
| Epiretinal membrane, n (%) | 2 (0.8%) | 24 (3.1%) | 80 (9.5%) | 18 (12.2%) | <0.001a |
| Vitreomacular traction, n (%) | 4 (1.5%) | 31 (4.0%) | 85 (10.4%) | 23 (15.5%) | <0.001a |
| Lamellar hole, n (%) | 0 (0.0%) | 5 (0.6%) | 12 (1.4%) | 2 (1.4%) | 0.129 |
| Pseudohole, n (%) | 0 (0.0%) | 0 (0.0%) | 2 (0.2%) | 0 (0.0%) | 0.419 |
| Macular hole, n (%) | 0 (0.0%) | 0 (0.0%) | 0 (0.0%) | 0 (0.0%) | – |
| Macular cysts, n (%) | 1 (0.4%) | 8 (1.0%) | 20 (2.4%) | 9 (6.1%) | <0.001a |
p < 0.05.
Figure 8.
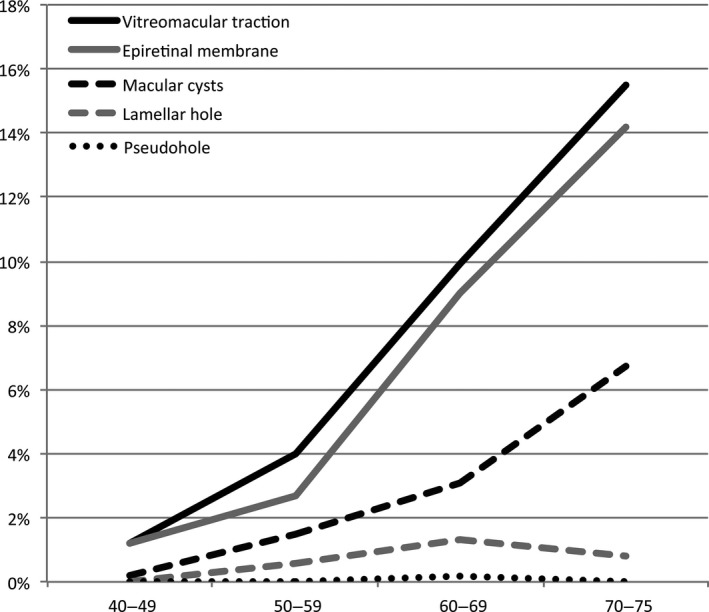
Prevalence of the vitreomacular interface disorders according to age in the study population representing the general population.
Table 4 shows the prevalence of VMI disorders according to sex in the study population representing the general population between the ages of 40 and 75 years old. Vitreomacular traction and lamellar macular holes were more frequent in women (p < 0.01).
Table 4.
Prevalence of vitreomacular interface disorders in the study population representing the general study population according to sex
| Sex | Study population representing the general population (N = 2030) | ||
|---|---|---|---|
| Male (N = 940) | Female (N = 1090) | p‐Value | |
| Epiretinal membrane, n (%) | 60 (6.4%) | 64 (5.9%) | 0.631 |
| Vitreomacular traction, n (%) | 45 (4.9%) | 98 (9.1%) | <0.001a |
| Lamellar hole, n (%) | 2 (0.2%) | 17 (1.6%) | 0.002a |
| Pseudohole, n (%) | 1 (0.1%) | 1 (0.1%) | 0.917 |
| Macular hole, n (%) | 0 (0.0%) | 0 (0.0%) | – |
| Macular cysts, n (%) | 17 (1.8%) | 21 (1.9%) | 0.845 |
p < 0.05.
Discussion
In the current study, we assessed the prevalence of VMI disorders in individuals with NGM, prediabetes and DM2. We demonstrated a higher prevalence of epiretinal membranes, vitreomacular traction and macular cysts with increasing age. In addition, we showed that vitreomacular traction and lamellar macular holes are more frequent in women.
The prevalence of vitreomacular traction syndromes and diffuse macular cysts was higher in individuals with prediabetes, and the prevalence of macular cysts was higher in individuals with DM2. The prevalence of lamellar macular holes was lower in individuals with DM2. Finally, we showed that macular cysts are associated with severity of glucose metabolism status.
As far as we know, this is the largest population‐based study assessing the prevalence of all VMI disorders until now, including 2660 participants. Furthermore, this is the first study that investigated the differences in prevalence according to glucose metabolism status. Moreover, most of the previous studies based their diagnosis on clinical examination and/or grading of fundus photographs (Klein et al. 1984, 1994; Mitchell et al. 1997; Sen et al. 2008; McCannel et al. 2009). In contrast, we performed a highly detailed volume scan consisting of 73 B‐scans with the use of spectral domain OCT. This imaging technique allows improved visualization of all VMI disorders, leading to a higher diagnostic accuracy (Mirza et al. 2007; Virgili et al. 2007).
We assessed the prevalence of the different VMI disorders in our total study population and in the study population representing the general population with the use of OCT imaging. The reported prevalence among previous studies is variable. Of the studies mentioned above, only the Beaver Dam Eye Study and the Handan Eye Study used OCT imaging for diagnosis. The other studies based their diagnosis on ophthalmologic examination and/or fundus photography. Therefore, we only compared our results with the Beaver Dam Eye Study and the Handan Eye Study.
For epiretinal membranes, we found a prevalence of 6.1% in the study population representing the general population, increasing significantly with age: 0.8% in individuals of 40 to 49 years and 12.2% in individuals of 70 to 75 years. The Handan Eye Study reported a slightly lower prevalence: 3.4% (Duan et al. 2009). The Beaver Dam Eye Study, however, showed a much higher prevalence of 34.1% (Meuer et al. 2015). Both studies confirm an increasing prevalence with increasing age (Mitchell et al. 1997; Duan et al. 2009; Meuer et al. 2015). In addition, we found no association with sex, as previously shown in the Beaver dam Eye Study (Meuer et al. 2015).
For vitreomacular traction syndromes, we found a prevalence of 7.0% (4.9% without elevation of the fovea and 2.1% with elevation of the fovea) in the study population representing the general population between the ages of 40 and 75 years old. The prevalence of this VMI disorder was higher in the Beaver Dam Eye Study (26% without elevation of the fovea, 1.6% with elevation). We also found the prevalence to be significantly higher in female than in male participants (9.1% versus 4.9%). However, Meuer et al. (2015) found no significant difference according to sex after adjustment for age. The prevalence was significantly higher with age (1.2% in individuals of 40 to 49 years and 15.5% in individuals of 70 years and older). This was also reported by Meuer et al. (2015).
For lamellar macular holes, our study showed a prevalence of 0.9% in the study population representing the general population between the ages of 40 and 75 years old. The prevalence in both study populations was significantly higher in women. The Beaver Dam Eye Study reported a higher prevalence: 3.6% and bilateral in 17.9% of the participants. They did not find a significant difference according to sex, but the prevalence was higher in older age groups: 2.1% in 63 to 74 year and 2.6% in 85 years or older.
In this study, none of the participants was diagnosed with a macular hole. The Beaver Dam Eye Study also reported a low prevalence of 0.5% (Meuer et al. 2015). As there were no participants with macular holes and only two participants with a pseudohole, we were not able to make valid calculations of the prevalence about these two disorders.
For the presence of macular cysts, we found a prevalence of 1.8%, which has not been investigated previously in a study population including individuals with NGM.
We were not able to find an explanation for the overall high prevalence reported by the Beaver Dam Eye Study in comparison with our study and the Handan Eye Study (which also found a lower prevalence in epiretinal membranes). Although the participants of the Beaver Dam Eye Study had a higher age (mean 74 years, ranging between 63 and 102 years) in comparison with our study population, this cannot explain the differences in prevalence as the age‐specific prevalence is also higher. The authors of the Beaver Dam Eye Study indicated that the difference may be due to differences in definition and variation in imaging. It may also be due to the use of OCT equipment from different manufactures.
We also investigated the prevalence of VMI disorders in individuals with prediabetes and individuals with DM2. We found no difference in prevalence of epiretinal membranes according to glucose metabolism status. The Blue Mountains Eye Study only found a significant association of late stage of epiretinal membranes with retinal folds (preretinal macular fibrosis) with diabetes (Mitchell et al. 1997). In individuals with vitreomacular traction, there was no significant difference in the prevalence according to glucose metabolism status. The prevalence of lamellar macular holes in this study is lower in individuals with DM2 compared with individuals with NGM, even after adjustment for age and sex. The association of vitreomacular traction, lamellar holes and macular holes with glucose metabolism status has not been investigated previously. As expected, the prevalence of macular cysts was significantly higher in individuals with DM2 compared with individuals with NGM. However, in our study, the prevalence was lower than reported in previous studies (Williams et al. 2004). Interestingly, the prevalence of diffuse macular cysts was already higher in individuals with prediabetes.
Some issues at study level need to be addressed. Due to oversampling of participants with DM2, prevalences for the general population need to be calculated with adjustment for oversampling. We therefore performed random exclusion of the participants with DM2 to achieve a study population representative for the general population between the ages of 40 and 75 years old. In addition, the number of participants with a lamellar macular hole, a pseudohole or macular cysts was rather low. Therefore, differences between participants with a different glucose metabolism for these VMIs may not be found in our analyses. Future longitudinal studies could focus on the causal mechanisms of VMI disorders in prediabetes and DM2.
In conclusion, the prevalence of VMI disorders in individuals aged between 40 and 75 years is 15.9%. The prevalence depends on age, sex and glucose metabolism status for several types of VMI disorders.
The Regional Association of General Practitioners (Zorg in Ontwikkeling) is gratefully acknowledged for their contribution to The Maastricht Study, enabling the invitation of individuals with type 2 diabetes using information from their web‐based electronic health record.
Funding: This research was supported by grant 122047 from Fonds NutsOhra, the Netherlands. The Maastricht Study was supported by the European Regional Development Fund via OP‐Zuid, the Province of Limburg, the Dutch Ministry of Economic Affairs (grant 31O.041), Stichting De Weijerhorst (Maastricht, the Netherlands), the Pearl String Initiative Diabetes (Amsterdam, the Netherlands), the Cardiovascular Center (CVC, Maastricht, the Netherlands), Cardiovascular Research Institute Maastricht (CARIM, Maastricht, the Netherlands), School for Public Health and Primary Care (CAPHRI, Maastricht, the Netherlands), School for Nutrition, Toxicology and Metabolism (NUTRIM, Maastricht, the Netherlands), Stichting Annadal (Maastricht, the Netherlands), Health Foundation Limburg (Maastricht, the Netherlands) and by unrestricted grants from Janssen‐Cilag B.V. (Tilburg, the Netherlands), Novo Nordisk Farma B.V. (Alphen aan den Rijn, the Netherlands) and Sanofi‐Aventis Netherlands B.V. (Gouda, the Netherlands). The OCT was supplied by Heidelberg Engineering without any restrictions.
References
- Duan XR, Liang YB, Friedman DS et al. (2009): Prevalence and associations of epiretinal membranes in a rural Chinese adult population: the Handan Eye Study. Invest Ophthalmol Vis Sci 50: 2018–2023. [DOI] [PubMed] [Google Scholar]
- Duker JS, Kaiser PK, Binder S et al. (2013): The International Vitreomacular Traction Study Group classification of vitreomacular adhesion, traction, and macular hole. Ophthalmology 120: 2611–2619. [DOI] [PubMed] [Google Scholar]
- Girach A & Lund‐Andersen H (2007): Diabetic macular oedema: a clinical overview. Int J Clin Pract 61: 88–97. [DOI] [PubMed] [Google Scholar]
- Klein R, Klein BE & Moss SE (1984): Visual impairment in diabetes. Ophthalmology 91: 1–9. [PubMed] [Google Scholar]
- Klein R, Klein BE, Wang Q & Moss SE (1994): The epidemiology of epiretinal membranes. Trans Am Ophthalmol Soc 92: 403–425; discussion 425–430. [PMC free article] [PubMed] [Google Scholar]
- Klein R, Knudtson MD, Lee KE, Gangnon R & Klein BE (2009): The Wisconsin Epidemiologic Study of Diabetic Retinopathy XXIII: the twenty‐five‐year incidence of macular edema in persons with type 1 diabetes. Ophthalmology 116: 497–503. [DOI] [PMC free article] [PubMed] [Google Scholar]
- McCannel CA, Ensminger JL, Diehl NN & Hodg DN (2009): Population‐based incidence of macular holes. Ophthalmology 116: 1366–1369. [DOI] [PMC free article] [PubMed] [Google Scholar]
- Meuer SM, Myers CE, Klein BE et al. (2015): The epidemiology of vitreoretinal interface abnormalities as detected by spectral‐domain optical coherence tomography: the beaver dam eye study. Ophthalmology 122: 787–795. [DOI] [PMC free article] [PubMed] [Google Scholar]
- Mirza RG, Johnson MW & Jampol LM (2007): Optical coherence tomography use in evaluation of the vitreoretinal interface: a review. Surv Ophthalmol 52: 397–421. [DOI] [PubMed] [Google Scholar]
- Mitchell P, Smith W, Chey T, Wang JJ & Chang A (1997): Prevalence and associations of epiretinal membranes. The Blue Mountains Eye Study, Australia. Ophthalmology 104: 1033–1040. [DOI] [PubMed] [Google Scholar]
- Nielen MMJ (2014): Incidentie en prevalentie van gezondheidsproblemen in de Nederlandse huisartsenpraktijk [WWW document]. Available at: http://www.nivel.nl/nl/incidentie-en-prevalentiecijfers-in-de-huisartsenpraktijk (Accessed on 3 Feb 2016)
- Rahmani B, Tielsch JM, Katz J, Gottsch J, Quigley H, Javitt J & Sommer A (1996): The cause‐specific prevalence of visual impairment in an urban population. The Baltimore Eye Survey. Ophthalmology 103: 1721–1726. [DOI] [PubMed] [Google Scholar]
- Schram MT, Sep SJ, van der Kallen CJ, Dagnelie PC, Koster A, Schaper N, Henry RM & Stehouwer CD (2014): The Maastricht Study: an extensive phenotyping study on determinants of type 2 diabetes, its complications and its comorbidities. Eur J Epidemiol 29: 439–451. [DOI] [PubMed] [Google Scholar]
- Sen P, Bhargava A, Vijaya L & George R (2008): Prevalence of idiopathic macular hole in adult rural and urban south Indian population. Clin Exp Ophthalmol 36: 257–260. [DOI] [PubMed] [Google Scholar]
- Syed YY & Dhillon S (2013): Ocriplasmin: a review of its use in patients with symptomatic vitreomacular adhesion. Drugs 73: 1617–1625. [DOI] [PubMed] [Google Scholar]
- Virgili G, Menchini F, Dimastrogiovanni AF, Rapizzi E, Menchini U, Bandello F & Chiodini RG (2007): Optical coherence tomography versus stereoscopic fundus photography or biomicroscopy for diagnosing diabetic macular edema: a systematic review. Invest Ophthalmol Vis Sci 48: 4963–4973. [DOI] [PubMed] [Google Scholar]
- Wang S, Xu L & Jonas JB (2006): Prevalence of full‐thickness macular holes in urban and rural adult Chinese: the Beijing Eye Study. Am J Ophthalmol 141: 589–591. [DOI] [PubMed] [Google Scholar]
- WHO (2006): Definition and diagnosis of diabetes mellitus and intermediate hyperglycemia: report of a WHO/IDF consultation. Geneva, Switzerland: WHO. [Google Scholar]
- Williams R, Airey M, Baxter H, Forrester J, Kennedy‐Martin T & Girach A (2004): Epidemiology of diabetic retinopathy and macular oedema: a systematic review. Eye 18: 963–983. [DOI] [PubMed] [Google Scholar]


