Abstract
Background
Prostate cancer (PCa) is one of the most malignant tumors of the male urogenital system. There is an urgent need to identify novel biomarkers for PCa.
Methods
In this study, we evaluated the expression levels of MCM10 in prostate cancer by analyzing public datasets (including The Cancer Genome Atlas and GSE21032). Furthermore, loss of function assays was performed to evaluate the effects of MCM10 on cell proliferation, apoptosis, and colony formation. Furthermore, we performed microarray and bioinformatics analyses to explore the potential mechanisms of MCM10.
Results
In the present study, we for the first time revealed MCM10 was significantly upregulated in PCa. Moreover, we found increased MCM10 expression was significantly associated with advanced clinical stage and high Gleason score PCa. Kaplan‐Meier analysis demonstrated higher MCM10 expression was associated with a poorer patient prognosis in PCa. Furthermore, loss of function assays showed that MCM10 knockdown inhibited cell proliferation and colony formation, but promoted cell apoptosis. Additionally, we performed microarray and bioinformatics analysis and found MCM10 regulated PCa progression by regulating a series of biological processes including cancer, cell death, and apoptosis.
Conclusions
These results suggest that MCM10 may be a potential diagnostic and therapeutic target for PCa.
Keywords: MCM10, prognosis, proliferation, prostate cancer, survival
1. INTRODUCTION
Prostate cancer (PCa) is one of the most malignant tumors of the male urogenital system and the leading cause of cancer‐related deaths in males worldwide.1, 2 In the past decades, a lot of research efforts were paid to identify the common mechanism underlying PCa progression. A series of pathways, including androgen signaling,3 TP53 signaling,4 and Wnt signaling5, 6 were found to be involved in PCa. Of note, many underlying mechanisms still remained to be elucidated. For example, the drivers of abnormal proliferation in prostate cancer,7 which is one of the common hallmarks of cancer, remain largely unclear. Thus, identifying novel regulators as diagnostic and therapeutic targets for PCa are still urgently required.
Minichromosome maintenance 10 replication initiation factor (MCM10) is a conserved component of the eukaryotic replisome that brings together the MCM2‐7 helicase and the DNA polymerase alpha/primase complex to initiate DNA replication.8, 9 Previous studies show MCM10 is often dysregulated under pathological conditions.9, 10, 11, 12 Genetic amplification and/or overexpression of MCM10 were also observed in different types of human cancers.13, 14, 15 For instance, Cheng et al15 found a series of replicative helicase proteins, such as MCM10, MCM2, MCM4, MCM5, and MCM6 were overexpressed in cervical cancer. Lu et al16 also observed MCM10 was up‐regulated in esophageal cancer. These findings suggested MCM10 could serve as a prognostic marker for cancers. However, no studies about MCM10 were reported in prostate cancer.
The present study for the first time revealed MCM10 is up‐regulated in PCa by analyzing public datasets (including The Cancer Genome Atlas [TCGA]17, 18 and Taylor dataset19). In addition, experimental studies were performed to explore the potential roles of MCM10 in regulating cell proliferation and cell apoptosis. Moreover, microarray analysis was also performed to explore downstream targets of MCM10 in PCa. The present study may provide useful information to identify MCM10 as a novel therapeutic and prognostic target for PCa.
2. MATERIALS AND METHODS
2.1. Patients and clinicopathological data
The gene expression data of 490 patients with PCa were downloaded from (TCGA, https://tcga-data.nci.nih.gov/tcga/) database by using Firebrowse dataset (http://firebrowse.org/). Level 3 raw expression data of MCM10 from the Illumina HiSeq2000 sequencing platform (Illumina, Inc., San Diego, CA) were downloaded from TCGA data portal. Patient clinical features, including age at diagnosis, days to last follow‐up, pathological tumor (T) stage and node (N) stage, were retrospectively obtained from patient records. All the patients were staged using the 2009 tumor‐node‐metastasis classification of the American Joint Committee on Cancer/International Union Against Cancer.20 In order to further investigate the prognostic value of MCM10 in PCa, the overall survival rates of patients with high or low MCM10 expression were assessed using the Kaplan‐Meier method by using GSE21032 dataset which was reported by Taylor et al.19
2.2. Lentiviral constructs and transfections
Recombinant lentiviral vectors carrying MCM10 small interfering RNA (shRNA) were constructed using standard molecular techniques. 293T cells were infected with the recombinant lentiviral vectors using Lipofectamine 2000 (Thermo Fisher Scientific, Inc., Waltham, MA) to generate stably transfected cells, according to the manufacturer's protocol. Opti‐modified Eagle's medium (Opti‐MEM) which was ideal for use during cationic lipid transfections especially Lipofectamine™ transfection reagents was purchased from Thermo Fisher Scientific, Inc. (Catalog number: 31985062). Concentrated lentiviruses were transfected at a multiplicity of infection (MOI) of 40 in serum‐free RPMI‐1640 medium. The supernatant was replaced with complete culture medium (RPMI‐1640 medium containing 10% fetal bovine serum (GE Healthcare Life Sciences, Little Chalfont, United Kingdom) after 24 h. The expression of MCM10 shRNA in infected cells was determined by reverse transcription‐quantitative polymerase chain reaction (RT‐qPCR). The MCM10 shRNA sequence was as follows: 3′‐CCGGGACGGCGACGGTGAATCTTATCTCGAGATAAGATTCACCGTCGCCGTCTTTTT‐5′, which was purchased from Shanghai GenePharma Co., Ltd. (Shanghai, China).
2.3. Cell culture
Prostate cancer LNCaP, PC‐3, and DU145 cells were purchased from Cell Bank of Chinese Academy of Sciences (Shanghai, China) where they were authenticated by mycoplasma detection, DNA‐Fingerprinting, isozyme detection, and cell vitality detection. All experiments were carried out on each cell line at passages below 30. These PCa cells were cultured in RPMI‐1640 medium containing 10% fetal bovine serum (GE Healthcare Life Sciences), 100 U/mL penicillin and 100 µg/mL streptomycin, and were cultured at 37°C in 5% CO2.
2.4. RT‐qPCR
Total RNA was extracted from LNCaP, DU145, and PC‐3 cells using TRIzol reagent (Invitrogen, Waltham, MA; Thermo Fisher Scientific, Inc.). cDNA was synthesized using a PrimeScript RT reagent kit (Takara Biotechnology Co., Ltd., Dalian, China). qPCR was performed with cDNA samples using the iQSYBR Green Supermix and ABI Prism 7900 platform (both Bio‐Rad Laboratories, Inc., Hercules, CA), according to the manufacturer's protocol. PCR cycling conditions were 50°C for 2 min, followed by 95°C for 10 min and then 40 cycles for 95°C for 15 s and 60°C for 1 min. The 2−ΔΔCt method was used to calculate the relative expression level by normalizing to GAPDH levels. The primers used in this study are listed in Supplementary Table S1. Each sample was run in triplicate to ensure quantitative accuracy.
2.5. Plate analysis with the adherent cell cytometry system Celigo®
The adherent cell cytometry system, Celigo®, (analyzed by Application Programing Interface, version 1.0, software) allowed rapid quantification of cellular fluorescence expression as previously described.21 Plates were analyzed using the adherent cell cytometer equipped with bright field and fluorescent channels. Gating parameters were adjusted for each fluorescence channel to exclude background and other non‐specific signals. The Celigo® system provided a gross quantitative analysis for each fluorescence channel and individual well, including total count and average integrated red fluorescence intensity of gated events.
2.6. Cell proliferation assay
An MTT assay was also performed in order to evaluate changes in cell proliferation. A total of 5000 transfected DU145 and PC‐3 cells were seeded onto 96‐well plates at a final volume of 100 μL medium/well (RPMI‐1640 medium containing 10% fetal bovine serum [GE Healthcare Life Sciences]). At each time point (including 0, 24, 48, 72, and 96 h), cells were stained with MTT dye (0.5 mg/mL Sigma‐Aldrich; Merck KGaA; St. Louis, MO) for 4 h at 37°C, followed by the removal of the culture medium and addition of 150 μL dimethyl sulfoxide (Sigma‐Aldrich; Merck KGaA). Then, the plates were monitored using a PowerWave XS Microplate reader (BioTek Instruments, Inc., Winooski, VT), which measured absorbance at 490 nm. The absorbance at 570 nm was used as a reference. Each experiment was performed at least in triplicate.
2.7. Cell apoptosis assay
Following transfection for 48 h, cells were harvested and washed with phosphate‐buffered saline (PBS) for three times. Cells were assayed with an Annexin V‐APC Apoptosis Detection kit (eBioscience; Thermo Fisher Scientific, Rockford IL) and were analyzed using a flow cytometer (BD Biosciences, Franklin Lakes, NJ).
2.8. Colony formation assays
PC‐3‐shctrl, PC‐3‐shMCM10, DU145‐shctrl, and DU145‐shMCM10 cells were plated on 60‐mm plates (0.5 × 10³ cells per plate) and cultured at 37°C for 10 days. The colonies were stained with 1% crystal violet (Sigma‐Aldrich; Merck KGaA) for 30 s following fixation with 10% formaldehyde for 5 min at room temperature.
2.9. Microarray and expression datasets
Total RNA was extracted from three shMCM10 samples and three shRNA control samples using TRIzol reagent (Invitrogen; Thermo Fisher Scientific) and the RNeasy mini kit (Qiagen GmbH, Hilden, Germany). Total RNA was quantified by the NanoDrop ND‐2000 (Thermo Fisher Scientific, Inc.) and the RNA integrity was assessed using Agilent Bioanalyzer 2100 (Agilent Technologies, Inc., Santa Clara, CA).
Global expressions of mRNAs in three MCM10 shCtrl samples and three shMCM10 were examined using the Gene Chip Prime View Human Gene Expression Array (Thermo Fisher Scientific, Inc.). The sample labeling, microarray hybridization and washing were performed according to the manufacturer's protocols. Raw data were normalized using the log2 scale. Two‐class unpaired significance analysis of microarray (19) was employed to filter significantly differentially expressed mRNAs between shCtrl and shMCM10. To begin with, the raw data were normalized using the quantile algorithm. The probes for which ≥1 out of two conditions have flags in “P” were selected for further data analysis. Differentially expressed mRNAs were subsequently identified through fold change. The threshold set for upregulated and downregulated genes was a fold change ≥1.5. Subsequently, Kyoto Encyclopedia of Genes and Genomes (KEGG) pathway and Gene Ontology (GO) analyses of differently expressed downstream genes of MCM10 were performed using an Ingenuity Pathway Analysis system (https://www.qiagenbioinformatics.com/products/ingenuity-pathway-analysis/www.ingenuity.com).
2.10. Statistical analysis
The differences between two groups in gene expression, cell apoptosis, colony number and migrated cell number were evaluated using Student's t‐test. The statistical significance of differences in multiple groups was determined by using the Kruskal‐Wallis H test. Kaplan‐Meier analysis, followed by the log‐rank test, were utilized to assess the association between MCM10 and overall survival and biochemical recurrence (BCR)‐free survival of PCa. All statistical analyses were conducted using GraphPad Prism software 5.0 (GraphPad Software, Inc., La Jolla, CA). P < 0.05 was considered to indicate a statistically significant difference.
3. RESULTS
3.1. MCM10 was upregulated in PCa
In order to evaluate the expression pattern of MCM family members in PCa, we analyzed TCGA database, which included 52 matched normal prostate samples and 419 PCa samples. We observed MCM10, MCM2, MCM3, and MCM7 were differently expressed in PCa samples compared to match normal samples, however, we did not observe any expression difference of MCM4, MCM5, MCM6, MCM8, and MCM9 between PCa samples and normal samples (Supplementary Figure S1). Among these differently expressed MCM family members, we focused on MCM10 in this study, which was not previously reported in PCa. We found MCM10 was significantly upregulated in PCa samples compared to normal tissues. Of note, more than 90% of PCa tissues expressed high levels of MCM10, while only ∼10% (3/38) of matched normal tissues expressed high levels of MCM10 (Figure 1C). Additionally, we also observed MCM10 was highly expressed in PCa cell lines by using RT‐PCR analysis (Figure 1D). Furthermore, we evaluated the correlation of MCM10 with DNA methylation and MCM10 amplification or deletion. From our results, we observed MCM10 expression was not significantly correlated with the CNV status (Supplementary Figure S3A) or DNA methylation status in PCa (Supplementary Figure S3B). Androgen receptor (AR) is the most important regulator of PCa progression. We found MCM10 was not a AR‐regulated gene by analyzing GSE18684 dataset.
Figure 1.
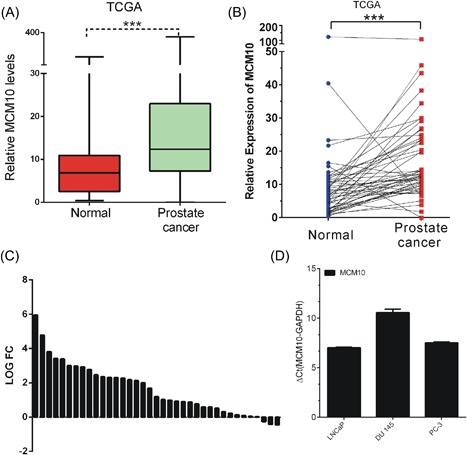
MCM10 expression was upregulated in PCa samples. A‐B, TCGA data analysis showed MCM10 expression levels were significantly up‐regulated in prostate tumors compared to normal prostate tissues by analyzing all tumor samples (A) and paired samples (B). C, MCM10 expression was higher in more than 90% (35/38) of PCa samples compared with adjacent normal tissues by analyzing the TCGA cohorts. D, MCM10 were highly expressed in PCa cell lines LNCaP, PC‐3, DU145. P < 0.05 was considered to indicate a statistically significant difference. *P < 0.05; **P < 0.01; ***P < 0.001. MCM10, Minichromosome maintenance 10 replication initiation factor; PCa, prostate cancer; TCGA, The Cancer Genome Atlas. [Color figure can be viewed at http://wileyonlinelibrary.com]
To characterize the functions of MCM10 in PCa, MCM10 shRNA was used to knockdown MCM10 expression at the mRNA and protein levels. Compared to treatment with the scrambled shRNA control, MCM10‐specific shRNA substantially decreased MCM10 mRNA and protein levels in DU145, PC‐3, and LNCaP cells (Figure 2A‐F).
Figure 2.
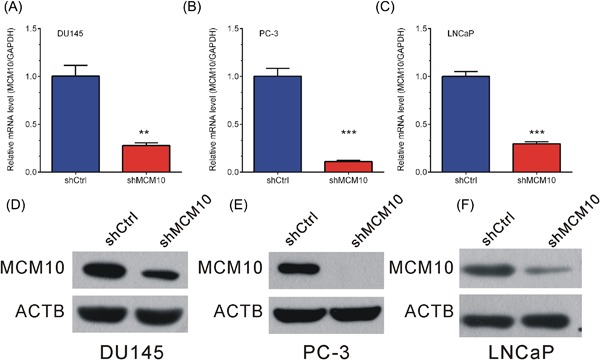
MCM10 knockdown inhibits its expression levels in DU145 and PC‐3 cells. A‐C, Real‐time reverse transcription PCR analysis showed expression of MCM10 mRNA was reduced after transfection with the indicated shRNAs in DU145 (A) PC‐3 (B) and LNCaP (C) cells. D‐F, Western blot analysis showed protein expression of MCM10 was reduced after transfection with the indicated shRNAs in DU145 (D), PC‐3 (E), and LNCaP (F) cells. Data are represented as the mean ± SD (*P < 0.05; **P < 0.01; ***P < 0.001, Student's t‐test). [Color figure can be viewed at http://wileyonlinelibrary.com]
3.2. MCM10 knockdown inhibits cell proliferation in PCa cells
Furthermore, we evaluated the effects of MCM10 on cell proliferation in DU145 and PC‐3 cells. Celigo Cell Counting indicated that DU145 (Figures 3A and 3C) and PC‐3 (Figures 3B and 3D) cell growth were slower in MCM10‐shRNA‐transfected group than in negative control group (P < 0.05) after 4 days. In addition, we performed MTT assay to evaluate the growth rate of DU145 and PC‐3 after MCM10 knockdown. As shown in Figure 3, we observed MCM10 knockdown could inhibit cell proliferation in DU145 (Figure 3E) and PC‐3 (Figure 3F) cells.
Figure 3.
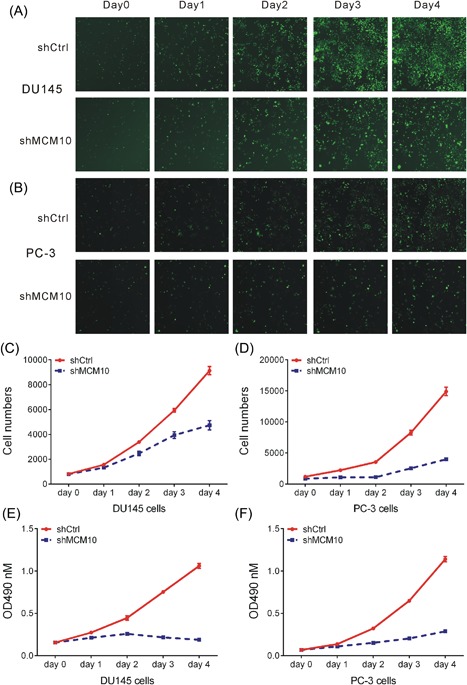
MCM10 knockdown inhibits cell proliferation in PCa cells. A‐B, The Celigo® system revealed that knockdown of MCM10 inhibited cell proliferation in DU145 (A) and PC‐3 (B) cells. C‐D, The cell counting show significant decrease in shMCM10 group compared to shCtrl group in DU145 (C) and PC‐3 (D) cells. E‐F, An MTT assay demonstrated that knockdown of MCM10 inhibited cell proliferation in DU145 (E) and PC‐3 (F) cells. Each experiment was performed in triplicate (n = 3). *P < 0.05; **P < 0.01; ***P < 0.001. MCM10, Minichromosome maintenance 10 replication initiation factor; Ctrl, control; OD, optical density; sh, short hairpin. [Color figure can be viewed at http://wileyonlinelibrary.com]
3.3. Suppression of MCM10 expression induces apoptosis of PCa cells
To determine whether MCM10 affected the apoptosis ability of the human prostate cancer cells, Annexin V‐APC staining and flow cytometric analysis were performed. The ratio of cells undergoing apoptosis was markedly increased in the MCM10 shRNA virus‐infected DU145 cells, compared with Shctrl (Figures 4A and 4B). Similar results were observed in PC‐3 (Figures 4C and 4D) and LNCaP (Figures 4E and 4F) cells. These data obtained in the present study indicated that MCM10 may play an important anti‐apoptosis role in human prostate cancer cells.
Figure 4.
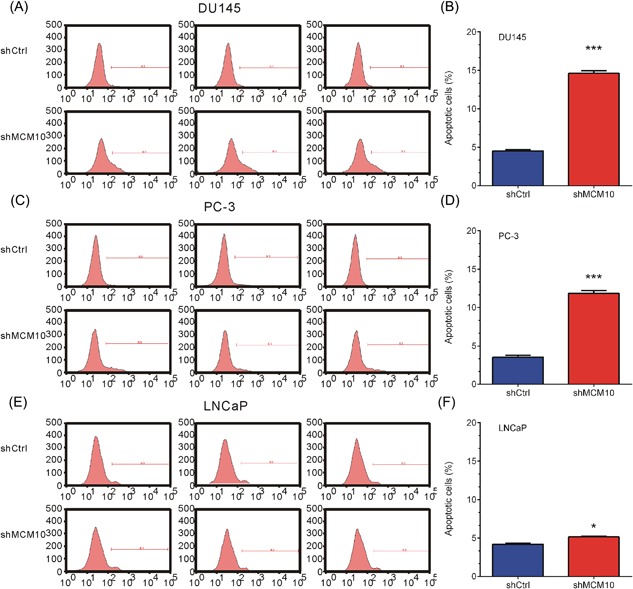
MCM10 knockdown promotes apoptosis of prostate cancer cells. A, C, E, Flow cytometric analysis showed MCM10 knockdown promoted apoptosis of DU145 (A), PC‐3 (C), and LNCaP (E) cells by using an Annexin V‐APC Apoptosis Detection kit. B, D, F, Quantitative representation of the shMCM10‐induced apoptosis of DU145 (B), PC‐3 (D), and LNCaP (F) cells. The cell apoptosis analysis results are presented as the mean ± standard deviation (n = 3). P < 0.05 was considered to indicated a statistically significant difference. *P < 0.05; **P < 0.01; ***P < 0.001. MCM10, Minichromosome maintenance 10 replication initiation factor; Ctrl, control; sh, short hairpin. [Color figure can be viewed at http://wileyonlinelibrary.com]
3.4. Knockdown of MCM10 suppressed PCa cell colony formation
Furthermore, we studied the functions of MCM10 knockdown on DU145 and PC‐3 cell tumorigenesis in vitro by assaying colony formation. The results indicated that compared with cells in the control group, cells in the shMCM10 group significantly inhibited the ability of DU145 (Figures 5A and 5B) and PC‐3 (Figures 5C and 5D) cells to form colonies (P < 0.05).
Figure 5.
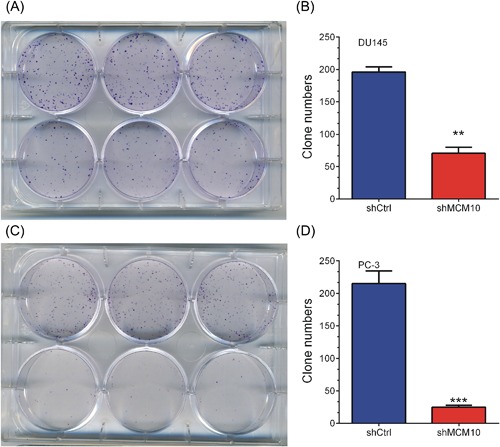
MCM10 knockdown significantly reduced colony formation of prostate cancer cells. A, MCM10 knockdown significantly reduced colony formation of DU145 cells. B, Quantitative representation of the DU145 colony formation following MCM10 knockdown. C, MCM10 knockdown significantly reduced colony formation of PC‐3 cells. D, Quantitative representation of the PC‐3 colony formation following MCM10 knockdown. The results are presented as the mean ± standard deviation (n = 3). *P < 0.05; **P < 0.01; ***P < 0.001. MCM10, Minichromosome maintenance 10 replication initiation factor; Ctrl, control; PCa, prostate cancer; sh, short hairpin. [Color figure can be viewed at http://wileyonlinelibrary.com]
3.5. Identification of MCM10 regulated genes in PCa
In this study, mRNA expression profiling was used to identify MCM10 regulated genes in PCa following MCM10 knockdown. Analysis of the microarray data revealed 1015 upregulated and 808 downregulated genes after MCM10 knockdown in PC‐3 cells, with an average expression level >1.5‐fold (P < 0.05; Figure 6A‐C). Subsequently, KEGG pathway and GO analyses of differently expressed downstream genes of MCM10 were performed using an Ingenuity Pathway Analysis system (http://www.ingenuity.com).
Figure 6.
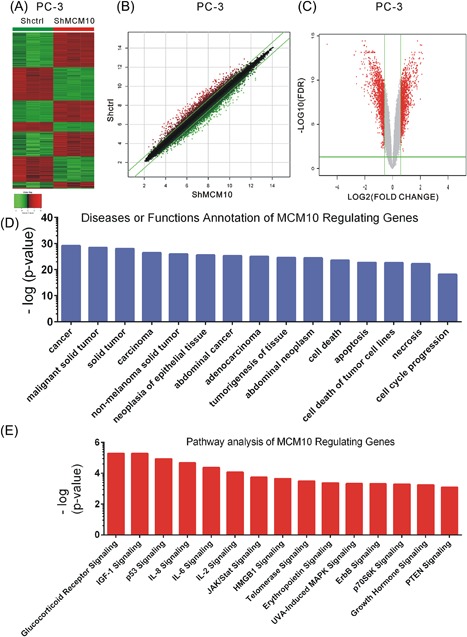
Identification of MCM10 regulating genes in PC‐3. A‐C, Heatmap (A), scatter plot (B), and volcano plot (C) demonstrate differential genes expression following MCM10 knockdown. (D) IPA analysis demonstrated the most significant potential diseases and functions effected by MCM10 knockdown in PCa. (E) IPA analysis demonstrated the most significant potential pathways regulated by MCM10. MCM10, Minichromosome maintenance 10 replication initiation factor; sh, short hairpin; Ctrl, control; IPA, ingenuity pathway analysis; KD, knockdown; NC, negative control; PCa, prostate cancer. [Color figure can be viewed at http://wileyonlinelibrary.com]
Our analysis showed MCM10 was most significantly associated with cancer, cell death, apoptosis, cell death of tumor cell lines, necrosis, and cell cycle progression (Figure 6D). KEGG analysis showed MCM10 was most significantly associated with glucocorticoid receptor signaling, IGF‐1 signaling, p53 signaling, IL‐8 signaling, IL‐6 signaling, IL‐2 signaling, JAK/Stat signaling, HMGB1 signaling, telomerase signaling, erythropoietin signaling, UVA‐induced MAPK signaling, ErbB signaling, p70S6K signaling, growth hormone signaling, and PTEN signaling (Figure 6E).
3.6. Knockdown of MCM10 regulates cell proliferation related genes in PCa
In order to explore mechanism of MCM10 regulating cell proliferation, we constructed a network (Figure 7). Furthermore, 30 downstream targets (14 down‐regulated and 16 up‐regulated genes after MCM10 knockdown) of MCM10 were selected for further validation (Figure 8A). Consistent with our microarray analysis, we found 13 genes (MCM10, WWTR1, CYR61, SLC39A10, NCOA3, MAD2L1, EGFR, CAV1, SATB2, SPP1, PIK3CB, MDM2, and MAPK9) were suppressed after MCM10 knockdown (Figure 8B). However, 15 genes (KLF4, NR3C1, JUN, ING3, CDKN1A, TP53I3, PTK2B, CDK6, OLR1, INHBA, TGFBR3, SNAI2, CD47, ICAM1, and LTB) were induced following MCM10 knockdown (Figure 8C). These results together with our previous analysis showed that MCM10 acts as a key regulator in PCa progression.
Figure 7.
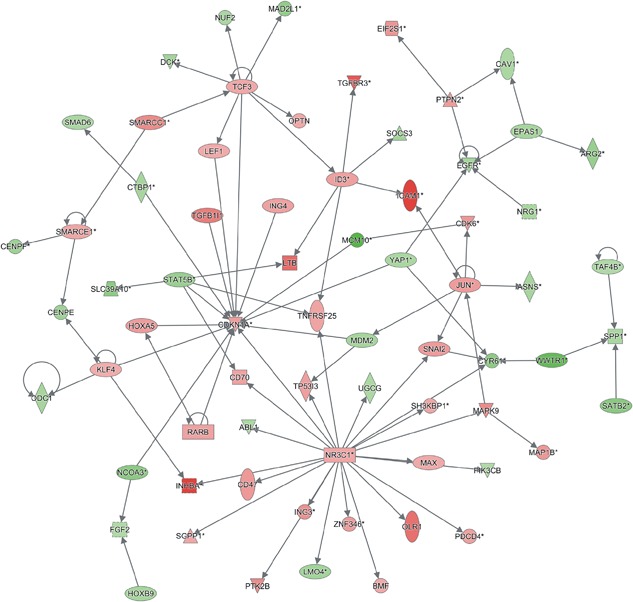
Construction of MCM10 regulating cell proliferation networks. By analyzing MCM10 regulating genes, we constructed MCM10 mediated cell proliferation‐related networks. Red nodes, up‐regulated genes after MCM10 knockdown; green nodes, down‐regulated genes after MCM10 knockdown. [Color figure can be viewed at http://wileyonlinelibrary.com]
Figure 8.
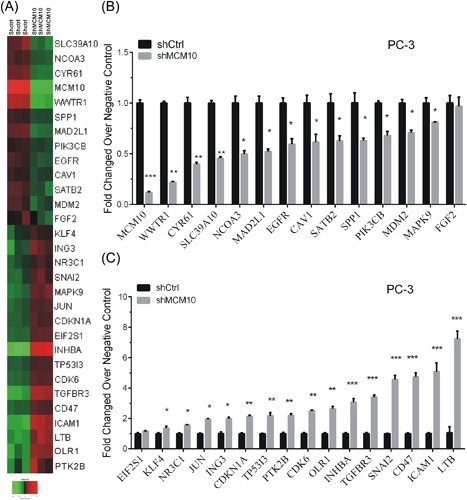
Knockdown of MCM10 regulates cell proliferation‐related genes in PC‐3. A, Heatmap showed expression levels of 30 MCM10 targets after MCM10 knockdown in PC‐3. B, Real‐time reverse transcription PCR analysis showed 13 genes were downregulated after MCM10 knockdown. C, Real‐time reverse transcription PCR analysis showed 15 genes were up‐regulated after MCM10 knockdown in PC‐3. The results are presented as the mean ± standard deviation (n = 3). *P < 0.05; **P < 0.01; ***P < 0.001. Ctrl, control; MCM10, minichromosome maintenance 10 replication initiation factor; PCa, prostate cancer; sh, short hairpin. [Color figure can be viewed at http://wileyonlinelibrary.com]
3.7. Upregulation of MCM10 predicts a poor prognosis in PCa
In the present study, we also evaluated the association between MCM10 mRNA expression levels in tumor tissues and clinicopathological factors in PCa. We found that MCM10 levels were higher in N1 stage PCa samples than in N0 stage PCa samples (Figure 9A). Moreover, analysis of the TCGA database demonstrated that a significantly higher expression of MCM10 was observed in Gleason 7 (P < 0.05), Gleason 8 (P < 0.01), and Gleason 9 (P < 0.001) patients compared with Gleason 6 patients (Figure 9B).
Figure 9.
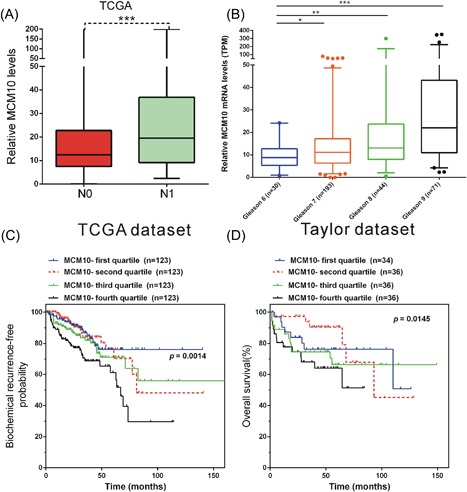
Upregulation of MCM10 predicts a poor prognosis in PCa. A, MCM10 expression was upregulated in N1 PCa cases compared with N0 PCa cases. B, MCM10 expression was upregulated in Gleason 7, Gleason 8, and Gleason 9 PCa cases compared with Gleason 6 cases. C, The BCR‐free survival rates were higher in patients with low MCM10 expression in the TCGA dataset. D, By analyzing Taylor dataset, the overall survival rates were also observed to be higher in MCM10‐low compared to MCM10‐high patients. *P < 0.05; **P < 0.01; ***P < 0.001. MCM10, Minichromosome maintenance 10 replication initiation factor; PCa, prostate cancer; TCGA, The Cancer Genome Atlas; TPM, transcripts per kilobase million. [Color figure can be viewed at http://wileyonlinelibrary.com]
Kaplan‐Meier curve method was performed to assess the association of MCM10 expression with BCR‐free survival and overall survival in PCa patients by using Taylor and TCGA dataset. As demonstrated in Figure 9C, compared with patients with high MCM10 expression, the BCR‐free survival rates were significantly higher in patients with low MCM10 expression in the TCGA dataset (P < 0.01). By analyzing Taylor dataset, the overall survival rates were also observed to be higher in MCM10‐low compared to MCM10‐high patients (Figure 9D, P < 0.01, MCM10‐first quartile vs fourth quartile).
4. DISCUSSION
PCa is one of the most frequently diagnosed types of cancer worldwide.2 Although PSA is the most widely used biomarker of PCa, the poor sensitivity and specificity of PSA level testing are still a big challenge when applying it for PCa diagnosis.22, 23, 24 Therefore, there is an urgent demand to identify novel biomarkers for the treatment of patients with PCa. In present study, we screened expression patterns of MCM family members (including MCM10, MCM2, MCM3, MCM7, MCM4, MCM5, MCM6, MCM8, and MCM9) in PCa. We observed MCM10, MCM2, MCM3, MCM7 were differently expressed in PCa samples compared to match normal samples. In present study, we focused on MCM10 in this study which was not previously reported in PCa. MCM10 is a replication initiation factor that plays functions together with the MCM2‐7 helicase and the DNA polymerase alpha/primase complex.8, 9 Previous studies have observed MCM10 is overexpressed in different types of human cancers, such as medulloblastoma,13 cervical cancer,15 and esophageal cancer.16 Furthermore, Li et al demonstrated that MCM2 and MCM10 were the two most significantly upregulated genes in urothelial carcinoma progression among the MCM gene family.14 However, the functional roles and prognostic values of MCM10 remained largely unclear.
In the present study, we for the first time demonstrated that MCM10 was significantly upregulated in PCa samples. Furthermore, we found MCM10 levels were higher in N1 stage than N0 stage PCa samples. Of note, the higher expression levels of MCM10 were observed in higher Gleason scores PCa (Gleason 7‐9) compared to Gleason 6 PCa. Furthermore, Kaplan‐Meier analysis revealed that overexpression of MCM10 in PCa were associated with shorter BCR‐free and overall survival time compared to MCM10 low expression PCa. Moreover, we also evaluated RECQL4 expression pattern in PCa. RECQL4 plays roles in both DNA repair and DNA replication. Several studies reported RECQL4 interacted directly with MCM10 and RECQL4‐MCM10 interaction was important for efficient replication origin firing.25, 26, 27, 28 However, we found RECQL4 was not differentially expressed in PCa compared to normal samples. To the best of our knowledge, this study is the first to report that MCM10 is involved in the prognosis of PCa.
In the present study, we knocked down MCM10 expression in PCa cells and evaluated the effect of its knockdown on cell proliferation, colony formation, and cell apoptosis. We observed MCM10 knockdown significantly inhibited cell proliferation and colony formation, but promoted cell apoptosis in PCa. As far as we know, there are no reports regarding the role of MCM10 in PCa, and this is the first study to report MCM10 acts as an oncogene in PCa.
In previous studies, several upstream regulators of MCM10 had been revealed. For example, The E2F/Rb pathway29 and GATA630 could regulate MCM10 transcription. E3 ubiquitin ligase RBBP6 promoted MCM10 transcription by ubiquitinating and destabilizing the transcriptional repressor ZBTB38.10 MiRNAs, such as miR‐215, were also reported as MCM10 regulators by inhibiting its expression.31 However, the downstream genes of MCM10 in PCa remained unknown. In order to further investigate the functional roles of MCM10 in PCa, bioinformatics analysis was performed, in combination with a high‐throughput array. A total of 1015 genes were identified to be upregulated and 808 genes were identified to be downregulated following MCM10 knockdown. Our analysis showed MCM10 was associated with cancer, cell death, apoptosis, cell death of tumor cell lines, necrosis, and cell cycle progression. KEGG analysis showed MCM10 was associated with Glucocorticoid Receptor signaling, IGF‐1 signaling, and p53 signaling. To reveal how MCM10 effect cell proliferation, we constructed a proliferation‐related network. RT‐PCR analysis results showed 13 genes (MCM10, WWTR1, CYR61, SLC39A10, NCOA3, MAD2L1, EGFR, CAV1, SATB2, SPP1, PIK3CB, MDM2, and MAPK9) were suppressed and 15 genes (KLF4, NR3C1, JUN, ING3, CDKN1A, TP53I3, PTK2B, CDK6, OLR1, INHBA, TGFBR3, SNAI2, CD47, ICAM1, and LTB) were induced after MCM10 knockdown in PCa. Of note, previous studies had reported these genes were associated with cancer cell proliferation. For instance, CYR61 promoted breast cancer lung metastasis by facilitating tumor cell extravasation and suppressing anoikis32, 33 and PIK3CB was required for the growth of ERBB2 and RAS driven tumors.34
5. CONCLUSIONS
In conclusion, the present study for the first time reported MCM10 expression was upregulated in clinical samples. MCM10 knockdown decreased cell proliferation and colony formation, but promoted cell apoptosis in PCa cell lines. By using microarray and bioinformatics analysis, we found MCM10 regulated PCa progression by regulating a series of biological processes including cancer, cell death, and apoptosis. Of note, overexpression of MCM10 in PCa was associated with poorer patient prognosis. These results suggest that MCM10 may be a useful diagnostic and therapeutic target in PCa.
CONFLICTS OF INTEREST
There is no conflict of interest to disclose.
Supporting information
Additional supporting information may be found online in the Supporting Information section at the end of the article.
Figure S1. TCGA analysis showed expression patterns of MCM family members in PCa. (A‐I).
Figure S2. Taylor dataset analysis showed MCM2, MCM3, MCM7 and RECQL4 were not associated with PCa prognosis.
Figure S3. MCM10 expression was not significantly correlated with the DNA methylation status and CNV status in PCa.
Figure S4. DepMap dataset analysis showed MCM10 knockout inhibited prostate cancer cell proliferation.
AUTHORS’ CONTRIBUTIONS
JH and SN were involved in the study design; FC, JH, SN, and JT were involved in the development of the methodology. FC, JT, SN, and HT were involved in the acquisition of the data; FC and SN conducted data analysis; FC, JH, SN, HT, and JT wrote, reviewed, and/or revised the manuscript; FC and JH provided technical or material support.
ACKNOWLEDGMENTS
Social Development Plan of Jiangsu Province‐Standardization of key disease diagnosis and treatment project, BE2016715. Jiangsu Province youth medical key talent program, QNRC2016457.
Cui F, Hu J, Ning S, Tan J, Tang H. Overexpression of MCM10 promotes cell proliferation and predicts poor prognosis in prostate cancer. The Prostate. 2018;78:1299–1310. 10.1002/pros.23703
Contributor Information
Jianpeng Hu, Email: 249056614@qq.com.
Songyi Ning, Email: nsy@msn.cn.
REFERENCES
- 1. Wan XC, Huang WH, Yang S, et al. Identification of androgen‐responsive lncRNAs as diagnostic and prognostic markers for prostate cancer. Oncotarget. 2016;7:60503–60518. [DOI] [PMC free article] [PubMed] [Google Scholar]
- 2. Kruger RP. Prostate cancer 101. Cell. 2008;135:979–979. [Google Scholar]
- 3. Dai C, Heemers H, Sharifi N. Androgen signaling in prostate cancer. Cold Spring Harb Perspect Med. 2017;7:a030452. [DOI] [PMC free article] [PubMed] [Google Scholar]
- 4. Ecke TH, Schlechte HH, Schiemenz K, et al. TP53 gene mutations in prostate cancer progression. Anticancer Res. 2010;30:1579–1586. [PubMed] [Google Scholar]
- 5. Yardy GW, Brewster SF. Wnt signalling and prostate cancer. Prostate Cancer Prostatic Dis. 2005;8:119–126. [DOI] [PubMed] [Google Scholar]
- 6. Robinson DR, Zylstra CR, Williams BO. Wnt signaling and prostate cancer. Curr Drug Targets. 2008;9:571–580. [DOI] [PubMed] [Google Scholar]
- 7. Dominguez‐Brauer C, Thu KL, Mason JM, Blaser H, Bray MR, Mak TW. Targeting mitosis in cancer: emerging strategies. Mol Cell. 2015;60:524–536. [DOI] [PubMed] [Google Scholar]
- 8. Bielinsky AK. Mcm10: the glue at replication forks. Cell Cycle. 2016;15:3024–3025. [DOI] [PMC free article] [PubMed] [Google Scholar]
- 9. Baxley RM, Bielinsky AK. Mcm10: a dynamic scaffold at eukaryotic replication forks. Genes (Basel). 2017;8:E73. [DOI] [PMC free article] [PubMed] [Google Scholar]
- 10. Miotto B, Chibi M, Xie P, et al. The RBBP6/ZBTB38/MCM10 axis regulates DNA replication and common fragile site stability. Cell Rep. 2014;7:575–587. [DOI] [PubMed] [Google Scholar]
- 11. Kaur M, Khan MM, Kar A, Sharma A, Saxena S. CRL4‐DDB1‐VPRBP ubiquitin ligase mediates the stress triggered proteolysis of Mcm10. Nucleic Acids Res. 2012;40:7332–7346. [DOI] [PMC free article] [PubMed] [Google Scholar]
- 12. Im JS, Park SY, Cho WH, Bae SH, Hurwitz J, Lee JK. RecQL4 is required for the association of Mcm10 and Ctf4 with replication origins in human cells. Cell Cycle. 2015;14:1001–1009. [DOI] [PMC free article] [PubMed] [Google Scholar]
- 13. Senfter D, Erkan EP, Ozer E, et al. Overexpression of minichromosome maintenance protein 10 in medulloblastoma and its clinical implications. Pediatr Blood Cancer. 2017;64 10.1002/pbc.26670. [DOI] [PubMed] [Google Scholar]
- 14. Li WM, Huang CN, Ke HL, et al. MCM10 overexpression implicates adverse prognosis in urothelial carcinoma. Oncotarget. 2016;7:77777–77792. [DOI] [PMC free article] [PubMed] [Google Scholar]
- 15. Cheng J, Lu X, Wang J, Zhang H, Duan P, Li C. Interactome analysis of gene expression profiles of cervical cancer reveals dysregulated mitotic gene clusters. Am J Transl Res. 2017;9:3048–3059. [PMC free article] [PubMed] [Google Scholar]
- 16. Lu P, Qiao J, He W, et al. Genome‐wide gene expression profile analyses identify CTTN as a potential prognostic marker in esophageal cancer. PLoS ONE. 2014;9:e88918. [DOI] [PMC free article] [PubMed] [Google Scholar]
- 17. Schlomm T. The molecular taxonomy of primary prostate cancer cancer genome atlas research network. Eur Urol. 2016;69:1157–1157. [DOI] [PubMed] [Google Scholar]
- 18. Abeshouse A, Ahn J, Akbani R, et al. The molecular taxonomy of primary prostate cancer. Cell. 2015;163:1011–1025. [DOI] [PMC free article] [PubMed] [Google Scholar]
- 19. Taylor BS, Schultz N, Hieronymus H, et al. Integrative genomic profiling of human prostate cancer. Cancer Cell. 2010;18:11–22. [DOI] [PMC free article] [PubMed] [Google Scholar]
- 20. Buyyounouski MK, Choyke PL, McKenney JK, et al. Prostate cancer − major changes in the American Joint Committee on Cancer eighth edition cancer staging manual. CA Cancer J Clin. 2017;67:245–253. [DOI] [PMC free article] [PubMed] [Google Scholar]
- 21. Nabzdyk CS, Chun M, Pradhan Nabzdyk L, Yoshida S, LoGerfo FW. Differential susceptibility of human primary aortic and coronary artery vascular cells to RNA interference. Biochem Biophys Res Commun. 2012;425:261–265. [DOI] [PMC free article] [PubMed] [Google Scholar]
- 22. D'Amico AV, Whittington R, Malkowicz SB, et al. Combination of the preoperative PSA level, biopsy gleason score, percentage of positive biopsies, and MRI T‐stage to predict early PSA failure in men with clinically localized prostate cancer. Urology. 2000;55:572–577. [DOI] [PubMed] [Google Scholar]
- 23. Tsaur I, Hennenlotter J, Oppermann E, et al. PCA3 and PSA gene activity correlates with the true tumor cell burden in prostate cancer lymph node metastases. Cancer Biomark. 2015;15:311–316. [DOI] [PubMed] [Google Scholar]
- 24. Prensner JR, Rubin MA, Wei JT, Chinnaiyan AM. Beyond PSA: the next generation of prostate cancer biomarkers. Sci Transl Med. 2012;4:127rv3. [DOI] [PMC free article] [PubMed] [Google Scholar]
- 25. Mohaghegh P, Hickson ID. DNA helicase deficiencies associated with cancer predisposition and premature ageing disorders. Hum Mol Genet. 2001;10:741–746. [DOI] [PubMed] [Google Scholar]
- 26. Mo D, Zhao Y, Balajee AS. Human RecQL4 helicase plays multifaceted roles in the genomic stability of normal and cancer cells. Cancer Lett. 2018;413:1–10. [DOI] [PubMed] [Google Scholar]
- 27. Mo D, Fang H, Niu K, et al. Human helicase RECQL4 drives cisplatin resistance in gastric cancer by activating an AKT‐YB1‐MDR1 signaling pathway. Cancer Res. 2016;76:3057–3066. [DOI] [PubMed] [Google Scholar]
- 28. Su Y, Meador JA, Calaf GM, et al. Human RecQL4 helicase plays critical roles in prostate carcinogenesis. Cancer Res. 2010;70:9207–9217. [DOI] [PMC free article] [PubMed] [Google Scholar]
- 29. Yoshida K, Inoue I. Expression of MCM10 and TopBP1 is regulated by cell proliferation and UV irradiation via the E2F transcription factor. Oncogene. 2004;23:6250–6260. [DOI] [PubMed] [Google Scholar]
- 30. Wang AB, Zhang YV, Tumbar T. Gata6 promotes hair follicle progenitor cell renewal by genome maintenance during proliferation. EMBO J. 2017;36:61–78. [DOI] [PMC free article] [PubMed] [Google Scholar]
- 31. Lan W, Chen S, Tong L. MicroRNA‐215 regulates fibroblast function: insights from a human fibrotic disease. Cell Cycle. 2015;14:1973–1984. [DOI] [PMC free article] [PubMed] [Google Scholar]
- 32. Mayer S, Erbes T, Timme‐Bronsert S, et al. Clinical relevance of Cyr61 expression in patients with hormone‐dependent breast cancer. Oncol Lett. 2017;14:2334–2340. [DOI] [PMC free article] [PubMed] [Google Scholar]
- 33. Huang YT, Lan Q, Lorusso G, Duffey N, Ruegg C. The matricellular protein CYR61 promotes breast cancer lung metastasis by facilitating tumor cell extravasation and suppressing anoikis. Oncotarget. 2017;8:9200–9215. [DOI] [PMC free article] [PubMed] [Google Scholar]
- 34. Kuramochi H, Nakamura A, Nakajima G, et al. PTEN mRNA expression is less pronounced in left‐ than right‐sided colon cancer: a retrospective observational study. BMC Cancer. 2016;16:366. [DOI] [PMC free article] [PubMed] [Google Scholar]
Associated Data
This section collects any data citations, data availability statements, or supplementary materials included in this article.
Supplementary Materials
Additional supporting information may be found online in the Supporting Information section at the end of the article.
Figure S1. TCGA analysis showed expression patterns of MCM family members in PCa. (A‐I).
Figure S2. Taylor dataset analysis showed MCM2, MCM3, MCM7 and RECQL4 were not associated with PCa prognosis.
Figure S3. MCM10 expression was not significantly correlated with the DNA methylation status and CNV status in PCa.
Figure S4. DepMap dataset analysis showed MCM10 knockout inhibited prostate cancer cell proliferation.


