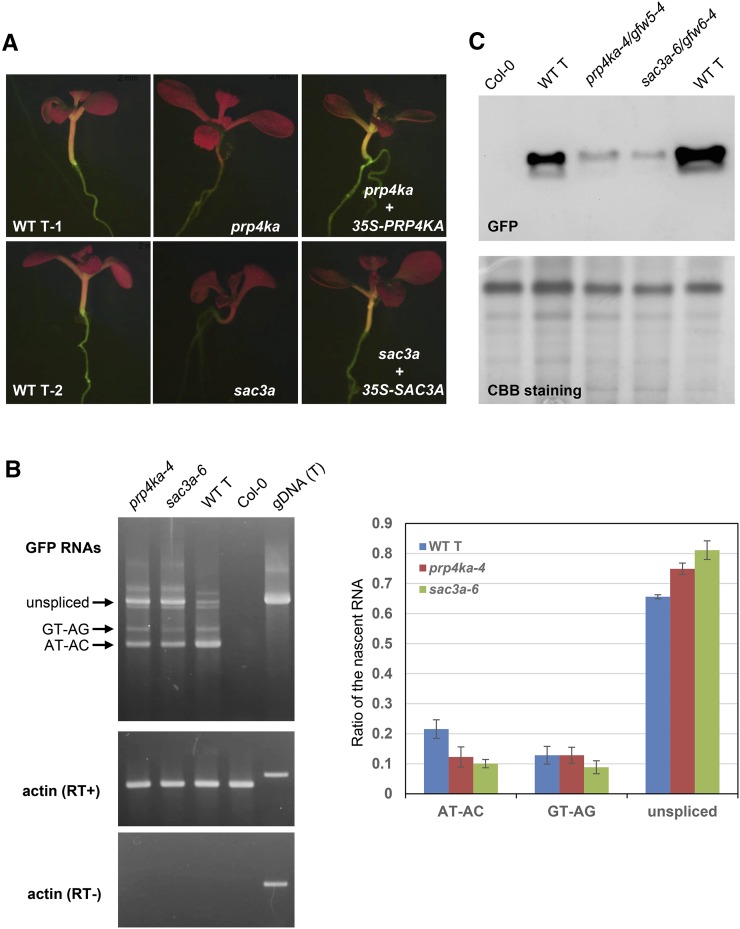
Figure 2.
Molecular basis of GFP-weak phenotypes of prp4ka and sac3a mutants. (A) GFP-weak fluorescence in seedlings of prp4a and sac3a mutants (prp4ka-2/gfw5-2 and sac3a-3/gfw6-1). (B) Left: Semiquantitative RT-PCR to detect the three GFP splice variants (unspliced, GT–AG transcripts, and AT–AC transcripts) in prp4ka and sac3a mutants. Wild-type T line and nontransgenic Col-0 represent positive and negative controls, respectively; actin is the constitutively expressed control. Right: Percentages of the three major GFP RNA splice variants derived from an analysis of RNA-seq data (Table S5). The average of three biological replicates is shown for each sample. A two-sample t-test using the percentages of GFP RNA isoforms found a statistically significant difference between the amount of AT–AC and unspliced transcripts between the wild-type T line and the two mutants (P < 0.05). The total amount of GFP transcripts did not change significantly in prp4ka and sac3a mutants. (C) Western blotting to detect GFP protein in prp4ka and sac3a mutants. Total protein isolated from the indicated plant lines was separated by SDS-PAGE, blotted onto a membrane, and probed with a monoclonal antibody to GFP protein (top). The Coomassie brilliant blue-stained gel is shown as a loading control. The prominent ∼56-kDa band is presumed to be the large subunit of ribulose bisphosphate carboxylase. CBB, Coomassie brilliant blue; gDNA (T), genomic DNA of T line; RT−, without reverse transcriptase; RT+, with reverse transcriptase; T, wild-type T line (GFP-intermediate control); WT, wild type.

