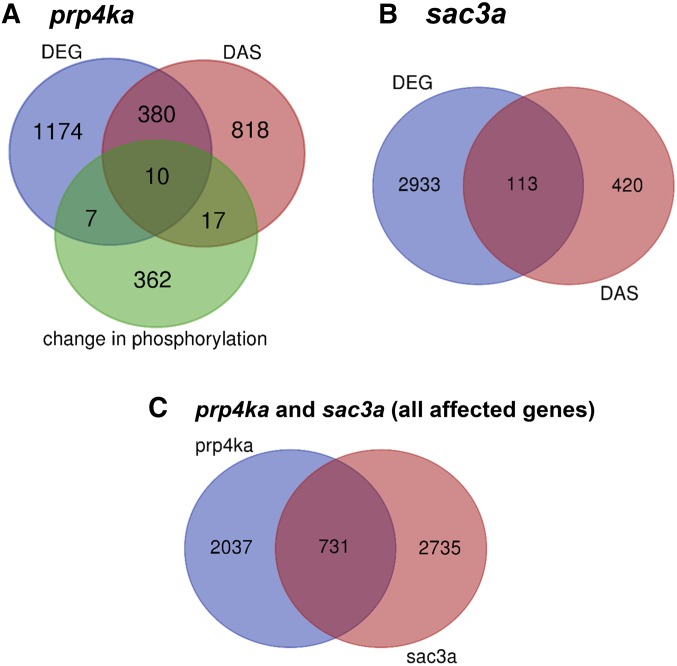
Figure 5.
Venn diagrams showing distribution of genes affected in the prp4ka and sac3a mutants. (A) Venn diagram for genes affected in the prp4ka mutant (DEGs, DAS genes, genes encoding proteins with changes in phosphorylation). (B) Venn diagram for genes affected in the sac3a mutant (DEGs and DAS genes). (C) Venn diagram for all genes affected in the prp4ka (DEGs, DAS genes, changes in phosphorylation) and sac3a (DEGs and DAS genes) mutants.

