Abstract
Purpose
To assess transvaginal coregistered photoacoustic tomography (PAT) and pulse-echo US for diagnosis of ovarian cancer based on functional parameters provided by PAT.
Materials and Methods
Between February 2017 and December 2017, 26 ovarian masses from 16 participants were successfully imaged in vivo by multispectral photoacoustic imaging, including nine invasive epithelial ovarian cancers (six serous carcinomas and three endometroid adenocarcinomas), three other tumors (two borderline serous tumors and one sex cord–stromal tumor), and 14 benign and normal (hereafter referred to as benign/normal) ovaries. The relative total hemoglobin concentration (rHbT) and mean oxygen saturation (sO2) shown at PAT were used to characterize the ovaries identified at US.
Results
The average rHbT was 1.9 times higher for invasive epithelial cancers than for the benign/normal ovaries (P = .01). Additionally, the rHbT distribution was extensive in invasive epithelial cancers, but was scattered in benign/normal ovaries. However, the rHbT of two borderline serous tumors and one stromal tumor was in the same range as that of benign/normal ovaries. The mean sO2 of invasive epithelial cancers, and of the borderline and stromal tumors, was 8.2% lower than that of benign/normal ovaries (P = .003).
Discussion
Invasive epithelial ovarian cancers showed higher and extensive tumor vascularity and lower oxygen saturation than benign and normal ovaries. Two borderline noninvasive serous and one stromal tumor showed low oxygen saturation compared with benign and normal ovaries.
©RSNA, 2018
See also the editorial by Levine in this issue.
Introduction
Ovarian cancer remains the deadliest of all the gynecologic malignancies. Epithelial ovarian carcinomas are the majority of all ovarian malignancies, whereas less prevalent ovarian tumors (not all of which are malignant) include epithelial borderline tumors, germ cell tumors, and sex cord–stromal tumors (1). Most ovarian cancers are diagnosed at stages III and IV, where the survival rate is only 25%–30% (2). To our knowledge, there are no reliable tests for early detection of ovarian cancer, and the combination of CA-125 serum screening, transvaginal US, and pelvic examination yields low positive predictive values (3). Imaging modalities such as CT, PET, and MRI have been used for surgical guidance. MRI for oxygen saturation (sO2), hemoglobin tissue levels, and blood flow measurement in ovarian tumor assessment has not been well studied and is potentially valuable for future research.
Photoacoustic tomography (PAT) can provide spatial resolution and functional information at depths ranging from several millimeters up to several centimeters (4–6). PAT is a hybrid imaging technology that uses a short-pulsed laser to excite tissue. The resulting acoustic or photoacoustic waves are generated from thermoelastic expansion because of transient rising temperature. The photoacoustic waves are then measured by US transducers. The acquired photoacoustic waves are used to image, at US resolution, the optical absorption distribution, which shows optical contrast. Optical contrast enhancement is directly related to microvessel networks and thus to tumor angiogenesis, a key process for tumor growth and metastasis (7,8). If two or more optical wavelengths are used, photoacoustic waves can be used to reconstruct the distribution of oxygenated and deoxygenated hemoglobin, which are the main chromophores related to tumor angiogenesis and hypoxia. sO2 can then be measured, which is an important indicator of tumor metabolism and therapeutic response. Oncologic applications of PAT to date include breast cancer (9–13), prostate cancer (14,15), skin cancer (16,17), thyroid cancer (18), and ovarian cancer (19–22).
The purpose of this pilot study was to evaluate the use of multispectral functional in vivo imaging of participants with ovarian tumors by using coregistered photoacoustic tomography (PAT) and pulse-echo US. A fully programmable US system, combined with a customized light delivery system, was used to image participants scheduled for salpingo-oophorectomy.
Materials and Methods
Our study protocol was approved by the institutional review board and was compliant with the Health Insurance Portability and Accountability Act. Written informed consent was obtained from all participants.
Coregistered PAT and Pulse-echo US System
Figure 1 shows the coregistered PAT and pulse-echo US system used in our clinical study. The full description of the system is provided in Appendix E1 (online). The system consisted of a fully programmable clinical US system (EC-12R; Alpinion Medical Systems, Seoul, South Korea), a customized optical fiber–based light delivery system coupled with a transvaginal US probe, and a neodymium-doped yttrium aluminium garnet (known as Nd:YAG) laser pumping a pulsed, tunable (690–900 nm) Ti-sapphire laser (Symphotics, Camarillo, Calif) (21,22). A time-division multiplexing approach was used during the coregistered mode wherein each PAT imaging frame was synchronized with one laser pulse and each US frame was recorded between two consecutive laser pulses. Four wavelengths (730 nm, 780 nm, 800 nm, and 830 nm) were used for imaging.
Figure 1:
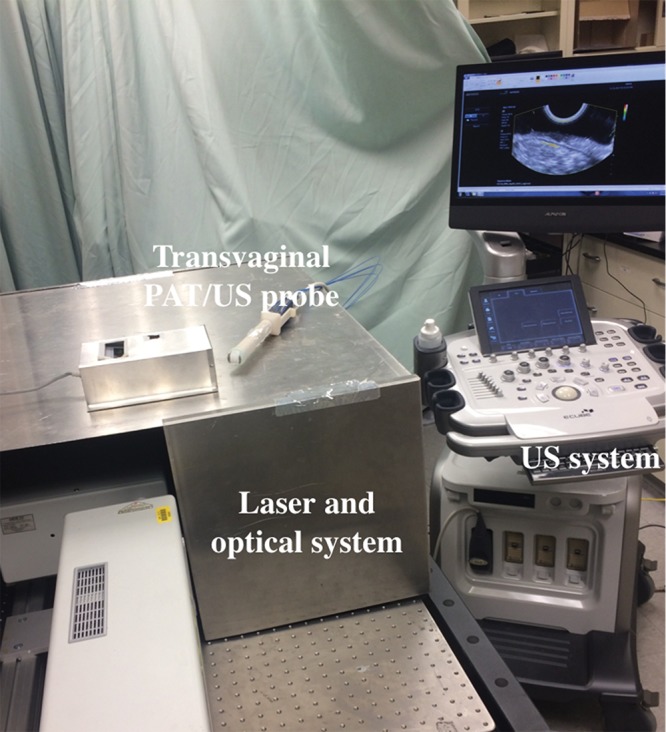
Photograph of the photoacoustic tomography (PAT) and pulse-echo US system used for patient study. The laser and optical system was sealed inside a metal cover, with only four fibers coupled to the probe.
Study Participants
From February 2017 to December 2017, 20 participants were enrolled in our study at the Siteman Cancer Center (Washington University, St Louis, Mo). These participants were clinically at risk for ovarian cancer or had an ovarian or pelvic mass suggestive of malignancy. Before imaging with the PAT and pulse-echo US system, participants underwent transvaginal US performed by a radiologist (C.S., with 24 years of experience, or K.R., with 9 years of experience) assisted by a US technologist who used a commercial transvaginal US system (Logiq S8; GE Healthcare, Waukesha, Wis). After the ovarian or pelvic mass suspicious for cancer was examined, the commercial probe was withdrawn and the customized PAT and pulse-echo US probe was inserted transvaginally to image the masses suspicious for cancer. Because the radiologists were familiar with the Logiq S8 transvaginal imaging system (GE Healthcare), this two-step procedure was intended to ensure a smooth transition from the Logiq S8 system to the EC-12R system (Alpinion Medical Systems). The Logiq S8 system has better spatial resolution and depth than the EC-12R system in US mode.
To enable radiographic-pathologic correlation, a suture was placed in participants with an ovarian mass for orientation at the aspect of the ovary most proximal to the vaginal apex at the time of surgical excision. The sutured area was embedded entirely (five adjacent blocks oriented perpendicular to the sutured surface). Hematoxylin-and-eosin sections and CD31 immunostaining were prepared according to standard clinical protocols at Barnes-Jewish Hospital (St Louis, Mo).
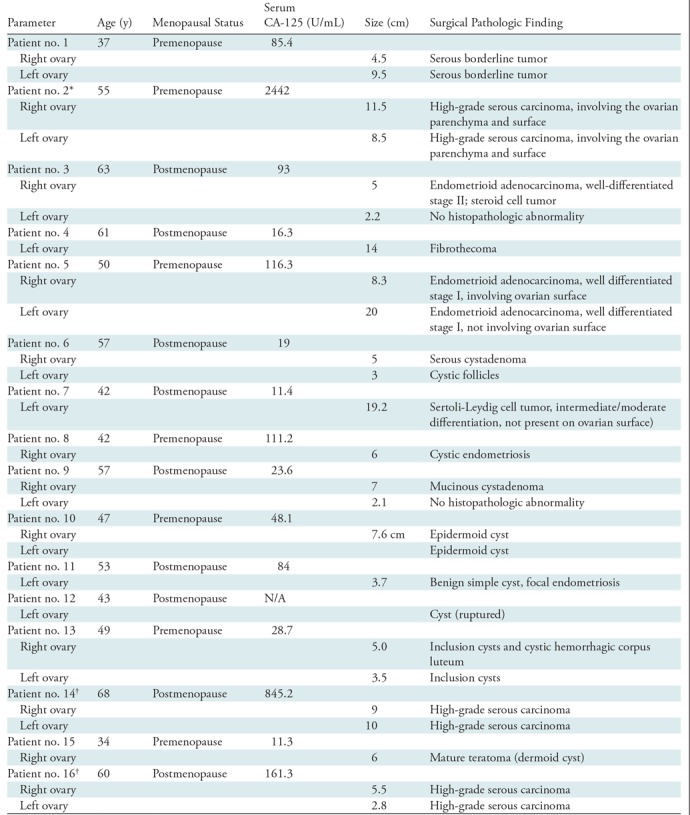
For our study, CA-125 information was available in 15 participants and was used as an additional parameter for comparison with the photoacoustic functional parameters. The menopausal status of the patient was extracted from patient records (Table).
Table:
Patient Characteristics and Surgical Pathologic Analysis of Ovaries
*Stage IV
†Stage III
PAT and US Independent Area Selection
A conventional delay-and-sum US beamforming algorithm was applied to reconstruct PAT and US images. For each patient, three frames were collected for all four wavelengths for an area of interest in about 12–15 seconds and, depending on the size and location of the ovary, several areas were recorded for each patient. To select independent areas and avoid correlated images, a two-dimensional cross-correlation of the two consecutive US images was calculated sequentially. Before application of cross-correlation operator, each image was normalized to its own maximum gray-scale level to avoid intensity mismatch. The cross-correlation coefficients of similar areas were higher than 0.8 in general, and a sudden drop to less than 0.5 followed by higher cross-correlation coefficients from the next group of sequential US images indicated a new area. For each ovary, the average of the relative total hemoglobin (rHbT) and the average sO2 of all independent areas were computed to represent functional parameters of the examined ovary. For participants in whom two ovaries were imaged and pathologic examinations were similar, the average rHbT and sO2 of the two ovaries were computed for each patient and used for statistical analysis.
Statistical Analysis
The rHbT, which is proportional to the summation of the relative oxygenated hemoglobin, C(r)HbO(r), and deoxygenated hemoglobin, C(r)Hb(r), can be written as rHbT(r) = C(r)[HbO(r) + Hb(r)], where C (r) = C0 (r) F (r) Г. C0 (r) is the normalized average power measured at the light delivery fiber tip at each wavelength and can be approximated as wavelength independent in the optical window used (20). F is the fluence (energy/unit area) distribution, and Г is the tissue Grüneisen parameter. To determine the mean rHbT, the maximum value of the rHbT was calculated within the US-identified ovarian tissue region, and the average value of the voxels within the full width at half maximum was then used as the mean rHbT, which is expressed in arbitrary units (au) and hereafter referred to as rHbT. To determine the absolute value of the HbT, the local fluence distribution at any point within the tissue needs be to be measured, which can be challenging for in vivo measurements (23). We found that the rHbT is useful for identifying vascular content of the ovarian tissue. sO2 is calculated as 100 × HbO (r)/[HbO(r) + Hb(r)], where the term C has been cancelled out. The mean sO2 value is calculated by integrating the voxels within the region of interest and dividing by the total number of voxels.
For rHbT and sO2, a two-sample two-sided Student t test was used to calculate the statistical significance between the benign or normal, epithelial cancer, and other tumor groups. For CA-125, the measurement was skewed, and a two-sample two-sided nonparametric Mann-Whitney test was used to calculate the statistical significance. A P value of .05 was considered to indicate statistical significance, and statistical software (Minitab 18; State College, Pa) was used for statistical calculations. One patient had one malignant and one normal ovary, and her rHbT and sO2 were not averaged and were shown in each corresponding category.
Results
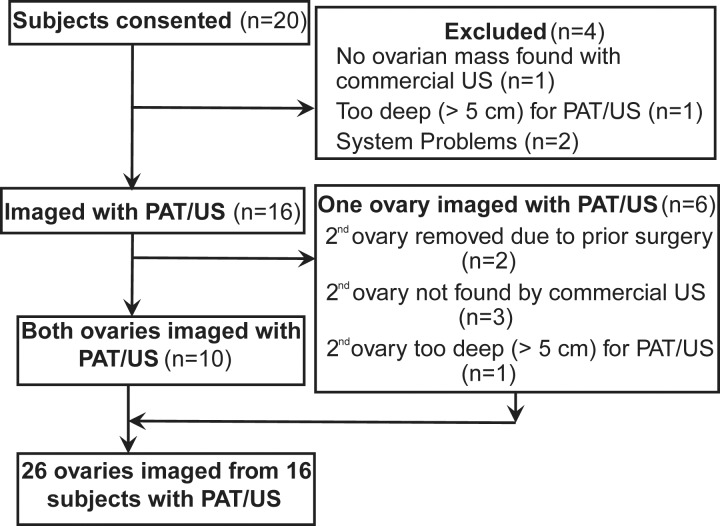
Of the 20 participants who consented, 16 participants with 26 ovaries were imaged with the coregistered PAT and pulse-echo US system (Fig 2). Diagnoses ascertained at subsequent surgical pathologic examination revealed high-grade serous carcinoma (n = 6 ovaries), endometrioid adenocarcinoma (n = 3), noninvasive serous borderline tumor (n = 2), Sertoli-Leydig cell tumor (a sex cord–stromal tumor; n = 1), normal ovaries (n = 5), and other causes of benign but enlarged ovaries (n = 9) (Table). The participants were grouped into invasive epithelial ovarian cancers (n = 5), other neoplasms (n = 2), and benign or normal ovaries (n = 10). The category of other neoplasms included the borderline tumors and Sertoli-Leydig cell tumor, with the rationale that both of these diagnoses have some potential for subsequent malignant behavior. Benign causes of enlargement included cystadenomas, endometriosis, fibrothecoma, and other processes with benign anticipated behavior.
Figure 2:
Flowchart of study participant inclusion and exclusion. PAT = photoacoustic tomography.
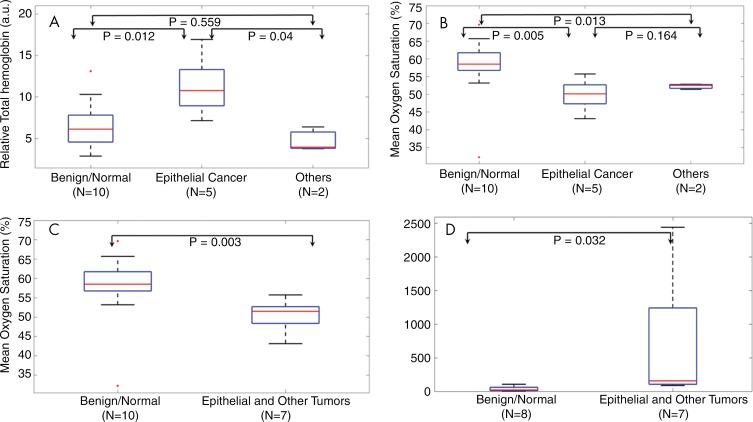
The average rHbT was 1.9 times higher for invasive epithelial cancers than for the benign or normal (hereafter referred to as benign/normal) ovaries (P = .01) with difference of 5.4 au (95% confidence interval: 1.6 au, 9.2 au) (Fig 3, A). Interestingly, the average rHbT of the two borderline serous tumors and one stromal tumor (the group referred to as other) was in the same range as the benign/normal ovaries, and it was not statistically significant from the value for the benign/normal group (P = .56). Figure 3, B, shows that the average sO2 value was 9.1% (95% confidence interval: 3.4%, 14.8%) lower for the invasive cancer group than for the benign/normal group (P = .005). The average sO2 of other types of tumors was in the same range as that of the invasive cancer group, and it was found to be different from the benign/normal group (P = .01). When invasive epithelial cancers and other tumors were grouped together, the average sO2 of the combined patient group was 8.2% lower (95% confidence interval: 3.2%, 13.2%) compared with the benign/normal group (Fig 3, C; P = .003). CA-125 was found not to be significant between the invasive epithelial cancer and other tumor group and the benign/normal group (P = .19) by using the Student t test. However, it was significant between the two groups with the Mann-Whitney test (Fig 3, D; P = .03) because of skewed measurements.
Figure 3:
Box-and-whisker plots comparing tumor groups. A, Relative total hemoglobin values for benign/normal, invasive epithelial ovarian cancer, and other neoplasms. B, Box plot of mean oxygen saturation values of the three groups in A. C, Box plot of mean oxygen saturation values of the benign/normal group versus combined invasive epithelial ovarian cancer and other neoplasms. D, CA-125 comparison for benign/normal group versus combined invasive epithelial ovarian cancer and other neoplasms; CA-125 in units per milliliter is shown on the y-axis. Student t test was used for computing P values in A–C and Mann-Whitney test was used for computing P values in D. In each boxplot, the red line shows the median value, the 25th and 75th percentiles are indicated respectively by the top and bottom of the box, the whiskers extend to the extreme data points that are not considered as outliers, and, A–C, the outlier points are marked individually by red dots.
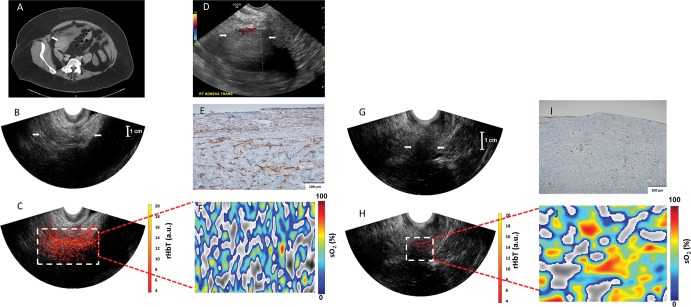
Examples of invasive cancers and benign ovarian masses are provided in Figures 4–7.
Figure 4:
Images in a 63-year-old woman after menopause who had a solid right adnexal mass measuring up to 4.5 cm, ascites, and a thickened endometrium at contrast-enhanced CT (patient 3). A, Contrast-enhanced CT image. Pathologic findings included a 5-cm ovary (arrow) with well-differentiated stage II endometrioid adenocarcinoma and an incidental 2.2-cm benign steroid cell tumor. B, US image (EC-12R; Alpinion Medical Systems) of the right adnexa (arrows). C, The coregistered US and photoacoustic tomography relative total hemoglobin (rHbT) map shown in color, with extensive diffused vascular distribution covering a large area of the region of interest in the depth range of 1–4 cm. D, US Doppler image (Logiq 8S; GE Healthcare) of the right adnexa shows a hypoechoic soft tissue mass with minimal peripheral flow on color Doppler images (arrows). The rHbT measured in the region of interest was 14.58 arbitrary units (a.u.). E, CD31 immunostaining in the suture area, showing numerous and extensive microvessels; F, Oxygen saturation (sO2) map of the region of interest marked by the white rectangular box in C with mean sO2 of 43.2%. G, US image in the left ovary (arrows). H, Coregistered US and photoacoustic tomography rHbT map shows scattered photoacoustic tomography signals. The rHbT is lower and measured 7.73 arbitrary units (a.u.) on J. I, CD31 immunostaining of surgical sample. J, sO2 map of the region of interest identified by coregistered US with measured mean sO2 of 58.2%. Pathologic examination found a normal ovary with no significant histopathologic abnormalities.
Figure 7:
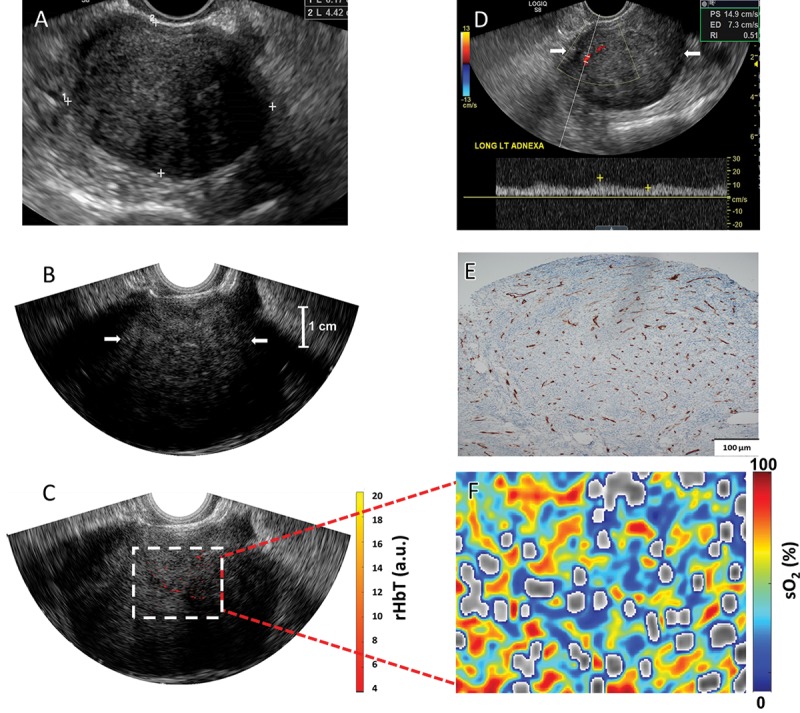
Images in a 61-year-old woman after menopause with a left ovarian mass (patient 4). A, Pelvic US shows a solid, homogeneous, hypoechoic left ovarian mass with areas of posterior acoustic shadowing. B, Transvaginal US image and, C, coregistered photoacoustic tomography and pulse-echo US image shows scattered vascular components of relative total hemoglobin (rHbT) of left ovary (arrows in B) of 3.51 arbitrary units (a.u.). D, Color Doppler and spectral analysis show minimal internal blood flow (arrows). E, CD31 immunostaining in the sutured area shows dense stroma with scattered vascular components. F, Oxygen saturation (sO2) map of higher mean sO2 of 53.2%. Histopathologic examination showed a benign fibrothecoma.
Figure 5:
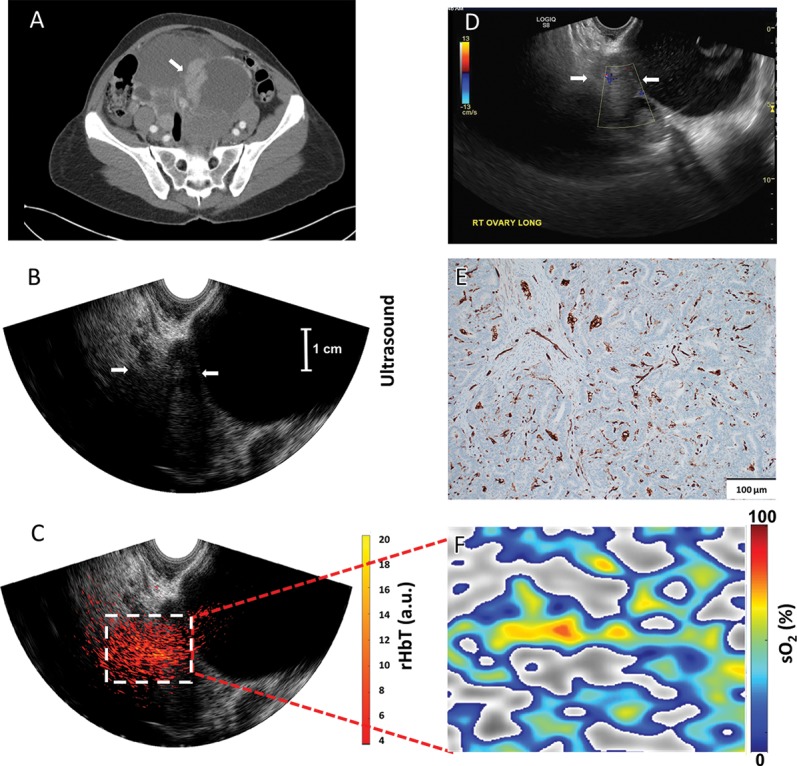
Images in a 50-year-old woman before menopause (patient 5) who had bilateral multicystic adnexal masses with septations and mural nodularity A, Contrast-enhanced CT shows a 3.6-cm right adnexal mural nodule as a solid mass (arrow). B, US image of the right adnexa (arrows); C, coregistered US and photoacoustic tomography relative total hemoglobin (rHbT) map shown in color, with extensive diffused vascular distribution inside the region of interest in the depth range of 1.5–4.5 cm, next to large cystic areas identified at US. D, US Doppler shows minimal blood flow in the solid area (arrows). E, CD31 immunostaining of the sutured area. F, Oxygen saturation (sO2) map of the region of interest marked by the white rectangular box in C; pathologic examination showed well-differentiated stage I endometrioid adenocarcinomas of both the right and left ovaries that measured 8.3 cm and 20 cm, respectively. The rHbT measured in the region of interest was 12.18 arbitrary units and the mean sO2 was 50.1%.
Figure 6:
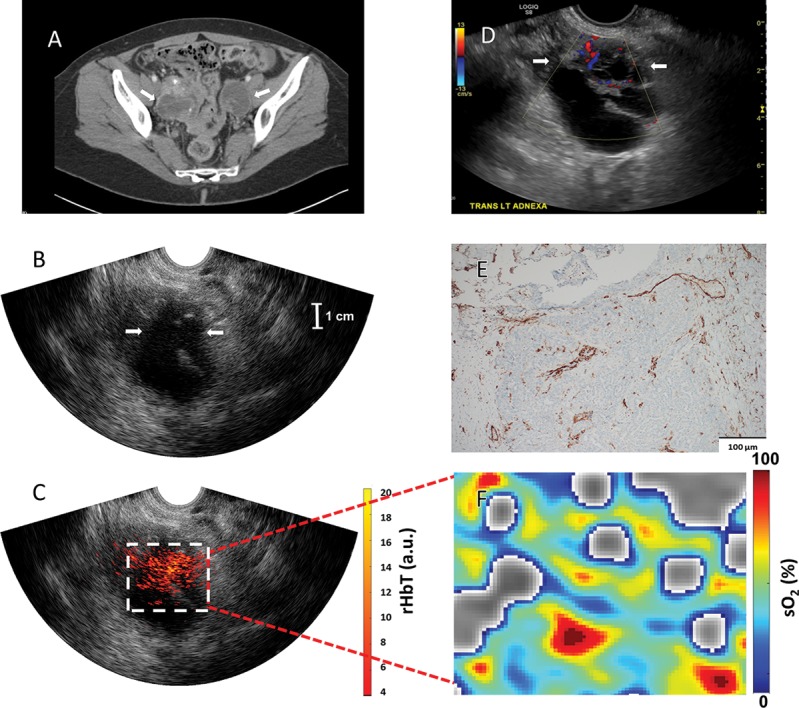
Images in a 60-year-old woman after menopause who had bilateral ovarian masses with multiple thick septations, mural nodularity, and calcifications (patient 16). A, Contrast-enhanced CT (arrows show bilateral ovarian masses). B, US image of the left ovary (arrows). C, Coregistered US and photoacoustic tomography relative total hemoglobin (rHbT) map shows extensive localized vascular distribution inside the US-identified region of interest with a mean rHbT of 10.77 arbitrary units (a.u.). D, US with Doppler shows left ovarian mass with multiple thick septations with blood flaw and mural nodularity (arrows). E, CD31 immunostaining showing dense microvessels. F, Oxygen saturation (sO2) map of the region of interest identified at coregistered US (C) with a mean sO2 of 52.3%. Pathologic examination showed stage III bilateral high-grade serous carcinoma.
Discussion
Our pilot patient study used coregistered photoacoustic and US transvaginal imaging for diagnosis of ovarian masses visible at US. The initial data demonstrated that invasive epithelial ovarian cancers showed more extensive and higher microvessel distribution than did benign/normal ovaries. Both invasive cancer and the borderline or stromal tumor group showed significantly lower mean sO2 than the benign/normal group. Our results suggest that PAT and pulse-echo US has the potential to improve transvaginal US in helping to distinguish benign ovarian tumors from malignant tumors. Although the difference in the average rHbT of the invasive epithelial cancers was different than the benign/normal group, the rHbT did not distinguish the borderline serous carcinoma or the rare sex cord–stromal tumor from benign or normal results.
Transvaginal color Doppler US has been frequently used to assist gray-scale US with the identification of vascularity in malignant ovarian masses (24). However, it is able to image networks of macrovessels only between 100 and 200 microns in diameter (25). The photoacoustic technique images the light absorption of smaller microvessel networks, and our study shows that it is sensitive in mapping malignant masses with more extensive and higher vasculature than that of benign/normal ovarian masses.
There were limitations regarding the PAT and pulse-echo US technique. First, photoacoustic imaging can reach only about 5-cm deep, partially because of the reduced depth sensitivity of the EC3-10 (Alpinion Medical Systems) probe for both US and PAT, and partially because of reduced photoacoustic signals from deeper ranges. Thus, PAT is limited for ovaries deeper than 5 cm, or when the target pathologic process is more than 5 cm from the vaginal fornix within a large adnexal mass. Second, for one cystic ovary, there was little or no PAT signal from the cyst area, and both the rHbT and the sO2 were low, which was attributed to absent or scant blood inside the cyst. However, for most cystic ovaries, US showed some solid areas inside the cysts, and PAT signal was obtained from those areas, which were mostly in the benign range. Third, the wavelength tuning from 730 nm to 830 nm is about 12–15 seconds which is not in real time. Because the probe is tightly fitted inside patient’s vagina, in general the hand-held probe-caused motion is not a problem. The data acquisition speed can be improved by developing an electronically controlled wavelength filter.
In summary, invasive epithelial ovarian cancers showed higher tumor vascularity and lower sO2 compared with benign/normal ovaries. Borderline serous and stromal tumors showed lower sO2 compared with benign/normal ovaries. The coregistered PAT and pulse-echo US was able to distinguish these features and has great potential to improve diagnostic US.
Summary
The coregistered photoacoustic tomography and US technique showed higher relative total hemoglobin concentration in invasive epithelial ovarian cancers and lower oxygen saturation in both invasive epithelial ovarian cancers and borderline serous/stromal tumors compared with benign and normal ovaries.
Implications for Patient Care
■ Coregistered photoacoustic tomography and US was used to determine relative total hemoglobin concentration and oxygen saturation in ovarian masses.
■ Coregistered photoacoustic tomography and US showed invasive epithelial ovarian cancers had higher relative total hemoglobin concentration and both invasive epithelial ovarian cancers and borderline serous and stromal tumors had lower oxygen saturation compared with benign and normal ovaries.
APPENDIX
Acknowledgments
Acknowledgments
We thank study coordinators Ruth Holdener and Lynne Lippmann for coordinating study schedules, and identifying and consenting participants to the study. We thank Stacey Reime, radiology technical supervisor for US, for her help on US imaging of participants. We also thank the entire GYN oncology group for helping identify participants, and the Radiology US group for helping with US scans. Special thanks to all the study participants.
Study supported by National Institutes of Health (R01CA151570, R01EB002136, R25 CA190190) and by the Center for Strategic Scientific Initiatives, National Cancer Institute (R01CA151570, R01EB002136, R25 CA190190).
S.N. and A.M. contributed equally to this work.
Disclosures of Conflicts of Interest: S.N. disclosed no relevant relationships. A.M. disclosed no relevant relationships. I.S.H. disclosed no relevant relationships. M.A.P. Activities related to the present article: disclosed no relevant relationships. Activities not related to the present article: disclosed money paid to author for consultancies from Merck, AstraZeneca, Roche/Genentech, Tesaro, and Clovis; disclosed money paid to author for lectures including service on speakers’ bureaus from Merck, AstraZeneca, Roche/Genentech, Tesaro, and Clovis. Other relationships: disclosed no relevant relationships. E.A. disclosed no relevant relationships. K.R. disclosed no relevant relationships. D.G.M. disclosed no relevant relationships. C.S. disclosed no relevant relationships. Q.Z. Activities related to the present article: disclosed no relevant relationships. Activities not related to the present article: disclosed patent filed by University of Connecticut under application/control number 14/413823. Other relationships: disclosed no relevant relationships.
Abbreviations:
- PAT
- photoacoustic tomography
- rHbt
- relative total hemoglobin concentration
- sO2
- oxygen saturation
References
- 1.Lee KR, Tavassoli FA, Prat J, et al. Surface Epithelial Stromal Tumours: Tumours of the Ovary and Peritoneum. In: Tavassoli FA, Devilee P, eds. BOOK TITLE. Lyon, France: IARC, 2003; 117–145. [Google Scholar]
- 2.Clarke-Pearson DL. Clinical practice. Screening for ovarian cancer. N Engl J Med 2009;361(2):170–177. [DOI] [PubMed] [Google Scholar]
- 3.Henderson JT, Webber EM, Sawaya GF. Screening for ovarian cancer: updated evidence report and systematic review for the us preventive services task force. JAMA 2018;319(6):595–606. [DOI] [PubMed] [Google Scholar]
- 4.Wang LV, Hu S. Photoacoustic tomography: in vivo imaging from organelles to organs. Science 2012;335(6075):1458–1462. [DOI] [PMC free article] [PubMed] [Google Scholar]
- 5.Valluru KS, Wilson KE, Willmann JK. Photoacoustic imaging in oncology: translational preclinical and early clinical experience. Radiology 2016;280(2):332–349. [DOI] [PMC free article] [PubMed] [Google Scholar]
- 6.Oraevsky AA, Karabutov AA. Optoacoustic tomography. In: Vo-Dinh T, ed. Biomedical photonics handbook. Boca Raton, Fla: CRC, 2003. [Google Scholar]
- 7.Weidner N, Semple JP, Welch WR, Folkman J. Tumor angiogenesis and metastasis–correlation in invasive breast carcinoma. N Engl J Med 1991;324(1):1–8. [DOI] [PubMed] [Google Scholar]
- 8.Vaupel P, Kallinowski F, Okunieff P. Blood flow, oxygen and nutrient supply, and metabolic microenvironment of human tumors: a review. Cancer Res 1989;49(23):6449–6465. [PubMed] [Google Scholar]
- 9.Kruger RA, Kuzmiak CM, Lam RB, Reinecke DR, Del Rio SP, Steed D. Dedicated 3D photoacoustic breast imaging. Med Phys 2013;40(11):113301. [DOI] [PMC free article] [PubMed] [Google Scholar]
- 10.Heijblom M, Piras D, van den Engh FM, et al. The state of the art in breast imaging using the Twente Photoacoustic Mammoscope: results from 31 measurements on malignancies. Eur Radiol 2016;26(11):3874–3887. [DOI] [PMC free article] [PubMed] [Google Scholar]
- 11.Wong TTW, Zhang R, Hai P, et al. Fast label-free multilayered histology-like imaging of human breast cancer by photoacoustic microscopy. Sci Adv 2017;3(5):e1602168. [DOI] [PMC free article] [PubMed] [Google Scholar]
- 12.Garcia-Uribe A, Erpelding TN, Krumholz A, et al. Dual-modality photoacoustic and ultrasound imaging system for noninvasive sentinel lymph node detection in patients with breast cancer. Sci Rep 2015;5(1):15748. [DOI] [PMC free article] [PubMed] [Google Scholar]
- 13.Neuschler EI, Butler R, Young CA, et al. A pivotal study of optoacoustic imaging to diagnose benign and malignant breast masses: a new evaluation tool for radiologists. Radiology 2018;287(2):398–412. [DOI] [PubMed] [Google Scholar]
- 14.Dogra VS, Chinni BK, Valluru KS, et al. Multispectral photoacoustic imaging of prostate cancer: preliminary ex-vivo results. J Clin Imaging Sci 2013;3(1):41. [DOI] [PMC free article] [PubMed] [Google Scholar]
- 15.Wang X, Roberts WW, Carson PL, Wood DP, Fowlkes JB. Photoacoustic tomography: a potential new tool for prostate cancer. Biomed Opt Express 2010;1(4):1117–1126. [DOI] [PMC free article] [PubMed] [Google Scholar]
- 16.Zhou Y, Tripathi SV, Rosman I, et al. Noninvasive determination of melanoma depth using a handheld photoacoustic probe. J Invest Dermatol 2017;137(6):1370–1372. [DOI] [PMC free article] [PubMed] [Google Scholar]
- 17.Stoffels I, Morscher S, Helfrich I, et al. Metastatic status of sentinel lymph nodes in melanoma determined noninvasively with multispectral optoacoustic imaging. Sci Transl Med 2015;7(317):317ra199. [DOI] [PubMed] [Google Scholar]
- 18.Dogra VS, Chinni BK, Valluru KS, et al. Preliminary results of ex vivo multispectral photoacoustic imaging in the management of thyroid cancer. AJR Am J Roentgenol 2014;202(6):W552–W558. [DOI] [PubMed] [Google Scholar]
- 19.Aguirre A, Guo P, Gamelin J, et al. Coregistered three-dimensional ultrasound and photoacoustic imaging system for ovarian tissue characterization. J Biomed Opt 2009;14(5):054014. [DOI] [PMC free article] [PubMed] [Google Scholar]
- 20.Alqasemi U, Li H, Aguirre A, Zhu Q. FPGA-based reconfigurable processor for ultrafast interlaced ultrasound and photoacoustic imaging. IEEE Trans Ultrason Ferroelectr Freq Control 2012;59(7):1344–1353. [DOI] [PMC free article] [PubMed] [Google Scholar]
- 21.Salehi HS, Kumavor PD, Li H, et al. Design of optimal light delivery system for co-registered transvaginal ultrasound and photoacoustic imaging of ovarian tissue. Photoacoustics 2015;3(3):114–122. [DOI] [PMC free article] [PubMed] [Google Scholar]
- 22.Salehi HS, Li H, Merkulov A, et al. Coregistered photoacoustic and ultrasound imaging and classification of ovarian cancer: ex vivo and in vivo studies. J Biomed Opt 2016;21(4):46006. [DOI] [PMC free article] [PubMed] [Google Scholar]
- 23.Cox B, Laufer JG, Arridge SR, Beard PC. Quantitative spectroscopic photoacoustic imaging: a review. J Biomed Opt 2012;17(6):061202. [DOI] [PubMed] [Google Scholar]
- 24.Guerriero S, Saba L, Alcazar JL, et al. Past, present and future ultrasonographic techniques for analyzing ovarian masses. Womens Health (Lond) 2015;11(3):369–383. [DOI] [PubMed] [Google Scholar]
- 25.Fleischer AC, Lyshchik A, Andreotti RF, Hwang M, Jones HW, 3rd, Fishman DA. Advances in sonographic detection of ovarian cancer: depiction of tumor neovascularity with microbubbles. AJR Am J Roentgenol 2010;194(2):343–348. [DOI] [PubMed] [Google Scholar]
Associated Data
This section collects any data citations, data availability statements, or supplementary materials included in this article.


