

2H2O-metabolic labeling approach was used to assess hepatic mitochondrial proteome dynamics in a diet-induced mouse model of non-alcoholic fatty liver disease (NAFLD). A Western-diet (WD) stimulated degradation of oxidative phosphorylation subunits in NAFLD mice liver. These changes were associated with decreased mitochondria content, impaired activities of electron transport chain complexes and ATP synthesis. Increased mitophagy contributed to enhanced degradation of mitochondrial proteins.
Keywords: Protein Degradation, Protein Turnover, Mass Spectrometry, Mitochondria function or biology, Oxidative stress, Energy metabolism, heavy water, metabolic labeling, oxidative phosphorylation
Graphical Abstract
Highlights
Stability of oxidative phosphorylation subunits are reduced in a diet-induced mouse model of NAFLD.
These changes are associated with impaired activities of electron transport chain complexes and ATP synthesis.
Increased mitophagy contributed to enhanced degradation of mitochondrial proteins.
Abstract
Nonalcoholic fatty liver disease (NAFLD) is associated with hepatic mitochondrial dysfunction characterized by reduced ATP synthesis. We applied the 2H2O-metabolic labeling approach to test the hypothesis that the reduced stability of oxidative phosphorylation proteins contributes to mitochondrial dysfunction in a diet-induced mouse model of NAFLD. A high fat diet containing cholesterol (a so-called Western diet (WD)) led to hepatic oxidative stress, steatosis, inflammation and mild fibrosis, all markers of NAFLD, in low density cholesterol (LDL) receptor deficient (LDLR−/−) mice. In addition, compared with controls (LDLR−/− mice on normal diet), livers from NAFLD mice had reduced citrate synthase activity and ATP content, suggesting mitochondrial impairment. Proteome dynamics study revealed that mitochondrial defects are associated with reduced average half-lives of mitochondrial proteins in NAFLD mice (5.41 ± 0.46 versus 5.15 ± 0.49 day, p < 0.05). In particular, the WD reduced stability of oxidative phosphorylation subunits, including cytochrome b-c1 complex subunit 1 (5.9 ± 0.1 versus 3.4 ± 0.8 day), ATP synthase subunit α (6.3 ± 0.4 versus 5.5 ± 0.4 day) and ATP synthase F(0) complex subunit B1 of complex V (8.5 ± 0.6 versus 6.5 ± 0.2 day) (p < 0.05). These changes were associated with impaired complex III and F0F1-ATP synthase activities. Markers of mitophagy were increased, but proteasomal degradation activity were reduced in NAFLD mice liver, suggesting that ATP deficiency because of reduced stability of oxidative phosphorylation complex subunits contributed to inhibition of ubiquitin-proteasome and activation of mitophagy. In conclusion, the 2H2O-metabolic labeling approach shows that increased degradation of hepatic oxidative phosphorylation subunits contributed to mitochondrial impairment in NAFLD mice.
Mitochondrial dysfunction occurs in nonalcoholic liver disease (NAFLD)1 shown by altered morphology (1, 2) and reduced oxidative capacity of hepatic mitochondria (3, 4). Altered lipid metabolism and oxidative stress have been implicated in hepatic mitochondrial dysfunction in NAFLD. Insulin resistance-induced influx of fatty acids leads to hepatic steatosis and an adaptive increase in hepatic mitochondrial fatty acid oxidation. However, the metabolic flexibility of hepatic mitochondria in the early stages of NAFLD is lost in nonalcoholic steatohepatitis (NASH), the more advanced stage of NAFLD with alterations in enzyme activities and molecular regulation of critical mitochondrial metabolic pathways, including the tricarboxylic acid (TCA) cycle, ketogenesis, ureagenesis and oxidative phosphorylation (OxPhos) (5). Notably, hepatic electron transport chain (ETC) activity is decreased in patients with NASH (6). Human NASH is also characterized by altered liver ATP homeostasis and impaired hepatic ATP recovery in response to fructose challenge; therefore, it is believed that impaired energy metabolism is involved in the transition from fatty liver to NASH (7, 8). Reduced mitochondrial respiration produces excessive amounts of reactive oxygen species (ROS) involved in cytotoxicity (9). However, the underlying mechanisms of altered energy metabolism in NAFLD are not fully understood.
Proteomics technologies have been used to study different aspects of NAFLD. Hepatic mitochondrial proteome studies in rodent models of NAFLD revealed that mitochondrial defects are associated with decreased amounts of complex I (CI) subunits (10). Quantitative proteomics has also been used to characterize the biomarkers of human NAFLD and identified several plasma and hepatic proteins which are differentially expressed in NAFLD (11–13). Recently, phosphoproteomics profiling was applied to characterize the key metabolic pathways in the liver that can differentiate different stages of NAFLD (14). Although these studies are important, they are limited to static measurements of protein abundances but do not provide an insight into the mechanism of their changes. In addition, these measurements are less sensitive to physiological perturbations, as changes in protein abundance may not change substantially over time, whereas the protein pool is consistently renewed because of continuous turnover. Thus, it is critical to determine turnover rates which can accurately detect the changes in a protein's dynamics.
Sensible elimination of damaged mitochondrial proteins protects cells from harmful mitochondrial metabolism and the production of toxic metabolites. NAFLD is characterized by increased cellular stress that can accelerate proteolysis, mitophagy and cell death. There is limited data on the lifecycle of dysfunctional hepatic mitochondria and its role in hepatic energy metabolism in NAFLD. As a major site of ROS production, mitochondria are susceptible to oxidative damage. Increased hepatic oxidative stress in NAFLD may stimulate degradation of mitochondrial proteins involved in oxidative defense, and other critical metabolic pathways, including fatty acid oxidation, TCA cycle, and OxPhos. These perturbations may result in progressive mitochondrial dysfunction and hepatic energy deficit in NAFLD. Mitochondrial dynamic studies will help identify the mechanisms underlying oxidative stress and mitochondrial dysfunction in NAFLD.
Recently, we and others developed the heavy water (2H2O) metabolic labeling method for global proteome dynamic studies (15–19). We advanced this approach by coupling a high-resolution mass spectrometry-based proteomics approach and developed a customized software for high-throughput data analysis (20, 21). In our previous study, we applied this method to characterize liver-secreted plasma proteome dynamics in a diet-induced mouse model of NAFLD and demonstrated proinflammatory remodeling of the plasma proteome in NAFLD (22). Hepatic oxidative stress-induced changes in liver-secreted proteome composition and dynamics suggested altered ribosomal protein synthesis capacity of the NAFLD liver. Herein, we used this method to test the hypothesis that accelerated hepatic ROS production in NAFLD enhances degradation of ETC and F0F1-ATP synthase subunit proteins in a murine NAFLD liver. To assess the consequences of reduced stability of mitochondrial proteins, we characterized the expression levels and activities of individual OxPhos complexes. We also examined the role of the ubiquitin proteasome system (UPS) and autophagy/mitophagy in enhanced degradation of mitochondrial proteins in NAFLD livers.
EXPERIMENTAL PROCEDURES
Details regarding materials and methods are provided in the Supporting Information.
Animal Experiments
Male LDL receptor knock out (LDLR−/−) mice (8 weeks old) in a C57BL/6J genetic background from Jackson Laboratory (Bar Harbor, ME) were randomly divided into two groups (n = 4/group) and fed with the standard chow diet (20% kcal protein, 70% kcal carbohydrate and 10% kcal fat, Harlan Teklad, Madison, WI) for the control group or high saturated fat diet containing cholesterol, so-called Western diet (WD, 20% kcal from protein, 35% kcal from sucrose and 45% kcal from fat with 0.2% cholesterol added, WD, TD88137, Harlan Teklad) for the NAFLD group (Fig. 1). All mice were housed individually in a 12 h day: night cycle at controlled room temperature and accessible food and water ad libitum for 24 weeks. Mice received a bolus intraperitoneal injection of 2H2O (22 μl of 99.9% 2H-labeled saline/g of body weight) and then had free access to 5% 2H2O in drinking water for 10 days. Mice were then euthanized, and blood was collected by cardiac puncture. To quantify baseline natural enrichments of analyzed peptides, samples were also collected from a subgroup of mice (n = 4), which were fed ad libitum, and not exposed to heavy water. Data from these animals were used for the background natural isotope enrichment corrections in mice treated with 2H2O (23). A small fraction of the liver was saved in formalin solution for the histological analyses. The remaining part of the liver was frozen in liquid nitrogen and saved in −80 °C until further analyses. All animal procedures were approved by the Institutional Animal Care and Use Committee at NEOMED and were performed in accordance with NIH guidelines on humane care of experimental animals (https://olaw.nih.gov/policies-laws/phs-policy.htm).
Fig. 1.

The study design and experimental scheme for the mitochondrial proteome dynamics study. Eight weeks old mice were fed either a normal chow diet (control group) or a Western type diet (NAFLD group) for 24 weeks. Ten days before euthanasia, mice were loaded with a bolus injection of 22 μl 2H2O/g body weight, followed by free access to 5% 2H2O in drinking water. Mitochondrial proteins were fractionated on SDS-PAGE, proteins from selected gel bands were digested with trypsin and subjected to LC-MS/MS analysis. Protein kinetics were analyzed based on 2H-incorporation into tryptic peptides using custom-made software.
Glucose and Insulin Tolerance Tests
Glucose and insulin tolerance tests were performed following 22 weeks of the diet experiment before the tracer study. Glucose tolerance was measured in 6 h fasted mice. Briefly, after the baseline blood sampling from the tail vein, a bolus of glucose (20% w/w, 1 mg/g body weight) was injected intraperitoneally. Blood samples were taken at 15, 30, 60, and 120 min to measure glucose levels to determine glucose tolerance.
The insulin tolerance test was carried out in fed mice. After obtaining baseline glucose measurements, human insulin (Humulin, Lilly, Indianapolis, IN; 0.75 units/kg body weight) was administered by intraperitoneal injection and blood glucose was measured every 15 min for 60 min. Glucose use and insulin tolerance were determined based on the area under the blood glucose response curve.
Analytical Procedures
Serum levels of total triglycerides (TG) were determined using the TG assay kit (Pointe Scientific, Canton, MI). Total and HDL cholesterol levels were measured using Stanbio Cholesterol LiquiColor kit (Stanbio Laboratory, Boerne, TX) in serum and ApoB-depleted serum, respectively. Blood glucose was monitored using glucometer and test strips. Aspartate aminotransferase (AST) and alanine aminotransferase (ALT) were measured using commercial kits (Diagnostic Chemicals, Ltd., Oxford, CT).
Hepatic Oxidative Stress
Lipid peroxidation products, thiobarbituric acid reactive substances (TBARS) including malonyl dialdehyde, were quantified as a marker of hepatic oxidative stress using a commercially available assay kit (Cayman Chemical Co, Ann Arbor, MI).
Liver Histology
Formalin-fixed, paraffin-embedded liver tissue was sectioned and stained with hematoxylin and eosin (H&E) and Masson's trichrome. Liver histology was evaluated by an experienced liver pathologist (D. Allende) who was masked to the group of the mice. The WD-induced steatosis, lobular inflammation, ballooning and fibrosis were evaluated using the following, standard criteria: 0: absent; 1: mild; 2: moderate, and 3: severe and mixed (mix of two or more classifications) (24). NASH was defined by a composite outcome of steatosis, lobular inflammation and liver injury (ballooning and fibrosis) based on total activity score.
Mitochondrial Content
Citrate synthase (CS) activity was determined in liver homogenate (50 μg protein) using a CS assay kit (Detroit R&D, Detroit, MI). In brief, tissue homogenate was incubated with a reaction mixture including 50 mm Tris, pH 8.0, 100 μm 5,5-dithiobis(2-nitrobenzoic acid) (DTNB), and 300 μm acetyl coenzyme A at 37 °C. After adding oxaloacetate (500 μm), the reduction of DTNB was measured for 3 min at 412 nm and the enzyme activity was calculated using an extinction coefficient of ε412 = 13.6 mm/cm and expressed as nmol/min/mg protein.
Mitochondrial DNA Copy Number
The mitochondrial DNA copy number was measured in liver homogenate by quantitative real-time PCR as described (25). The primers are listed in supplemental Table S1.
ATP Content
Hepatic ATP levels were analyzed in liver homogenate using a fluorescence assay with a commercial kit following the manufacturer's recommended protocol (BioVision, Milpitas, CA). Liver tissue (100 mg) was homogenized in 500 μl of ATP assay buffer and centrifuged at 15,000 × g for 2 min at 4 °C. The supernatant was collected for the ATP analysis on fluorescence spectrophotometer with the excitation and emission wavelengths at 535 and 587 nm, respectively.
Preparation of Hepatic Mitochondria
Mouse liver mitochondria were isolated as described (26) with minor modifications. This protocol allows for the isolation of functional mitochondria with high yield from liver and other tissues (27). One g of the mouse liver was minced with saline and homogenized in 7 volumes of mitochondria extraction buffer (220 mm mannitol, 70 mm sucrose, and 5 mm MOPS (pH 7.4)) containing protease inhibitor mixture (Sigma-Aldrich, St. Louis, MI). Nuclei, unbroken whole cells, and cytoskeletons were pelleted down by centrifugation at 600 × g for 10 min. Then, the supernatant was collected and centrifuged to obtain the mitochondrial fraction. The mitochondrial pellet was purified by 3 cycles of resuspension, homogenization and centrifugation (at 7000 × g for 10 min) at 4 °C and were stored at −80 °C until further analysis. Mitochondrial integrity was examined by measuring cytochrome c oxidase (COX) activity in the presence and absence of N-dodecyl β-d-maltoside (DDM) (28). For this purpose, mitochondria (2 μg ± 0.1% DDM) were mixed with ferrocytochrome c and then cytochrome c oxidase-induced oxidation of ferrocytochrome c was measured at 550 nm. Because the mitochondrial outer membrane prevents entrance of substrates into the mitochondria, only damaged mitochondria display COX activity. DDM breaks the outer membrane that results in maximum COX activity (supplemental Fig. S1A). The purity of isolated mitochondria was determined based on the immunoassay of subcellular markers and by subcellular grouping of identified proteins using a shotgun proteomics approach.
Total Body Water 2H2O Enrichment Measurement
2H-enrichment of body water, in parallel with a set of calibration curve samples containing 0–5% 2H2O, was measured using gas chromatography-mass spectrometry (GC-MS Agilent Technologies, Santa Clara, CA) analysis as described (15).
Protein Fractionation and Sample Preparation for Proteomics Analysis
Hepatic mitochondrial proteins (30 μg) from frozen mitochondria were fractionated with sodium dodecyl sulfate polyacrylamide gel electrophoresis (SDS-PAGE). In-gel digested tryptic peptides were analyzed by nanospray LC-MS/MS after reconstitution in 0.1% formic acid.
LC-MS/MS Analysis
A solution containing the tryptic peptides was analyzed by Ultimate 3000 UHPLC (Thermo Fisher Scientific) coupled online to Q Exactive™ Plus Hybrid Quadrupole-Orbitrap™ Mass Spectrometer (Thermo Fisher Scientific). The samples were first loaded on an Acclaim PepMap100 precolumn (300 μm x 5 mm, C18, 5 μm, 100Å, Thermo Fisher Scientific) for desalting, and then directed to an Acclaim PepMap RSLC reverse phase nanocolumn (75 μm x 15 cm, C18, 2 μm, 100Å, Thermo Fisher Scientific) at 300 nL/min with a mobile phase A (0.1% formic acid in water) and B (20% water in acetonitrile with 0.1% formic acid). For a chromatographic fractionation of tryptic peptides, a stepwise gradient was employed with an initial 2% of mobile phase B. After 4 min of de-salting, mobile phase B was linearly increased to 40% in 100 min. Mobile phase B was then ramped to 90% in 5 min and then held at 90% B for 10 min. Subsequently, mobile phase B was decreased to 2% for 2 min and equilibrated for 13 min with 2% of phase B.
Mass spectrometry analysis was performed in data-dependent acquisition mode with a full profile MS scans at 70,000 resolution (200 m/z) between 380 and 1300 m/z. MS/MS spectra were collected in data-dependent acquisition mode for the 12 most abundant product ions with an isolation window of 1.5 ± 0.4 m/z and 17,500 resolution (200 m/z). Higher-energy collisional dissociation (HCD) was performed at normalized collision energy of 25%. The precursor ion masses were dynamically excluded from MS/MS analyses for a duration of 17 s. Ions with the charge state 1, and greater than 6 were excluded from MS/MS analyses. MS and MS/MS spectra were acquired for 100 ms with the automatic gain control (AGC) target set at 1.0 × 10⁶ and 2.0 × 10⁴ ions for MS and MS/MS scans, respectively.
Proteome Dynamics Analysis
For protein identification, all the MS/MS spectra obtained from the mass spectrometer were transformed into a Mascot Generic Format (MGF) peak list file using ProteoWizard MSconvert Version 3.0.18116 (http://proteowizard.sourceforge.net/tools), and the MGF file was searched using the Mascot 2.3 (Matrix Science, London, UK) software against the Mouse MitoCarta 2.0 mitochondrial protein database released on 2015 (containing 1520 entries) (29) with cysteine carbamidomethylation as fixed modification and methionine oxidation and lysine acetylation as variable modifications, respectively, and trypsin digestion with a maximum of two missed cleavages per peptide. Other post translational modifications (PTM) were: 4-hydroxynonenal and/or 4-oxononenal addition to arginine and lysine residues; tyrosine and tryptophan nitration; and asparagine/glutamine deamidation. The mass tolerance of the parent and product ions was set at 10 ppm and 0.2 Da, respectively. For peptide identification, a Mascot score of greater than 35 was applied as cutoff threshold along with 95% identification confidence Blast search (http://blast.ncbi.nlm.nih.gov/Blast.cgi) was used as needed to confirm the uniqueness of identified peptides. To minimize the false discovery rate (FDR), the Mascot search was performed with the decoy option. Protein identifications were accepted if they could achieve greater than 99% probability and FDR of less than 1% and contained at least two identified unique peptides.
A custom-built software application was employed to calculate 2H isotopic enrichment (E) in the proteins of interest (17). This software works with the data obtained from the mass spectrometer to list all the proteins and derives the isotopomer distribution of peptides from their corresponding extracted ion chromatograms (17). The turnover rate constant (k) was estimated based on the precursor/product relationship (15), if 2H2O is the precursor and a proteolytic peptide is the product using Eq. (1):
| (Eq. 1) |
where “slope of peptide labeling” is the rate of the increase in 2H-labeling of the product during 2H2O administration and Ewater is the steady state enrichment of total body water. N is the asymptotic constant number of 2H incorporated into an analyzed peptide, which is calculated based on the number of metabolically exchangeable H atoms at C-H sites of a peptide sequence (17, 30).
We assume that protein levels do not change in the adult mice during the relatively short 2H2O-metabolic labeling study period, and that there is a steady-state flux of all proteins. Thus, at a steady state the rate-constant represents both the fractional synthesis rate (FSR) and the fractional catabolic rate (FCR). The half-life of a proteins, i.e. the time required for the synthesis of half of the pool, was calculated using Eq. 2:
| (Eq. 2) |
Isolation and Quantification of Intact ETC and F0F1-ATPase Complexes
Mitochondrial ETC complexes were separated by blue native polyacrylamide gel electrophoresis (BN-PAGE) as previously described (26). Briefly, 300 μg of isolated mitochondria were solubilized with 200 μl of BN-PAGE buffer (50 mm NaCl, 50 mm imidazole/HCl, 2 mm 6-aminohexanoic acid, 1 mm EDTA, pH 7.0) and centrifuged (Beckman Coulter Optima MAX-TL Ultracentrifuge, 10 min, 100,000 × g). The collected pellet was solubilized in BN-PAGE buffer supplemented with 12 μl of 20% digitonin (a digitonin/protein ratio of 8 (g/g)) for 30 min on ice. To remove insoluble particles, this solution was centrifuged as described above. The solubilized protein complexes were mixed with Coomassie dye to give a final detergent/Coomassie ratio of 8 (g/g) and fractionated on a 3–12% gradient gel at 70 V for 18 h in the presence of the 1× Native PAGE running buffer (Invitrogen Life Technologies, Waltham, MA). The gels were stained overnight with Coomassie to visualize protein bands. The gel images were scanned and the contents of intact OxPhos complexes were quantified using gel imaging software, MultiGauge 3.0 (Fuji Film, Japan) and Image J (National Institute of Health).
Activity Assays of ETC and ATPase Complexes
The activities of ETC and ATPase complexes were quantified in isolated mitochondria using the in-gel activity assays (31). Mitochondrial proteins (40 μg) were separated by BN-PAGE as described above and gel strips for each complex were used for their analysis. In-gel complex I (CI) activity was determined based on a NADH dehydrogenase-coupled enzymatic reaction. Briefly, a gel strip was incubated in the assay buffer composed of 5 mm Tris, pH 7.4, 0.1 mg/ml of NADH, and 2.5 mg/ml nitrotetrazolium blue (NTB) for 4 min. Similar to the CI assay, complex II (CII) activity was measured using a succinate dehydrogenase (SDH) enzymatic reaction. In this assay, the gel strip was treated with a buffer containing 20 mm sodium succinate, 0.2 mm phenazine methosulfate, and 2.5 mg/ml NTB in 5 mm Tris, pH 7.4 for 25 min. SDH converts succinate into fumarate and FADH2, where FADH2 reduces NTB to purple-colored formazan on gel. Complex III (CIII) activity on the gel strip was measured based on a Q cycle reaction in which CIII transfers electrons from ubiquinol to cytochrome c, resulting in the reduction of cytochrome c. In this assay, 3,3′-diamidobenzydine (DAB, 5 mg in 10 ml of 50 mm sodium phosphate, pH 7.2), a replacement of ubiquinol, donates electrons to cytochrome c (generating a brown color on the gel). Complex IV (CIV) activity was measured using a cytochrome c oxidase (COX) enzymatic reaction in the presence of 5 μm horse heart cytochrome c and 5 mg DAB in 10 ml of 50 mm sodium phosphate, pH 7.2. Complex V (CV) activity was measured based on ATP hydrolysis to inorganic phosphate by CV isolated on gel. The assay buffer is composed of 35 mm Tris, 270 mm glycine, with a pH 8.3, 14 mm MgSO4, 0.2% lead nitrate, 8 mm ATP. In this assay, ATP is hydrolyzed to inorganic phosphate which forms white lead phosphate crystals on CV gel band. All in-gel activity assays were stopped with 50% methanol and 10% acetic acid solution except for the CV assay that was quenched with 50% methanol. Gel strips were scanned and gel images were quantitated with ImageJ and Fuji Film MultiGauge 3.0.
Protease Activity Assay
The liver tissue was homogenized in 50 mm TrisHCl (pH 7.5) containing 2 mm ATP, 5 mm MgCl2, 1 mm DTT, 1 mm EDTA, and 100 mm NaCl. Hepatic protease activity in the liver homogenate was measured using fluorescence-labeled peptide substrates, succinyl-LLVY-7-amido-4-methylcoumatin (AMC) (R&D Systems, Inc., Minneapolis, MN), Boc-LSTR-AMC (Bachem, Bubendorf, Switzerland), and Z-LLE-AMC (UBPBio, Aurora, CO) for chymotrypsin-, trypsin- and caspase-like activity assays, respectively (32). The assays were performed using 20 μg protein in the presence of 20 mm TrisHCl (pH 7.5), 1 mm DTT, 30 μm substrate, 5 mm MgCl2 and 1 mm ATP in 100 μl volume. To verify the proteasome activity, epoxomicin (Boston Biochem, Cambridge, MA), a proteasome-specific inhibitor, was separately added to the assay solution at the final concentration of 100 nm for both chymotrypsin-like and trypsin-like activity assays and 1000 nm for caspase-like activity assay. The released fluorophore product AMC was monitored for 1 h at 37 °C (Ex/Em = 380/460 nm). Proteasome activity was calculated as the difference between the total activity in liver homogenate and the residual activity in the presence of the proteasome inhibitor epoxomicin.
Immunoblot Analysis
Proteins from liver homogenate or hepatic mitochondria were extracted using the radio-immunoprecipitation assay (RIPA) buffer. Protein samples (20 μg) were separated on 4–20% gradient TGX gel (Bio-Rad, Hercules, CA) at 100 V for 50 min under denaturating conditions. After electrophoresis, the proteins were transferred to PVDF membrane (Bio-Rad). The subunits of mitochondrial complexes were detected with 1:1000 monoclonal antibodies (anti-NADH dehydrogenase [ubiquinone] 1 beta subcomplex subunit 8 (NDUFB8) for CI, anti-succinate dehydrogenase B (SDHB) for CII, anti-cytochrome b-c1 complex subunit 2 (UQCRC2) for CIII, anti-cytochrome c oxidase subunit 1 antibody for CIV and anti-ATP5A antibody for CV) (Abcam, Cambridge, MA). Anti-GRP78 and anti-GAPDH (Proteintech, Rosemont, IL) were used to determine subcellular markers of endoplasmic reticulum (ER) and cytosol, respectively. Ubiquitination and autophagy/mitophagy were assessed using the anti-ubiquitin (Thermo Fisher Scientific, Waltham, MA), anti-Beclin-1, anti-P62, and anti-LC3 I/II, anti-Atg5, anti-Atg7, and anti-Atg12 (Cell Signaling Technology, Danvers, MA), anti-PINK1, and anti-Parkin (Proteintech, Rosemont, IL) anti-bodies. Hepatic expression of PGC1α and MnSOD2 were quantified using anti-PGC1α, and anti-MnSOD2 antibodies (Santa Cruz, Dallas, TX). To assess the oxidative damage of mitochondrial proteins, isolated mitochondria were treated with 2,4-dinitrophenylhydrazine (DNP). (DNP)-conjugated proteins were detected using the anti-DNP antibody (Sigma-Aldrich, St. Louis, MI). Membranes were incubated with corresponding secondary antibodies. Immunoreactivity was detected using an Amersham Biosciences ECL Prime Western blotting Detection Kit (GE HealthCare Lifesciences, Pittsburgh, PA), and quantified with ImageJ (NIH) and MultiGauge 3.0 (FuJifilm, Japan).
Gene Ontology Pathway Analysis and Visualization
Pathway analysis was carried out with the knowledge base InnateDB (http://www.innatedb.com), which is an integrated analysis platform, to identify significant pathways associated with the different protein turnover rates against the KEGG database. Two different mean values of half-lives of control and NAFLD groups were uploaded along with their Uniprot IDs onto InnateDB and statistically overrepresented pathways were displayed in the data set.
Data Presentation and Statistical Analysis
We performed 4 biological replicates in each group Data are shown as the excess labeling of multiple unique peptides (n = 2–15) of each protein in a given mouse experiment. The outlier peptides were excluded from analysis based on the coefficient of variation of rate constants higher than 20%. Error bars represent standard deviations based on biological variabilities between animals (n = 4/group). The statistical significance of differences between the rate constants of the same protein from different groups was tested using a student t test. One-way ANOVA was used to compare proteins with different functions and proteins from different mitochondria compartments (inner membrane, outer membrane and matrix). A p value < 0.05 was considered statistically significant.
RESULTS
Development of NAFLD in Response to a Western Diet
We have previously reported that after 3 months of feeding a high fat diet containing cholesterol (WD), LDLR−/− mice develop obesity, insulin resistance, fatty liver, hepatic oxidative stress and inflammation—all markers of NAFLD (33). Even though 3 months of a WD induced NAFLD, hepatic fibrosis - a characteristic of NASH, was not noted. Therefore, mice were fed a WD for 6 months. Mice on standard chow diet were uniformly lean, insulin sensitive, free of hyperglycemia, steatosis, inflammation, and fibrosis. In contrast, mice fed a WD for 6 months developed severe obesity (48% increase in body weight), dyslipidemia, hyperglycemia, and reduced insulin sensitivity based on glucose and insulin tolerance tests (Table I and Fig. 2A–2B). Mice fed a WD for 6 months also had increased serum levels of ALT, AST, and reduced AST/ALT ratio, all markers of liver damage (all p < 0.05) (Table I). Consistently, these mice also displayed hepatic steatosis, inflammation and fibrosis as evident from H&E and trichrome staining of liver slides (Fig. 2C–2D). Based on a composite mean NAFLD score (3.3 ± 1.8) (24), a WD feeding for 6 months lead to the development of only a mild NASH phenotype in LDLR−/− mice.
Table I. Biochemical characteristics of control and NAFLD mice.
Eight weeks old LDLR−/− mice fed a standard chow diet (control) or a Western diet consisting of a high fat diet and cholesterol (NAFLD) for 24 weeks. Fasting blood glucose, serum lipids and liver enzymes were measured and the composite NAFLD score (NAS) were quantified in paraffin-embedded sections of liver slides stained with hematoxylin and eosin (H&E) and trichrome by the pathologist.
| Control | NAFLD | p valuea | |
|---|---|---|---|
| Body weight (g) | 29.4 ± 0.6 | 42.9 ± 2.7 | p < 0.01 |
| Fasting glucose (mg/dL) | 148.4 ± 28.2 | 175.3 ± 21.2 | p < 0.05 |
| TGserum (mg/dL) | 114.6 ± 40.6 | 304.8 ± 84.6 | p < 0.05 |
| Total cholesterol (mg/dL) | 228.5 ± 4.4 | 1002.0 ± 114.4 | p < 0.001 |
| HDL cholesterol (mg/dL) | 45.1 ± 4.1 | 35.3 ± 3.6 | p < 0.05 |
| ALT (Units/L) | 28.9 ± 5.8 | 149.9 ± 34.7 | p < 0.005 |
| AST (Units/L) | 46.1 ± 11.8 | 111.4 ± 16.8 | p < 0.001 |
| AST/ALT | 1.60 ± 0.3 | 0.74 ± 0.2 | p < 0.05 |
| NAFLD activity score (0–8) | 0 ± 0 | 3.3 ± 1.8 | p < 0.005 |
ap values are from student t-test.
Fig. 2.

WD results in impaired glucose utilization and insulin sensitivity and induces steatosis, lobular inflammation, hepatocyte ballooning and fibrosis in LDLR−/− mice. A, Glucose tolerance test. Glucose levels and the area under the curve during the intraperitoneal glucose tolerance test at 0, 15, 30, 60, and 120 min. B, Insulin tolerance test. Insulin sensitivity was determined based on blood glucose levels and area under the curve at 0, 15, 30, 45, and 60 min post-insulin injection. Representative hematoxylin and eosin (H and E)- (C and D) and trichrome-stained liver sections (E and F) (20× magnification). Livers from NAFLD mice show the presence and distribution of accumulated fats, lobular inflammation (arrow), mild hepatocyte ballooning (arrow head) (C) as well as the reactive fibrosis (oval arrow) (F). Data represent mean ± S.D., n = 4/group, *p < 0.05, **p < 0.001, and ***p < 0.0001.
Mitochondrial Protein Turnover Rates Are Altered in NAFLD Mouse Liver
Protein turnover can be estimated using “short-term” and “long-term” labeling protocols. The latter approach relies on sample collections at multiple time points and long-term tracer exposure to achieve the plateau labeling of proteins and calculation of the turnover rate constants using non-linear regression analysis of 2H labeling of tryptic peptides. Although this approach does not require the knowledge of the precursor enrichment, it requires analysis of mitochondria from multiple animals at each time point. In contrast, the “short-term” protocol allows calculation of the rate constants based on only two time points (baseline and terminal) 2H-labelings of peptides (product) and requires body water (tracer precursor) enrichment measurements. Although the “short-term” labeling protocol is simple and practical, it puts two constraints on the study design. First, for accurate rate constant measurements, it is critical to take the measurements during the semi-linear segment of the labeling curve. Previous studies have shown that the median half-life of hepatic mitochondrial proteins in mice is 4.26 days (34). Since it requires 5–6 half-life cycles to achieve the plateau labeling, to capture the semi-linear segment of labeling curve, we chose 10 days for the 2H2O labeling duration to quantify the kinetics of hepatic mitochondrial proteins. The second issue is related to accurate measurement of 2H-labeling of peptides in short-term turnover studies. In this study, 22 μl 2H2O/g body weight bolus followed by 5% 2H2O in drinking allowed us to achieve ∼2.8% 2H-enrichment of body water (not shown). This resulted in >3% 2H-enrichment in multiple peptides that could be accurately quantified. Thus, this labeling protocol allows accurate quantification of hepatic mitochondrial protein kinetics.
To increase the coverage of the mitochondrial proteome, we isolated hepatic mitochondria using a standard centrifugation method instead of the Percoll gradient method used for the isolation of highly purified mitochondria (35). Based on COX assay in frozen mitochondria samples, we demonstrated that more than 80% of isolated mitochondria had intact outer membranes (supplemental Fig. S1A). The purity of mitochondria was determined based on the immunoassay and shotgun proteomics analysis of non-mitochondrial subcellular marker proteins (supplemental Fig. S1B and supplemental Table S2). Compared with whole tissue lysate, mitochondria isolation by three cycles of centrifugation allowed substantial depletion of GRP78 and GAPDH, markers of ER and cytosol, respectively. However, our mitochondria-enrichment method did not eliminate these contaminants. Mitochondrial proteins were further fractionated using SDS-PAGE and the 12 most intense gel bands were analyzed by high-resolution LC-MS/MS (supplemental Fig. S1C). We identified 663 and 659 proteins in control and NAFLD mice (supplemental Fig. S1D), respectively. As shown in the Venn diagrams, 638 (93.3%) of these proteins were present in both groups (supplemental Fig. S1D). Based on Uniprot database, 545 (80.4% of all identified) proteins were characterized as mitochondrial proteins (supplemental Table S2, supplemental Fig. S1E). The remaining proteins were distributed between ER (1.9%), peroxisome (3.8%), nucleus (2.1%), cytoplasm (6.9%), and cell membrane (2.8%). Thus, although this mitochondria isolation procedure results in the contamination of the mitochondrial fraction with other cellular structures and organelles, it substantially reduces the complexity and allows for the isolation of mitochondria with preserved functionality. Only proteins satisfying the following benchmarks were selected for quantification: the presence of the same peptides in all mice from the baseline (t = 0 day), control and NAFLD groups (t = 10 day), at least two unique quantifiable peptides for each protein, good chromatography free of any interfering signals, ion intensity (106-108), and the presence of at least 2 non-essential amino acids in a peptide sequence. Because of these stringent criteria, the kinetics of only 128 mitochondrial proteins were amenable to accurate quantification.
Protein turnover was quantified based on the enrichment with 2H in peptide isotopomers (defined as structurally identical isomers with the addition of heavy isotopic atoms). For example, the high-resolution spectra of VVAVDCGIK peptide from carbamoyl-phosphate synthase (CPS) show the changes in isotope distribution with an increase in heavy isotopomers in control and NAFLD mice after 10 days of 2H2O intake (supplemental Fig. S2). The magnitude of 2H-incorporation in the mouse with NAFLD is higher than the control, indicating increased turnover rate of CPS, which could then be precisely calculated as shown in supplemental Tables S3–S5.
Although WD-induced NAFLD had differential effects on the kinetics of hepatic mitochondrial proteins, the average half-life of mitochondrial proteins, calculated based on 128 quantified proteins, was significantly reduced in NAFLD livers (5.41 ± 0.46 days in control versus 5.15 ± 0.49 days in NAFLD mice, p < 0.05) (Fig. 3A). This was also reflected in the linear regression plot of the half-life of proteins in the NAFLD group as a function of values in the control group (Fig. 3B). In addition to a significant correlation of half-lives of proteins in control and NAFLD groups (r2 = 0.66, p < 0.05), the slope of the regression curve (0.81) indicates that the average half-life of proteins was reduced by ∼19% in hepatic mitochondria from NAFLD mice.
Fig. 3.

Comparisons of half-lives of hepatic mitochondrial proteins in control and NAFLD mice. A, The average half-life of hepatic mitochondrial proteins (n = 128) were significantly decreased in NAFLD mice. Each data point represents the half-life of a distinct protein. B, The linear regression plot of the half-lives of proteins in NAFLD mice as a function of values in control mice. C, Comparison of the half-lives of hepatic mitochondrial proteins based on their intra-organelle localization in the matrix (n = 77), mitochondrial inner membrane (MIM, n = 42) and mitochondrial outer membrane (MOM, n = 9). D, Comparison of half-lives of hepatic mitochondrial proteins based on their molecular functions. White and black bar graphs represent control and NAFLD mice, respectively. Values are given as mean ± S.D. n = 4/group. *p < 0.05 and **p < 0.001.
Because mitochondrial proteins can be degraded by different mechanisms depending on their intra-organelle locations, we grouped the proteins based on their location within the mitochondria and compared their half-lives. Out of 128 quantified proteins, 77, 42 and 9 proteins were distributed in the matrix, mitochondrial inner membrane (MIM) and mitochondrial outer membrane (MOM), respectively (Fig. 3C, supplemental Tables S3–S5). The smaller number of quantified outer membrane proteins could be related to low abundance and poor solubility of these proteins (36). The one-way ANOVA test did not show any significant differences among half-lives of proteins of distinct mitochondrial compartments within the same group. When the control and NAFLD groups were compared, the half-lives of matrix proteins were significantly shorter in NAFLD mice compared with controls (p < 0.05). A similar trend was observed for MIM, however it did not reach significance (p = 0.07). In contrast, the half-lives of MOM proteins were significantly higher in NAFLD mice compared with controls (p < 0.05).
Hepatic mitochondrial proteins were further analyzed after grouping them based on their metabolic functions. The functional grouping shows that most proteins with altered turnover belong to metabolic pathways involved in amino acid metabolism, TCA cycle, fatty acid oxidation and OxPhos (supplemental Fig. S3). Although there was a trend toward the increased degradation of proteins involved in the TCA cycle, fatty acid oxidation, urea cycle, ketogenesis, and OxPhos, only pyruvate dehydrogenase (PDH) complex and carnitine shuttle proteins displayed significant differences between groups. The average half-lives of PDH subunits involved in glucose metabolism were significantly reduced (p < 0.05), but proteins involved in mitochondrial fatty acid transport were significantly increased in NAFLD mice compared with controls (p < 0.001) (Fig. 3D). For example, WD-induced NAFLD was associated with a significant increase in the stability of carnitine O-palmitoyltransferase 1 (CPT1). A similar trend was observed for voltage-dependent anion-selective channel protein 3 (p = 0.06) (supplemental Fig. 4A and supplemental Table S5). Although the averaged half-lives of proteins involved in mitochondrial fatty acid oxidation tend to be reduced (Fig. 3D), the half-life of mitochondrial trifunctional protein α was increased in NAFLD mice (p < 0.05) (supplemental Table S5). However, a WD-induced NAFLD led to reduced stability of carbamoyl-phosphate synthase (CPS) and ornithine carbamoyltransferase (OTC), two critical mitochondrial enzymes of the urea cycle (all p < 0.05) (supplemental Fig. S4B).
Next, we compared the kinetics of individual subunits of ETC (CI-CIV) and F0F1 ATP synthase (CV) complexes. Although no significant changes were observed in the kinetics of several CI and CII (SDH) subunits (Fig. 4A–4B), the half-lives of CIII (Cytochrome b-c1 complex subunit 1, QCR1), CIV (Cytochrome c oxidase subunit 4 isoform 1, COX41), CV (ATP synthase subunit α (ATPA) and ATP synthase F(0) complex subunit B1 (AT5F1)) were significantly reduced in the NAFLD mice compared with controls (all p < 0.05) (Fig. 4C–4E).
Fig. 4.

Comparison of half-lives of individual electron transport chain (ETC) complexes (CI-CIV) (A–D) and F0F1-ATP synthase (CV) (E) subunits in control and NAFLD mice. NDUAA: NADH dehydrogenase [ubiquinone] 1 alpha subcomplex subunit 10; NDUS1: NADH-ubiquinone oxidoreductase 75 kDa subunit; NDUS2: NADH dehydrogenase [ubiquinone] iron-sulfur protein 2; NDUV1: NADH dehydrogenase [ubiquinone] flavoprotein 1; SDHA: Succinate dehydrogenase flavoprotein subunit α; QCR1: Cytochrome b-c1 complex subunit 1; QCR2: Cytochrome b-c1 complex subunit 2; COX41: Cytochrome c oxidase subunit 4 isoform 1; COX5A: Cytochrome c oxidase subunit 5A; COX5B: Cytochrome c oxidase subunit 5B; CY1: Cytochrome c1, heme protein; ATPA: ATP synthase subunit α; ATPB: ATP synthase subunit β; AT5F1: ATP synthase F(0) complex subunit B1; ATP5I: ATP synthase subunit e. Mean ± S.D. White and black bar graphs represent control and NAFLD mice, respectively. *p < 0.05 and **p < 0.001.
Because hepatic oxidative stress is known to be increased in NAFLD (33), the kinetics of critical antioxidant, mitochondrial manganese-dependent superoxide dismutase 2 (MnSOD2) and glutathione peroxidase were quantified. Electrons leaked from ETC are dismutated by MnSOD2 into hydrogen peroxide, which is then converted into water by glutathione peroxidase (GPx). Although no differences were observed in the turnover rates of MnSOD2, the half-life of GPx was significantly reduced in NAFLD mice compared with controls (supplemental Table S5) (p < 0.05). Thus, despite the overall reduction in the averaged half-lives of all quantified mitochondrial proteins, the kinetic analyses of individual proteins from specific metabolic pathways show distinct alterations in their turnover rates.
Altered Mitochondrial Protein Turnover in NAFLD Mice Is Associated with Hepatic Mitochondrial Defects
To determine whether WD-induced NAFLD in a mouse model was associated with mitochondrial defects, we quantified CS activity and ATP levels in the liver tissues as measures of mitochondrial oxidative metabolism. The activity of CS was ∼25% lower in NAFLD livers, reflecting reduced mitochondrial mass in NAFLD mice compared with controls (p < 0.05) (Fig. 5A). This was associated with a ∼50% decrease in hepatic ATP content (p < 0.001) (Fig. 5B), suggesting that altered oxidative metabolism in NAFLD contributed to impaired hepatic mitochondrial ATP production.
Fig. 5.

A WD-induced NAFLD is associated with hepatic mitochondrial defects in LDLR−/− mice. A, Hepatic citrate synthase (CS) activity measured in liver tissue, B, Hepatic ATP content measured in liver tissue. C, Coomassie-stained images of fully assembled ETC complexes and F0F1-ATP synthase from isolated liver mitochondria (40 μg protein) separated on BN-PAGE in parallel with native protein markers (M). D, Quantified expression of fully assembled mitochondrial complexes in bar graphs. Data were normalized relative to controls. E, Immunoblot analysis of respiratory chain proteins in isolated mitochondria. Proteins from isolated hepatic mitochondria (15 μg) were fractionated on SDS-PAGE gel (4–12%) and transferred to PVDF membrane. Western blot analysis was performed using antibodies for NDUFB8 (CI subunit), SDHB (CII subunit), UQCR2 (CIII subunit), COX1 (CIV subunit) and ATPA (CV subunit). F, Immunoblot bar graphs show the expression levels of mitochondrial proteins after normalization to HSP60. G, In-gel enzyme activity assays of ETC and F0F1-ATP synthase in isolated hepatic mitochondria. H, Bar graphs of gel images from in-gel activity assays are expressed as the fold change compared with controls relative to mitochondrial protein content. Gel images were quantified by densitometry using ImageJ 1.41 software. All values represent mean ± S.D., n = 4/group, *p < 0.05 and **p < 0.001.
To assess the role of the altered protein turnover in hepatic mitochondrial dysfunction and reduced ATP production, we fractionated the intact ETC and F0F1 ATP synthase complexes by BN-PAGE and estimated the content and activity of fully assembled complexes using in-gel activity assays. Consistent with the reduction in half-life for QCR1 (CIII), ATPA and AT5F1 (CV), quantification of Coomassie-stained gel images of separated individual complexes revealed a trend toward reduced content of CIII and a significant reduction of fully assembled CV in NAFLD mice compared with controls (p < 0.05) without any significant changes in other ETC complexes (Fig. 5C and 5D). We then quantified the expression of NDUFB8 (CI), SDHB (CII), UQCRC2 (CIII), COX1 (CIV) and ATPA (CV), the critical components of oxidative phosphorylation complexes. Consistent with the total protein content of fully assembled complexes (Fig. 5C and 5D), the immunoblots showed no changes in CI-CIV subunits but a significant reduction in ATPA (CV) expression in NAFLD mice liver (p < 0.05) (Fig. 5E and 5F).
To determine whether the changes in reduced stability of OxPhos proteins had any functional consequences, we also quantified the activity of each individual complex based on in-gel activity assays. Interestingly, increased degradation of CIII and CV subunits were associated with their reduced activities, suggesting that reduced stability of subunits resulted in impaired mitochondrial function. (Fig. 5G and 5H). Normalization for the mitochondrial content using either CS activity or mtDNA copy number eliminated the differences between the groups in CIII and CV activities (supplemental Fig. S5A and S5B), implying that depletion of mitochondrial content contributed to mitochondrial impairment in NAFLD mice.
Because impaired OxPhos increases ROS production (9), oxidative damage to lipids and proteins were measured. A WD-induced NAFLD is associated with hepatic oxidative stress as indicated by increased levels of TBARS, lipid peroxidation products (Fig. 6A) without any changes in carbonylated proteins (supplemental Fig. S6A). To determine whether hepatic oxidative stress was related to impaired anti-oxidant capacity of mitochondria in NAFLD mice, the expression of mitochondrial anti-oxidant manganese-dependent superoxide dismutase 2 (MnSOD2) was measured. Both whole tissue lysate and mitochondria from NAFLD mice liver displayed significantly increased MnSOD2 expression (p < 0.05, supplemental Fig. S6B and Fig. 6B), suggesting that increased hepatic oxidative stress in NAFLD mice was not because of decreased detoxification, but to overproduction of mitochondrial ROS.
Fig. 6.

A Western diet induced hepatic oxidative stress in LDLR−/− mice was not related to impaired anti-oxidant capacity of mitochondria. A, The hepatic levels of thiobarbituric acid reactive substances (TBARS) were increased in the NAFLD mice compared with controls. B, Immunoblots of MnSOD2 expression in the mitochondria from control and NAFLD mice. Heat shock protein 60 (HSP60) was used as a loading control. Data represent mean ± S.D., n = 4/group, *p < 0.05.
Increased Autophagy/Mitophagy Is Involved In Enhanced Degradation Of Hepatic Mitochondrial Proteins in NAFLD Mice
Our results show depletion of hepatic mitochondria as measured by CS activity (Fig. 5A) and the levels of intact CV (Fig. 5C–5F) in NAFLD mice. The content of mitochondria within the cells is determined by the balance of mitochondrial biogenesis and degradation. Several pathways are involved in the degradation of mitochondrial proteins. Although intrinsic mitochondrial proteases and mitochondria-derived vesicles contribute to the clearance pathways engaged in mitochondrial quality control via degradation of misfolded and oxidized proteins, respectively, the ubiquitin proteasome system (UPS) contributes to clearance of damaged outer membrane or improperly targeted nuclear DNA-encoded proteins. To determine if UPS contributed to increased turnover of mitochondrial proteins, we quantified the total ubiquitination of mitochondrial proteins using anti-ubiquitin specific immunoblot. The accumulation of ubiquitinated proteins was significantly decreased, but monoubiquitin levels were increased in NAFLD mice (Fig. 7A and 7B). These changes may reflect decreased proteasomal degradation because of compromised proteolytic activity (37, 38) or increased flux in this pathway that results in efficient sequestration of ubiquitinated intermediates and recycling of monoubiquitin (39, 40). To further examine the role of UPS in enhanced degradation of mitochondrial proteins in NAFLD mice liver, we also measured proteasome activity using specific substrates for chymotrypsin-like, trypsin-like and caspase-like activities with and without epoxomicin, a proteasome specific inhibitor (41). As expected, epoxomicin completely inhibited chymotrypsin-like and trypsin-like protease activities at 100 nm, concentrations (supplemental Fig. S7A and S7B). However, epoxomicin only partially inhibited caspase-like activity even at 1000 nm concentration (supplemental Fig. S7C), suggesting that the caspase-like activity measured in this experiment is not proteasome-specific. Therefore, to evaluate the role of UPS in mitochondrial proteins' degradation, we used trypsin-like and chymotrypsin-like activities but not caspase-like activity. Consistent with decreased ubiquitination, we found that both trypsin-like and chymotrypsin-like activities were strikingly reduced because of a WD-induced NAFLD (Fig. 7C and 7D). These data show that proteasomal degradation was not involved in increased clearance of mitochondrial proteins.
Fig. 7.

The ubiquitin proteasome system (UPS) is down-regulated and autophagy/mitophagy is up-regulated in NAFLD mice liver. A, Western blot analysis of ubiquitinated proteins in hepatic mitochondria from control and NAFLD mice. B, Bar graphs of gel images from ubiquitination assay. Gel images were quantified by densitometry using ImageJ 1.41 software. Expression of mitochondrial ubiquitinated proteins were normalized relative to HSP60. Data represent mean ± S.D. *p < 0.05. C and D, Proteasome activity was evaluated in the liver homogenates from control and NAFLD mice using fluorescent-tagged peptide substrates for chymotrypsin and trypsin. The activity was normalized relative to the total tissue protein content. Data represent mean ± S.D. **p < 0.005. E, Western blot analysis of autophagy markers in liver homogenates of NAFLD and control mice using anti-Beclin-1, anti-P62, anti-LC3-I/II, anti-Atg5, anti-Atg7, and anti-Atg12 antibodies. F, Bar graphs of gel images from autophagy markers assay. Data were normalized relative to actin. G, Western blot analysis of mitophagy markers in the hepatic mitochondria of NAFLD and control mice using anti-Parkin and ant-PINK1 antibodies. H, Bar graphs of gel images from mitophagy markers assay. Data were normalized relative to HSP60. All values represent mean ± S.D. *p < 0.05, **p < 0.005 and ***p < 0.001.
Damaged mitochondria could also be removed by autophagy, and more specifically mitophagy. Although we failed to detect any significant changes in Beclin-1 and P62, markers of autophagy, we found a significant decrease in LC3-I but an increase in expression of LC3-II, LC3-II/LC3-I ratio, Atg5 and Atg7(Fig. 7E and 7F). Atg5 and Atg7 along with other proteins are involved in the elongation/enclosure step of autophagosome formation (42). During this process, the soluble LC3-I is released, which is then conjugated to phosphatidylethanolamine to form LC3-II. The lipidation of LC3-I to LC3-II is critical for the maturation of autophagosomes that facilitates their fusion with lysosomes and consequent autophagosome degradation. Therefore, increased LC3-II and the LC3-II/LC3-I ratio are believed to be reliable markers of autophagy (43). Even though static expressions of autophagy proteins do not represent autophagy flux, the Atg5, Atg7 and LC3-II/LC3-I results indicate increased cellular autophagy (44).
Furthermore, significant increases in the expression of mitochondrial kinase PINK1 and cytosolic E3 ubiquitin ligase Parkin were observed in NAFLD mice liver compared with that in controls (Fig. 7G and 7H). PINK1 and Parkin jointly regulate the quality control of mitochondria through mitophagy, the selective autophagy of mitochondria. In healthy mitochondria, PINK1 is rapidly degraded by the UPS via the canonical presequence-driven mitochondrial import pathway. In contrast, mitochondrial uncoupling-induced depolarization or the accumulation of misfolded proteins result in accumulation of PINK1 on the outer membrane where it recruits and phosphorylates Parkin. Activated Parkin conjugates outer membrane proteins with ubiquitin chains that primes mitochondria for recruitment to phagophores, a double membrane vesicle in which cargo is destined to degradation (45). Thus, increased expression of PINK1 and Parkin, mitophagy markers, suggests enhanced mitophagy in NAFLD mice liver.
Under physiological conditions, mitochondrial degradation is compensated by increased biogenesis. However, mitochondria are depleted if mitochondrial degradation is not balanced by increased biogenesis. Peroxisome proliferator-activated receptor γ co-activator 1α (PGC1α) is a master regulator of mitochondrial biogenesis. Although PGC1α lacks a DNA-binding site, it interacts with key transcriptional regulators, including nuclear respiratory factors 1 and 2 (NRF-1 and NRF-2) that can increase the expression of nuclear genes coding for OxPhos subunits. Mitochondrial transcription factor (TFAM), a downstream target of NRF-1 and NRF-2, is involved in activation of mtDNA (46). We quantified the expression of PGC1α and mitochondrial DNA (mtDNA) copy number as the markers of mitochondrial biogenesis. Both PGC1α protein expression (Fig. 8A) and mtDNA (Fig. 8B) were decreased in NAFLD mice livers suggesting decreased mitochondrial biogenesis. Collectively, these data suggest that reduced biogenesis and increased mitophagy contribute to the depletion of hepatic mitochondria in NAFLD mice.
Fig. 8.

Hepatic Mitochondrial biogenesis is impaired in NAFLD mice. A, Immunoblots and densitometry bar graphs of PGC1α expression in the liver from control and NAFLD mice. B, Mitochondrial DNA copy number relative to nuclear DNA was quantified in liver homogenate using qPCR of 12S, 16S, Mtnd1 (complex I), Mtcyb (complex III) and Mtco1 (complex IV) mitochondrial genes. 18S of the nuclear DNA was used as a control. Data represent mean ± S.D., n = 4/group, *p < 0.05 and **p < 0.005.
DISCUSSION
Mitochondrial dysfunction is believed to be a major underlining pathology in the development and progression of NAFLD (5). We used the 2H2O-metabolic labeling approach and biochemical methods to characterize hepatic mitochondrial proteome dynamics and function in a diet-induced mouse model of NAFLD. Our results show that the content of intact mitochondrial complexes, and ATP production are reduced in NAFLD mice liver. This was associated with an increased degradation of multiple mitochondrial proteins localized in the mitochondrial matrix and inner membrane but reduced degradation of outer-membrane proteins. A pathway analysis revealed enhanced degradation of proteins involved in ureagenesis and ATP production, but increased stability of proteins essential for the carnitine-mediated fatty acid shuttling into mitochondria. The functional characterization of OxPhos complexes showed specific defects in the ETC complex III and F0F1-ATP synthase, which were associated with increased degradation of individual subunits of these complexes. Finally, our results suggest that reduced mitochondrial biogenesis coupled with increased mitophagy, but not enhanced proteasomal degradation, contributed to depletion of mitochondrial proteins in NAFLD mice liver.
In this study we used LDLR−/− mice to examine the role of NAFLD on hepatic proteome dynamics. In contrast to wild-type mice, a high fat diet containing cholesterol (0.15% w/w) diet results in insulin resistance, steatosis, hepatic inflammation and mitochondrial dysfunction in LDLR−/− mice (47). Although the LDL receptor deficiency is very rare in humans, and in addition to NAFLD, these animals also develop other complications including atherosclerosis (33), this genetic model allows us to study diet-induced, NAFLD-associated impairments in hepatic mitochondria.
Consistent with the hepatic mitochondrial adaptation in NAFLD in response to increased fatty acid flux (5), the increased stability of carnitine shuttle proteins and mitochondrial trifunctional protein α observed in our study suggest stimulation of fatty acid oxidation in NAFLD mice. In contrast, the reduced stability of ETC proteins may reflect impaired coupling of fatty acid oxidation to the OxPhos system. Consistent with this interpretation, the enhanced stability of carnitine shuttle proteins was paralleled by reduced stability of OxPhos proteins. In contrast, we observed increased expression but unaltered degradation of MnSOD2 suggesting a compensatory enhanced production of this mitochondrial anti-oxidant enzyme. This is like previous reports showing that increased skeletal muscle mitochondrial ROS production following exercise and ammonia exposure induced MnSOD2 activity (48).
Coupled with TCA cycle and fatty acid oxidation, ETC and F0F1-ATP synthase complexes produce the majority of cellular ATP in the mitochondria of hepatocytes and other cells. Upon oxidation of NADH and FADH2, electrons are sequentially transferred through ETC complexes which generates a proton gradient in the inner membrane space. F0F1-ATP synthase drives the reentry of protons into the mitochondrial matrix to generate ATP (Fig. 9). Mitochondrial energy production depends on mitochondrial content, activities of mitochondrial enzymes, and efficiency of oxidative phosphorylation in synthesizing ATP. Our results show that increased degradation of individual subunits of CIII and CV proteins were associated with reduced content and activities of fully assembled CIII and CV, and ATP levels. Although further functional investigations are warranted, these changes combined with reduced CS activity and mtDNA content suggest that increased degradation of individual mitochondrial proteins resulted in overall depleted content and impaired function of mitochondria in the liver of NAFLD mice. Previous studies have reported that chronic over-nutrition in ob/ob mice results in the reduction in ETC activity and ATP synthesis that is associated with the defect in CI (10, 49). Changes in the energy metabolism in our diet-induced NAFLD in LDLR−/− mouse model is consistent with these studies. We, however, found that impairment in CV, but not in CI expression, contributed to mitochondrial dysfunction. Differences in the study models or oxidative modifications of CV subunits may be responsible for the differences observed in our study. As a major anabolic organ involved in gluconeogenesis, lipogenesis, ketogenesis, and protein synthesis, the liver relies on a constant production of ATP, and an abruption of energy metabolism also may alter the systemic metabolism through impaired supply of the substrates.
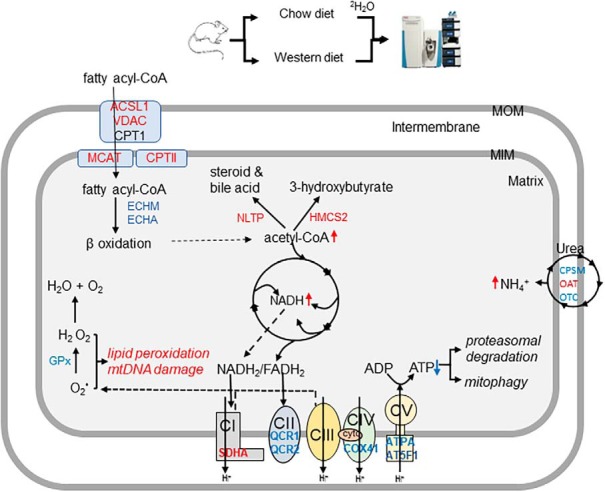
Fig. 9.

Potential consequences of altered hepatic mitochondrial proteome dynamics in NAFLD mice liver. After activation with ACSL1, long-chain fatty acids, including palmitate, are shuttled into mitochondrial matrix with the assistance of CPT1 and CPT2. Acyl-CoAs generated from fatty acid β-oxidation are then oxidized to acetyl-CoA which produces ketone bodies during fasting. The acetyl-CoA end-product of both fatty acid and pyruvate oxidation is further oxidized in the TCA cycle. NADH and FADH2 generated from mitochondrial fatty acid oxidation and TCA cycle are oxidized in ETC that transfers electrons to oxygen and produces water. The flow of electrons in the ETC is coupled to the pumping of protons (H+) from the matrix which generates the mitochondrial matrix potential (ΔΨm). These protons can reenter the matrix with the assistance of F0F1-ATP synthase, the process that produces ATP. Increased mitochondrial fatty acid oxidation results in excessive acetyl-CoA and NADH/FADH2 production overloading TCA cycle and ETC. Impaired ETC and F0F1-ATP synthase activities in NAFLD lead to the leakage of electrons and reactive oxygen species (ROS) generation, and impaired ATP production, respectively. Although some proteins can be degraded without ubiquitination by the ubiquitin proteasomal system (UPS), low levels of ATP may reduce proteasomal degradation of proteins but activate mitophagy. In addition to the energy production, mitochondrial proteins are involved in other metabolic pathways. Increased degradation of mitochondrial proteins of urea cycle enzymes may result in hyperammonemia-associated toxicity. ROS generated in the mitochondria may further damage mitochondrial DNA (mtDNA), lipids and proteins. Color code: red- proteins with increased half-life, light blue: proteins with decreased half-life. ACSL1: Long-chain-fatty-acid-CoA ligase 1; VDAC: Voltage-dependent anion channel protein; MCAT: Mitochondrial carnitine/acylcarnitine carrier protein; CPTI: Carnitine O-palmitoyltransferase 1, CPTII: Carnitine O-palmitoyltransferase 2; ECHM: Enoyl-CoA hydratase; MTPα: Trifunctional enzyme subunit alpha; GPX: glutathione peroxidase; IDHP: Isocitrate dehydrogenase [NADP]; SDHA: Succinate dehydrogenase; QCR1: Cytochrome b-c1 complex subunit 1; QCR2: Cytochrome b-c1 complex subunit 2; COX41: Cytochrome c oxidase subunit 4 isoform 1; ATPA: ATP synthase subunit α; AT5F1: ATP synthase F(0) complex subunit B1; CPS: Carbamoyl-phosphate synthase; OAT: Ornithine aminotransferase; OTC: Ornithine carbamoyltransferase. THIM: 3-ketoacyl-CoA thiolase; HMGCL: Hydroxymethylglutaryl-CoA lyase; HMCS2: Hydroxymethylglutaryl-CoA synthase, AMACR: Alpha-methylacyl-CoA racemase; CP27A: Sterol 26-hydroxylase; mtDNA: mitochondrial DNA.
In addition to alterations in proteins involved in energy metabolism, we also found increased degradation of urea cycle proteins that are localized in the hepatic mitochondria of NAFLD mice. Our observations are like a recent report of reduced expression of urea cycle enzymes that gradually worsens with progression to NASH with functional impairment of ureagenesis in a rat model of diet-induced NAFLD (50). Previously, even though we did not observe functional changes in ureagenesis in patients with NASH, intralipid infusion resulted in the significant reduction of ureagenesis, suggesting that increased fatty acid load in NASH may compromise the urea cycle activity (51). Consistently, results in the present study suggest that increased degradation of mitochondrial proteins of the urea cycle may contribute to diminished ureagenesis that may lead to ammonia-induced toxicity in NAFLD.
Although the mechanisms of increased degradation of hepatic mitochondrial proteins in NAFLD in mice require further investigations, our results suggest that enhanced autophagy/mitophagy but not proteasomal degradation contributed to reduced stability of hepatic mitochondrial proteins in NAFLD. In fact, we found that the activity of UPS was significantly reduced in NAFLD livers. These data are consistent with previous findings that the induction of autophagy is associated with decreased accumulation of ubiquitinated proteins (40). In addition, the biochemical detection of a mitophagy markers (PINK1 and Parkin), along with reduced mitochondria content (mtDNA and CS activity) suggest increased mitophagy in NAFLD mice liver. These data combined with reduced UPS activity suggest that the compensatory stimulation of mitophagy is involved in increased degradation of hepatic mitochondrial proteins in NAFLD mice. Similar induction of autophagy because of proteasomal inhibition has been reported in various physiological conditions (52, 53). Reduced hepatic proteasome function in obesity and genetic models of diabetes is well known (39), however, to the best of our knowledge this is the first report on impaired UPS activity in NAFLD liver. Although the mechanisms of impaired proteasome function is not clear, it is possible that a WD-induced hepatic oxidative stress is involved in oxidative PTMs of proteasome subunits that altered their functions. Reduced ATP availability in NAFLD mice liver could also result in activation of a feed-back loop that would reduce proteasomal degradation via inhibition of ATP-dependent ubiquitin-activating enzyme E1 involved in the conjugation of ubiquitin onto proteins, the first step of protein degradation in the ubiquitin-proteasome pathway (54). Consequently, inhibition of UPS would induce accumulation of unfolded proteins involved in ER stress that activates autophagy (55) (Fig. 9). Although we cannot exclude other mechanisms for cross-talk between the UPS and autophagy pathways, this conclusion is also consistent with the critical role of ER stress-induced autophagy in liver fibrosis that characterizes the severe form of NAFLD (56).
This discovery-based in vivo dynamic proteomics study has limitations related to the mitochondrial functional assays and the role of mitophagy in depletion of hepatic mitochondria in NAFLD mice. Although this study assessed mitochondrial defects via the measurement of expression and enzymatic activities of fully assembled complexes, mitochondrial respiration based on oxygen consumption were not quantified. Because the respiratory measurements require fresh mitochondria samples and oxygen sensor-based methods, we used spectrophotometric assays to determine mitochondrial integrity and respiratory chain enzymatic activities using frozen mitochondria samples. Future studies involving mitochondrial respiration with different substrates and specific inhibitors may determine the specific functional consequences of altered turnover of mitochondrial proteins. Even though our observations suggest a role for mitophagy in increased degradation of mitochondrial proteins in NAFLD mice liver, future studies are required to study the autophagy flux in vivo and the mechanisms of enhanced oxidative stress and reduced stability of mitochondrial proteins in NAFLD mice liver.
In conclusion, consistent with increased hepatic fatty acid oxidation in NAFLD, the stability of proteins involved in mitochondrial fatty acid shuttling and oxidation are increased in the livers of the NAFLD mice. In contrast, over-nutrition resulted in increased degradation of ETC and F0F1-ATP synthase subunits that were associated with the decreased content of these complexes in NAFLD liver. These results suggest that increased degradation of mitochondrial proteins contributes to hepatic mitochondrial defects in NAFLD.
DATA AVAILABILITY
All raw data associated with this manuscript have been deposited to the ProteomeXchange Consortium via the PRIDE partner repository with the ProteomeXchange (accession number: PXD008766).
Supplementary Material
Acknowledgments
We thank Drs. Vernon E. Anderson and Stephen Previs, for their insight and efforts in developing early stages of our proteome dynamic studies. We are also grateful to Drs. Denise Inman and Charles Hoppel for the fruitful discussions.
Footnotes
* This work was supported in parts by National Institute of Health grants 5R01GM112044-02, 1RO1HL129120-01A1 and 1R21 AG049461. S.D. was partially supported by grants NIH RO1 GM119174; P50 AA024333; R21 AR 71046; UO1 AA0026976; UO1 DK 061732; RO1 DK113196 and the Mikati Family Foundation.
 This article contains supplemental material.
1 The abbreviations used are:
- NAFLD
- nonalcoholic fatty liver disease
- ALT
- alanine aminotransferase
- AST
- aspartate aminotransferase
- ATPA
- ATP synthase subunit α
- AT5F1
- ATP synthase F(0) complex subunit B1
- BN-PAGE
- blue native polyacrylamide gel electrophoresis
- CPS
- carbamoyl-phosphate synthase
- CPT1
- carnitine O-palmitoyltransferase 1
- CS
- citrate synthase
- COX
- cytochrome c oxidase
- COX41
- cytochrome c oxidase subunit 4 isoform 1
- CY1
- Cytochrome c1
- ETC
- electron transport chain
- FCR
- fractional catabolic rate
- FSR
- fractional synthesis rate
- GC-MS
- gas chromatography mass spectrometry
- HCD
- higher-energy collisional dissociation
- LC-MS/MS
- liquid chromatography-tandem mass spectrometry
- MIM
- mitochondrial inner membrane
- MOM
- mitochondrial outer membrane
- NASH
- nonalcoholic steatohepatitis
- OTC
- ornithine carbamoyltransferase
- OxPhos
- oxidative phosphorylation
- PGC1
- peroxisome proliferator-activated receptor γ co-activator 1α
- PTM
- post-translational modification
- PDH
- pyruvate dehydrogenase
- SDH
- succinate dehydrogenase
- SDS-PAGE
- sodium dodecyl sulfate polyacrylamide gel electrophoresis
- TBARS
- thiobarbituric acid reactive substances
- TFA
- trifluoroacetic acid
- TCA
- tricarboxylic acid
- UPS
- ubiquitin proteasome system
- WD
- Western diet.
REFERENCES
- 1. Caldwell S. H., Swerdlow R. H., Khan E. M., Iezzoni J. C., Hespenheide E. E., Parks J. K., and Parker W. D. Jr. (1999) Mitochondrial abnormalities in non-alcoholic steatohepatitis. J. Hepatol. 31, 430–434 [DOI] [PubMed] [Google Scholar]
- 2. Sanyal A. J., Campbell-Sargent C., Mirshahi F., Rizzo W. B., Contos M. J., Sterling R. K., Luketic V. A., Shiffman M. L., and Clore J. N. (2001) Nonalcoholic steatohepatitis: association of insulin resistance and mitochondrial abnormalities. Gastroenterology 120, 1183–1192 [DOI] [PubMed] [Google Scholar]
- 3. Portincasa P., Grattagliano I., Lauterburg B. H., Palmieri V. O., Palasciano G., and Stellaard F. (2006) Liver breath tests non-invasively predict higher stages of non-alcoholic steatohepatitis. Clin. Sci. 111, 135–143 [DOI] [PubMed] [Google Scholar]
- 4. Banasch M., Ellrichmann M., Tannapfel A., Schmidt W. E., and Goetze O. (2011) The non-invasive (13)C-methionine breath test detects hepatic mitochondrial dysfunction as a marker of disease activity in non-alcoholic steatohepatitis. Eur. J. Med. Res. 16, 258–264 [DOI] [PMC free article] [PubMed] [Google Scholar]
- 5. Koliaki C., Szendroedi J., Kaul K., Jelenik T., Nowotny P., Jankowiak F., Herder C., Carstensen M., Krausch M., Knoefel W. T., Schlensak M., and Roden M. (2015) Adaptation of hepatic mitochondrial function in humans with non-alcoholic fatty liver is lost in steatohepatitis. Cell Metab. 21, 739–746 [DOI] [PubMed] [Google Scholar]
- 6. Perez-Carreras M., Del Hoyo P., Martin M. A., Rubio J. C., Martin A., Castellano G., Colina F., Arenas J., and Solis-Herruzo J. A. (2003) Defective hepatic mitochondrial respiratory chain in patients with nonalcoholic steatohepatitis. Hepatology 38, 999–1007 [DOI] [PubMed] [Google Scholar]
- 7. Cortez-Pinto H., Chatham J., Chacko V. P., Arnold C., Rashid A., and Diehl A. M. (1999) Alterations in liver ATP homeostasis in human nonalcoholic steatohepatitis: a pilot study. JAMA 282, 1659–1664 [DOI] [PubMed] [Google Scholar]
- 8. Nair S., V P. C., Arnold C., and Diehl A. M. (2003) Hepatic ATP reserve and efficiency of replenishing: comparison between obese and nonobese normal individuals. Am. J. Gastroenterol. 98, 466–470 [DOI] [PubMed] [Google Scholar]
- 9. Begriche K., Massart J., Robin M. A., Bonnet F., and Fromenty B. (2013) Mitochondrial adaptations and dysfunctions in nonalcoholic fatty liver disease. Hepatology 58, 1497–1507 [DOI] [PubMed] [Google Scholar]
- 10. Garcia-Ruiz I., Fernandez-Moreira D., Solis-Munoz P., Rodriguez-Juan C., Diaz-Sanjuan T., Munoz-Yague T., and Solis-Herruzo J. A. (2010) Mitochondrial complex I subunits are decreased in murine nonalcoholic fatty liver disease: implication of peroxynitrite. J. Proteome Res. 9, 2450–2459 [DOI] [PubMed] [Google Scholar]
- 11. Bell L. N., Theodorakis J. L., Vuppalanchi R., Saxena R., Bemis K. G., Wang M., and Chalasani N. (2010) Serum proteomics and biomarker discovery across the spectrum of nonalcoholic fatty liver disease. Hepatology 51, 111–120 [DOI] [PMC free article] [PubMed] [Google Scholar]
- 12. Sarsby J., Martin N. J., Lalor P. F., Bunch J., and Cooper H. J. (2014) Top-down and bottom-up identification of proteins by liquid extraction surface analysis mass spectrometry of healthy and diseased human liver tissue. J. Am. Soc. Mass Spectrom. 25, 1953–1961 [DOI] [PMC free article] [PubMed] [Google Scholar]
- 13. Younossi Z. M., Baranova A., Stepanova M., Page S., Calvert V. S., Afendy A., Goodman Z., Chandhoke V., Liotta L., and Petricoin E. (2010) Phosphoproteomic biomarkers predicting histologic nonalcoholic steatohepatitis and fibrosis. J. Proteome Res. 9, 3218–3224 [DOI] [PubMed] [Google Scholar]
- 14. Wattacheril J., Rose K. L., Hill S., Lanciault C., Murray C. R., Washington K., Williams B., English W., Spann M., Clements R., Abumrad N., and Flynn C. R. (2017) Non-alcoholic fatty liver disease phosphoproteomics: A functional piece of the precision puzzle. Hepatol. Res. 47, 1469–1483 [DOI] [PMC free article] [PubMed] [Google Scholar]
- 15. Kasumov T., Ilchenko S., Li L., Rachdaoui N., Sadygov R. G., Willard B., McCullough A. J., and Previs S. (2011) Measuring protein synthesis using metabolic (2)H labeling, high-resolution mass spectrometry, and an algorithm. Anal. Biochem. 412, 47–55 [DOI] [PMC free article] [PubMed] [Google Scholar]
- 16. Li L., Willard B., Rachdaoui N., Kirwan J. P., Sadygov R. G., Stanley W. C., Previs S., McCullough A. J., and Kasumov T. (2012) Plasma proteome dynamics: analysis of lipoproteins and acute phase response proteins with 2H2O metabolic labeling. Mol. Cell Proteomics 11, M111.014209. [DOI] [PMC free article] [PubMed] [Google Scholar]
- 17. Kasumov T., Dabkowski E. R., Shekar K. C., Li L., Ribeiro R. F. Jr, Walsh K., Previs S. F., Sadygov R. G., Willard B., and Stanley W. C. (2013) Assessment of cardiac proteome dynamics with heavy water: slower protein synthesis rates in interfibrillar than subsarcolemmal mitochondria. Am. J. Physiol. Heart Circ. Physiol. 304, H1201–H1214 [DOI] [PMC free article] [PubMed] [Google Scholar]
- 18. Price J. C., Holmes W. E., Li K. W., Floreani N. A., Neese R. A., Turner S. M., and Hellerstein M. K. (2012) Measurement of human plasma proteome dynamics with (2)H(2)O and liquid chromatography tandem mass spectrometry. Anal. Biochem. 420, 73–83 [DOI] [PubMed] [Google Scholar]
- 19. Lam M. P., Wang D., Lau E., Liem D. A., Kim A. K., Ng D. C., Liang X., Bleakley B. J., Liu C., Tabaraki J. D., Cadeiras M., Wang Y., Deng M. C., and Ping P. (2014) Protein kinetic signatures of the remodeling heart following isoproterenol stimulation. J. Clin. Invest. 124, 1734–1744 [DOI] [PMC free article] [PubMed] [Google Scholar]
- 20. Rahman M., Previs S. F., Kasumov T., and Sadygov R. G. (2016) Gaussian Process Modeling of Protein Turnover. J. Proteome Res. 15, 2115–2122 [DOI] [PMC free article] [PubMed] [Google Scholar]
- 21. Sadygov R. G., Avva J., Rahman M., Lee K., Ilchenko S., Kasumov T., and Borzou A. (2018) d2ome, Software for in vivo Protein Turnover Analysis using Heavy Water Labeling and LC-MS, Reveals Alterations of Hepatic Proteome Dynamics in a Mouse Model of NAFLD. J. Proteome Res. submitted [DOI] [PMC free article] [PubMed] [Google Scholar]
- 22. Li L., Bebek G., Previs S. F., Smith J. D., Sadygov R. G., McCullough A. J., Willard B., and Kasumov T. (2016) Proteome Dynamics Reveals Pro-Inflammatory Remodeling of Plasma Proteome in a Mouse Model of NAFLD. J. Proteome Res. 15, 3388–3404 [DOI] [PMC free article] [PubMed] [Google Scholar]
- 23. Fernandez C. A., Des Rosiers C., Previs S. F., David F., and Brunengraber H. (1996) Correction of 13C mass isotopomer distributions for natural stable isotope abundance. J. Mass Spectrom 31, 255–262 [DOI] [PubMed] [Google Scholar]
- 24. Kleiner D. E., Brunt E. M., Van Natta M., Behling C., Contos M. J., Cummings O. W., Ferrell L. D., Liu Y. C., Torbenson M. S., Unalp-Arida A., Yeh M., McCullough A. J., Sanyal A. J., and Nonalcoholic Steatohepatitis Clinical Research, N. (2005) Design and validation of a histological scoring system for nonalcoholic fatty liver disease. Hepatology 41, 1313–1321 [DOI] [PubMed] [Google Scholar]
- 25. Rooney J. P., Ryde I. T., Sanders L. H., Howlett E. H., Colton M. D., Germ K. E., Mayer G. D., Greenamyre J. T., and Meyer J. N. (2015) PCR based determination of mitochondrial DNA copy number in multiple species. Methods Mol. Biol. 1241, 23–38 [DOI] [PMC free article] [PubMed] [Google Scholar]
- 26. Lee K., Kerner J., and Hoppel C. L. (2011) Mitochondrial carnitine palmitoyltransferase 1a (CPT1a) is part of an outer membrane fatty acid transfer complex. J. Biol. Chem. 286, 25655–25662 [DOI] [PMC free article] [PubMed] [Google Scholar]
- 27. Frezza C., Cipolat S., and Scorrano L. (2007) Organelle isolation: functional mitochondria from mouse liver, muscle and cultured fibroblasts. Nat. Protoc. 2, 287–295 [DOI] [PubMed] [Google Scholar]
- 28. Zhang J., Li X., Mueller M., Wang Y., Zong C., Deng N., Vondriska T. M., Liem D. A., Yang J. I., Korge P., Honda H., Weiss J. N., Apweiler R., and Ping P. (2008) Systematic characterization of the murine mitochondrial proteome using functionally validated cardiac mitochondria. Proteomics 8, 1564–1575 [DOI] [PMC free article] [PubMed] [Google Scholar]
- 29. Calvo S. E., Clauser K. R., and Mootha V. K. (2016) MitoCarta2.0: an updated inventory of mammalian mitochondrial proteins. Nucleic Acids Res. 44, D1251–D1257 [DOI] [PMC free article] [PubMed] [Google Scholar]
- 30. Rachdaoui N., Austin L., Kramer E., Previs M. J., Anderson V. E., Kasumov T., and Previs S. F. (2009) Measuring proteome dynamics in vivo: as easy as adding water? Mol. Cell Proteomics 8, 2653–2663 [DOI] [PMC free article] [PubMed] [Google Scholar]
- 31. Yan L. J., and Forster M. J. (2009) Resolving mitochondrial protein complexes using nongradient blue native polyacrylamide gel electrophoresis. Anal. Biochem. 389, 143–149 [DOI] [PMC free article] [PubMed] [Google Scholar]
- 32. Cui Z., Gilda J. E., and Gomes A. V. (2014) Crude and purified proteasome activity assays are affected by type of microplate. Anal. Biochem. 446, 44–52 [DOI] [PMC free article] [PubMed] [Google Scholar]
- 33. Kasumov T., Li L., Li M., Gulshan K., Kirwan J. P., Liu X., Previs S., Willard B., Smith J. D., and McCullough A. (2015) Ceramide as a mediator of non-alcoholic Fatty liver disease and associated atherosclerosis. PLoS ONE 10, e0126910. [DOI] [PMC free article] [PubMed] [Google Scholar]
- 34. Kim T. Y., Wang D., Kim A. K., Lau E., Lin A. J., Liem D. A., Zhang J., Zong N. C., Lam M. P., and Ping P. (2012) Metabolic labeling reveals proteome dynamics of mouse mitochondria. Mol. Cell Proteomics 11, 1586–1594 [DOI] [PMC free article] [PubMed] [Google Scholar]
- 35. Andringa K. K., King A. L., Eccleston H. B., Mantena S. K., Landar A., Jhala N. C., Dickinson D. A., Squadrito G. L., and Bailey S. M. (2010) Analysis of the liver mitochondrial proteome in response to ethanol and S-adenosylmethionine treatments: novel molecular targets of disease and hepatoprotection. Am. J. Physiol. Gastrointest. Liver Physiol. 298, G732–745 [DOI] [PMC free article] [PubMed] [Google Scholar]
- 36. Distler A. M., Kerner J., Peterman S. M., and Hoppel C. L. (2006) A targeted proteomic approach for the analysis of rat liver mitochondrial outer membrane proteins with extensive sequence coverage. Anal. Biochem. 356, 18–29 [DOI] [PubMed] [Google Scholar]
- 37. Jahngen J. H., Lipman R. D., Eisenhauer D. A., Jahngen E. G. Jr, and Taylor A. (1990) Aging and cellular maturation cause changes in ubiquitin-eye lens protein conjugates. Arch. Biochem. Biophys. 276, 32–37 [DOI] [PubMed] [Google Scholar]
- 38. Dudek E. J., Lampi K. J., Lampi J. A., Shang F., King J., Wang Y., and Taylor A. (2010) Ubiquitin proteasome pathway-mediated degradation of proteins: effects due to site-specific substrate deamidation. Invest. Ophthalmol. Vis. Sci. 51, 4164–4173 [DOI] [PMC free article] [PubMed] [Google Scholar]
- 39. Otoda T., Takamura T., Misu H., Ota T., Murata S., Hayashi H., Takayama H., Kikuchi A., Kanamori T., Shima K. R., Lan F., Takeda T., Kurita S., Ishikura K., Kita Y., Iwayama K., Kato K., Uno M., Takeshita Y., Yamamoto M., Tokuyama K., Iseki S., Tanaka K., and Kaneko S. (2013) Proteasome dysfunction mediates obesity-induced endoplasmic reticulum stress and insulin resistance in the liver. Diabetes 62, 811–824 [DOI] [PMC free article] [PubMed] [Google Scholar]
- 40. Hara T., Nakamura K., Matsui M., Yamamoto A., Nakahara Y., Suzuki-Migishima R., Yokoyama M., Mishima K., Saito I., Okano H., and Mizushima N. (2006) Suppression of basal autophagy in neural cells causes neurodegenerative disease in mice. Nature 441, 885–889 [DOI] [PubMed] [Google Scholar]
- 41. Meng L., Mohan R., Kwok B. H., Elofsson M., Sin N., and Crews C. M. (1999) Epoxomicin, a potent and selective proteasome inhibitor, exhibits in vivo antiinflammatory activity. Proc. Natl. Acad. Sci. U.S.A. 96, 10403–10408 [DOI] [PMC free article] [PubMed] [Google Scholar]
- 42. Mizushima N., Yoshimori T., and Ohsumi Y. (2011) The role of Atg proteins in autophagosome formation. Annu. Rev. Cell Dev. Biol. 27, 107–132 [DOI] [PubMed] [Google Scholar]
- 43. Madrigal-Matute J., and Cuervo A. M. (2016) Regulation of Liver Metabolism by Autophagy. Gastroenterology 150, 328–339 [DOI] [PMC free article] [PubMed] [Google Scholar]
- 44. Tanida I., Ueno T., and Kominami E. (2004) LC3 conjugation system in mammalian autophagy. Int. J. Biochem. Cell Biol. 36, 2503–2518 [DOI] [PMC free article] [PubMed] [Google Scholar]
- 45. Harper J. W., Ordureau A., and Heo J. M. (2018) Building and decoding ubiquitin chains for mitophagy. Nat. Rev. Mol. Cell Biol. 19, 93–108 [DOI] [PubMed] [Google Scholar]
- 46. Shi Y., Dierckx A., Wanrooij P. H., Wanrooij S., Larsson N. G., Wilhelmsson L. M., Falkenberg M., and Gustafsson C. M. (2012) Mammalian transcription factor A is a core component of the mitochondrial transcription machinery. Proc. Natl. Acad. Sci. U.S.A. 109, 16510–16515 [DOI] [PMC free article] [PubMed] [Google Scholar]
- 47. Bieghs V., Van Gorp P. J., Wouters K., Hendrikx T., Gijbels M. J., van Bilsen M., Bakker J., Binder C. J., Lutjohann D., Staels B., Hofker M. H., and Shiri-Sverdlov R. (2012) LDL receptor knock-out mice are a physiological model particularly vulnerable to study the onset of inflammation in non-alcoholic fatty liver disease. Plos One 7, e30668. [DOI] [PMC free article] [PubMed] [Google Scholar]
- 48. Davuluri G., Allawy A., Thapaliya S., Rennison J. H., Singh D., Kumar A., Sandlers Y., Van Wagoner D. R., Flask C. A., Hoppel C., Kasumov T., and Dasarathy S. (2016) Hyperammonaemia-induced skeletal muscle mitochondrial dysfunction results in cataplerosis and oxidative stress. J. Physiol. 594, 7341–7360 [DOI] [PMC free article] [PubMed] [Google Scholar]
- 49. Petrosillo G., Portincasa P., Grattagliano I., Casanova G., Matera M., Ruggiero F. M., Ferri D., and Paradies G. (2007) Mitochondrial dysfunction in rat with nonalcoholic fatty liver Involvement of complex I, reactive oxygen species and cardiolipin. Biochim. Biophys. Acta 1767, 1260–1267 [DOI] [PubMed] [Google Scholar]
- 50. Thomsen K. L., Gronbaek H., Glavind E., Hebbard L., Jessen N., Clouston A., George J., and Vilstrup H. (2014) Experimental nonalcoholic steatohepatitis compromises ureagenesis, an essential hepatic metabolic function. Am. J. Physiol. Gastrointest. Liver Physiol. 307, G295–G301 [DOI] [PubMed] [Google Scholar]
- 51. Dasarathy S., Kasumov T., Edmison J. M., Gruca L. L., Bennett C., Duenas C., Marczewski S., McCullough A. J., Hanson R. W., and Kalhan S. C. (2009) Glycine and urea kinetics in nonalcoholic steatohepatitis in human: effect of intralipid infusion. Am. J. Physiol. Gastrointest. Liver Physiol. 297, G567–G575 [DOI] [PMC free article] [PubMed] [Google Scholar]
- 52. Pandey U. B., Nie Z., Batlevi Y., McCray B. A., Ritson G. P., Nedelsky N. B., Schwartz S. L., DiProspero N. A., Knight M. A., Schuldiner O., Padmanabhan R., Hild M., Berry D. L., Garza D., Hubbert C. C., Yao T. P., Baehrecke E. H., and Taylor J. P. (2007) HDAC6 rescues neurodegeneration and provides an essential link between autophagy and the UPS. Nature 447, 859–863 [DOI] [PubMed] [Google Scholar]
- 53. Wang X. J., Yu J., Wong S. H., Cheng A. S., Chan F. K., Ng S. S., Cho C. H., Sung J. J., and Wu W. K. (2013) A novel crosstalk between two major protein degradation systems: regulation of proteasomal activity by autophagy. Autophagy 9, 1500–1508 [DOI] [PubMed] [Google Scholar]
- 54. Haas A. L., and Rose I. A. (1982) The mechanism of ubiquitin activating enzyme. A kinetic and equilibrium analysis. J. Biol. Chem. 257, 10329–10337 [PubMed] [Google Scholar]
- 55. Ogata M., Hino S., Saito A., Morikawa K., Kondo S., Kanemoto S., Murakami T., Taniguchi M., Tanii I., Yoshinaga K., Shiosaka S., Hammarback J. A., Urano F., and Imaizumi K. (2006) Autophagy is activated for cell survival after endoplasmic reticulum stress. Mol. Cell Biol. 26, 9220–9231 [DOI] [PMC free article] [PubMed] [Google Scholar]
- 56. Kim R. S., Hasegawa D., Goossens N., Tsuchida T., Athwal V., Sun X., Robinson C. L., Bhattacharya D., Chou H. I., Zhang D. Y., Fuchs B. C., Lee Y., Hoshida Y., and Friedman S. L. (2016) The XBP1 Arm of the Unfolded Protein Response Induces Fibrogenic Activity in Hepatic Stellate Cells Through Autophagy. Sci. Rep. 6, 39342. [DOI] [PMC free article] [PubMed] [Google Scholar]
Associated Data
This section collects any data citations, data availability statements, or supplementary materials included in this article.
Supplementary Materials
Data Availability Statement
All raw data associated with this manuscript have been deposited to the ProteomeXchange Consortium via the PRIDE partner repository with the ProteomeXchange (accession number: PXD008766).