Abstract
Purpose
To compare the diagnostic accuracy of gallium 68 (68Ga)–labeled prostate-specific membrane antigen (PSMA)–11 PET/MRI with that of multiparametric MRI in the detection of prostate cancer.
Materials and Methods
The authors performed a retrospective study of men with biopsy-proven prostate cancer who underwent simultaneous 68Ga-PSMA-11 PET/MRI before radical prostatectomy between December 2015 and June 2017. The reference standard was whole-mount pathologic examination. Readers were blinded to radiologic and pathologic findings. Tumor localization was based on 30 anatomic regions. Region-specific sensitivity and specificity were calculated for PET/MRI and multiparametric MRI by using raw stringent and alternative neighboring approaches. Maximum standardized uptake value (SUVmax) in the tumor and Prostate Imaging Reporting and Data System (PI-RADS) version 2 grade were compared with tumor Gleason score. Generalized estimating equations were used to estimate population-averaged sensitivity and specificity and to determine the association between tumor characteristics and SUVmax or PI-RADS score.
Results
Thirty-two men (median age, 68 years; interquartile range: 62–71 years) were imaged. The region-specific sensitivities of PET/MRI and multiparametric MRI were 74% (95% confidence interval [CI]: 70%, 77%) and 50% (95% CI: 45%, 0.54%), respectively, with the alternative neighboring approach (P < .001 for both) and 73% (95% CI: 68%, 79%) and 69% (95% CI: 62%, 75%), respectively, with the population-averaged generalized estimating equation (P = .04). Region-specific specificity of PET/MRI was similar to that of multiparametric MRI with the alternative neighboring approach (88% [95% CI: 85%, 91%] vs 90% [95% CI: 87%, 92%], P = .99) and in population-averaged estimates (70% [95% CI: 64%, 76%] vs 70% [95% CI: 64%, 75%], P = .99). SUVmax was associated with a Gleason score of 7 and higher (odds ratio: 1.71 [95% CI: 1.27, 2.31], P < .001).
Conclusion
The sensitivity of gallium 68–labeled prostate-specific membrane antigen–11 PET/MRI in the detection of prostate cancer is better than that of multiparametric MRI.
© RSNA, 2018
See also the editorial by Civelek in this issue.
Summary
Gallium 68–labeled prostate-specific membrane antigen–11 PET improves sensitivity for the detection of prostate cancer with a similar specificity to that with multiparametric prostate MRI.
Implications for Patient Care
■ Prostate-specific membrane antigen PET helps detect higher rates of clinically significant cancer in men compared with multiparametric MRI.
■ Prostate-specific membrane antigen PET could serve as a tool to both characterize local disease within the prostate and evaluate for metastasis with a single examination.
Introduction
Prostate cancer is the third most commonly diagnosed cancer in the United States, with metastatic disease present in approximately 17% of patients at initial staging (1). While screening for prostate cancer remains controversial, diagnosis is traditionally prompted by elevated serum prostate-specific antigen level followed by systematic transrectal US–guided biopsy. Yet, the diagnostic accuracy of this approach is suboptimal (2,3). Multiparametric MRI has been shown to address this limitation and is now recommended for assessing men suspected of having prostate cancer but with negative results at transrectal US–guided biopsy (4). However, the sensitivity for the detection of transition zone tumors is limited, and the use of the Prostate Imaging Reporting and Data System (PI-RADS), version 2, provides only moderately reproducible imaging scores for detecting clinically relevant disease (5,6).
Molecular imaging of prostate cancer can enable whole-body evaluation of tumor biology. Agents that target cell metabolism, hormone receptors, and membrane proteins have been developed. Prostate-specific membrane antigen (PSMA) is a transmembrane glycoprotein associated with tumor progression and disease recurrence that is overexpressed in prostate cancer cells (7,8). Gallium 68 (68Ga)–labeled PSMA-11 has shown improved diagnostic accuracy for the detection of recurrent disease compared with cross-sectional imaging alone and PET radiotracers including fluorine 18 fluorocholine and carbon 11 choline (9–13). To provide anatomic localization of PSMA-avid foci, PET images are typically coregistered with CT scans owing to widespread availability and ease of acquisition. Preliminary studies of 68Ga-PSMA-11 PET/CT have demonstrated promising detection rates of intraprostatic tumor, with sensitivities ranging from 67% to 97%, and with elevated maximum standardized uptake value (SUVmax) in malignant compared with benign intraprostatic tissue (14–18). To our knowledge, a standardized tool has not yet been developed for reporting intraprostatic tumor with PSMA imaging. MRI offers several advantages over CT, including superior soft-tissue resolution and the absence of radiation exposure.
A single study investigating the diagnostic accuracy of 68Ga-PSMA PET/MRI showed that simultaneous interpretation of PET and multiparametric MRI sequences improved cancer localization compared with either modality interpreted alone (19). If cancer detection rates with 68Ga-PSMA PET can meet current clinical standards, this modality could potentially serve as a tool to both characterize local disease within the prostate and evaluate for metastasis with a single examination.
The purpose of our study was to evaluate the diagnostic accuracy of independent 68Ga-PSMA PET/MRI interpretation compared with multiparametric MRI for the detection of primary prostate cancer, using whole-mount explant histologic correlation as the reference standard. We hypothesized that 68Ga-PSMA-11 PET/MRI would have a high sensitivity and specificity for intraprostatic tumor.
Materials and Methods
Study Population
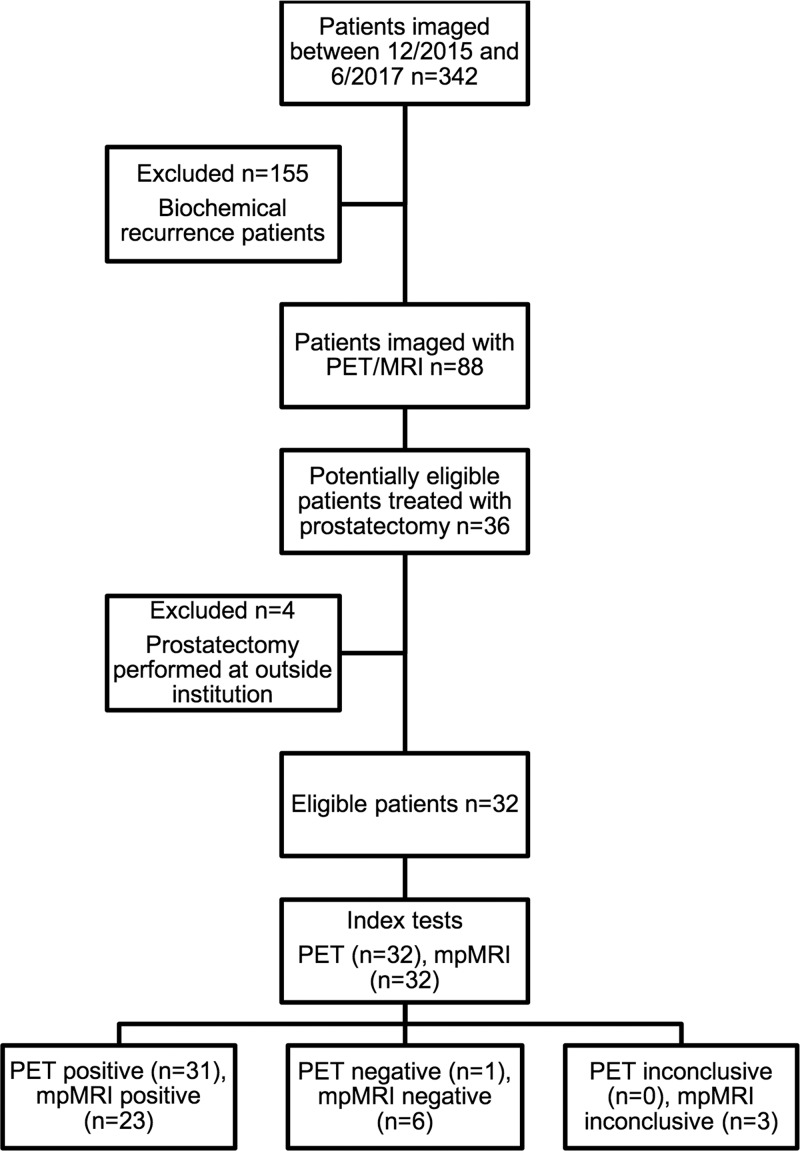
The local institutional review board approved our retrospective, Health Insurance Portability and Accountability Act–compliant study. The authors had full control of all data and information submitted for publication, and the study was not industry funded. Study participants had previously undergone PET in one of two institutional review board–approved research protocols (clinicaltrials.gov identification numbers NCT02611882 and NCT02919111) between December 2015 and June 2017. Written informed consent was obtained from all study participants in those protocols. Patients included for analysis were imaged with PET/MRI and underwent subsequent radical prostatectomy. Patients were excluded if prostatectomy was performed at another institution and their pathologic specimens were not available to review. Figure 1 shows the study flowchart.
Figure 1:
Patient flowchart. PET = gallium 68–labeled prostate-specific membrane antigen PET, mpMRI = multiparametric MRI.
68Ga-PSMA-11 PET/MRI
68Ga-PSMA-11 was synthesized and administered according to previously reported methods (20,21). Patients were imaged a mean (± standard deviation) of 71 minutes ± 14 after intravenous injection of a mean of 210.9 MBq ± 44.4 (5.7 mCi ± 1.2) 68Ga-PSMA-11. Twenty-nine patients received intravenous administration of 20-mg furosemide within a mean of 27 minutes ± 23 of radionucleotide injection to minimize halo artifact caused by scatter overcorrection associated with high renal and urinary tracer activity (15).
Imaging was performed with a 3.0-T time-of-flight PET/MRI unit (Signa; GE Healthcare, Waukesha, Wis). Acquisition was split into two components. First, a dedicated 15-minute acquisition of the pelvis was performed and PET data were reconstructed by using time-of-flight, ordered-subsets expectation maximization with two iterations, 28 subsets, and a 256 × 256 matrix. PET transaxial and z-axis fields of view were 600 and 250 mm, respectively, and axial sections were reconstructed with 2.8-mm-thick sections. Attenuation was corrected by using a standard two-point Dixon acquisition converted into an attenuation map as previously described (22). No endorectal coil was used. The following MRI sequences were performed in the pelvis: (a) diffusion-weighted imaging (FOCUS; GE Healthcare) (section thickness, 6 mm; 24 sections; field of view, 300 × 150 mm; percentage phase field of view, 50%; flip angle, 90°; matrix, 180 × 50; repetition time msec/echo time msec, 2000/95.6; b = 0 sec/mm2 with two signals acquired; and b = 1350 sec/mm2 with 16 signals acquired); (b) T2-weighted three-dimensional fast spin-echo imaging (CUBE; GE Healthcare) (section thickness, 2 mm; 144 sections; field of view, 180 × 180 mm; flip angle, 90°; matrix, 256 × 240; 2400/131 (effective); echo train length, 100); and (c) dynamic contrast material–enhanced T1-weighted imaging (DISCO, or Dixon-based differential subsampling with Cartesian ordering) (23) (section thickness, 2 mm; 76 sections; field of view, 380 × 310 mm; flip angle, 15°; matrix, 320 × 224; 5.6/2.0, 4.1; number of signals acquired, 0.7; and parallel imaging acceleration factors of 2 (phase direction) × 2.5 (section direction). Following a single dose (0.1 mmol/kg) of gadobutrol (Gadavist; Bayer Healthcare, Berlin, Germany), 40 phases were acquired sequentially with a temporal resolution of 5–11 seconds, with delays added at later time points.
Subsequently, whole-body PET/MRI was performed, which included 3 minutes of PET acquisition at each bed position reconstructed identically to the pelvis acquisition. Axial LAVA-FLEX (GE Healthcare) and variable refocusing flip angle, single-shot, fast spin-echo images were acquired at each bed position in the axial and coronal planes (24). Imaging parameters are summarized in Table 1.
Table 1:
Imaging Parameters for 68Ga-PSMA-11 PET and Multiparametric MRI

Note.—DCE = dynamic contrast enhancement, DISCO = Dixon-based differential subsampling with Cartesian ordering, DWI = diffusion-weighted imaging, FOV = field of view, FSE = fast spin echo, 68Ga = gallium 68, PSMA = prostate-specific membrane antigen, TE = echo time, 3D = three-dimensional, TR = repetition time.
*Data are means ± standard deviation.
†b values = 600 and 1350 sec/mm2.
Prostate Tumor Localization
One physician with dual board certifications in radiology and nuclear medicine (T.A.H., with 6 years of experience) interpreted all 68Ga-PSMA-11 PET/MRI images using a commercial workstation (Advantage, version 5.0; GE Healthcare). Precontrast T1-weighted images were used for anatomic correlation. All multiparametric MR images were interpreted by one board-certified radiologist (A.C.W., with 15 years of experience in prostate MRI) using a commercial workstation (DynaCAD; InVivo, Gainesville, Fla) while blinded to PET images. Both interpreters reviewed all imaging studies in a single session and were blinded to all clinical and pathologic data, with the exception of knowledge that patients had biopsy-proven prostate cancer.
Lesions seen at PET/MRI were characterized as positive if there was uptake higher than that in adjacent background and uptake could not be attributed to physiologic radiotracer biodistribution. Quantitative measurements of the single-pixel SUVmax were normalized to the patient’s body weight. SUVmax was measured within a volume of interest, and mean background standardized uptake value was calculated by using the average of two identical 1-cm3 volumes of interest placed by tracing each image section to exclude any nearby high tracer activity, one located within the prostate apex and the other within the base. The multiparametric MR images were interpreted according to the revised PI-RADS version 2 (25), with lesions scored as PI-RADS 3 or higher characterized as positive.
Readers localized tumor by dividing the prostate into 30 anatomic regions as previously described (26). Briefly, the prostate was divided into five axial levels in the craniocaudal plane (apex, apex-midgland, midgland, midgland to base, and base), with six regions (four peripheral zone and two transition zone) at each axial level. Tumor foci were then manually mapped to a 30-region grid.
Histopathologic Analysis
All patients underwent robotic-assisted laparoscopic radical prostatectomy. Prostatectomy specimens were differentially inked to provide orientation of the specimen, injected with neutral buffered formalin, and fixed for at least 24 hours at room temperature. Following fixation, the seminal vesicles were amputated and the prostate was sliced from the apex to the base at 3-mm intervals, independently from axial MR images. All slices were then embedded in paraffin as a whole mount, cut into 4-μm-thick sections, and stained with hematoxylin and eosin for examination under light microscopy. Histopathologic evaluation was performed by one urologic pathologist (J.P.S., with 15 years of experience) in a single session while blinded to the imaging results. Sections were assessed for presence of tumor, Gleason score, and extraprostatic extension. Each focus of tumor was outlined and maximum axial diameter measured. Tumors were then manually mapped to the 30-region grid.
Radiologic-Histopathologic Correlation
Several factors are known to limit one-to-one anatomic correlation of in vivo imaging findings with pathologic specimens, such as tissue deformation, shrinkage during fixation, and misaligned tissue slices. Although there is no standard approach to account for these variables, we chose to apply a previously described analytic method to minimize potential errors introduced by distortion (26). With this method, imaging and histopathologic data were correlated by using both a “raw stringent” one-to-one approach, and an “alternative neighboring” approach, with “neighbors” defined as adjacent anatomic regions on the grid. With use of the raw stringent approach, a radiologic-pathologic correlation was considered only when a tumor focus was present in the same region. With use of the alternative neighboring approach, radiologic-pathologic correlation was classified as tumor being present in the same region or any of the immediately adjacent regions. The transition zone immediately adjacent to a tumor focus in the peripheral zone was not considered a neighbor. Therefore, a given region could have three or five neighbors. For example, regions neighboring a tumor focus in the right apex anterior peripheral zone included the right apex posterior peripheral zone and right apex-to-midgland anterior and posterior peripheral zones. Regions neighboring a tumor focus in the right midgland anterior peripheral zone included the right midgland posterior peripheral zone, right apex-to-midgland anterior and posterior peripheral zones, and right midgland-to-base anterior and posterior peripheral zones. Transition zone tumors were classified identically.
Statistical Analysis
All statistical analyses were performed by using R software (version 3.4.2; www.r-project.org). Patient demographics and baseline clinical characteristics were summarized by using descriptive statistics. Frequency distribution with percentage was used to summarize categorical variables, and medians with interquartile ranges were used to describe continuous variables.
Diagnostic accuracy for tumor detection was assessed independently for both the raw stringent and neighboring approaches by using histopathologic examination as the reference standard. For the raw stringent approach, any region with tumor identified at histopathologic examination that corresponded to the same region with tumor graded as positive at imaging was considered a true-positive finding, whereas regions negative for tumor at pathologic examination with corresponding regions graded as negative for tumor at imaging were considered true-negative findings. For the neighboring approach, a region with tumor identified at pathologic examination that corresponded to the same region, or any of the three or five neighboring regions with tumor graded as positive at imaging, was considered a true-positive finding. True-negative findings were defined identically to that with the raw stringent approach. The McNemar test was used to compare sensitivities and specificities at the region level between PET/MRI and multiparametric MRI. The 95% confidence interval (CI) for sensitivities and specificities was obtained on the basis of formulation of the estimate ± 1.96 × standard error, where the standard error of sensitivity was calculated as the square root of [sensitivity × (1 − sensitivity)/m], where m is the total number of positive findings. A similar formula was applied to specificity, with m defined as the total number of negative findings. To account for the correlation among multiple prostate regions within each patient, generalized estimating equations were used to generate population-averaged estimates of sensitivity and specificity.
A generalized linear model with a logistic link function was used to analyze the association between radiologic and pathologic variables, accounting for the correlation among multiple regions in the same patient. Specifically, we compared SUVmax and Gleason score and PI-RADS score and Gleason score, where the outcome Gleason score was dichotomized as 3+3 versus greater than 3+3. Receiver operating characteristic analysis was applied to the generalized estimating equation models to estimate the optimal cutoffs for SUVmax and PI-RADS score. A consistency calculation for the area under the receiver operating characteristic curve (AUC) and its error was performed with bootstrap analysis, where a full set of patients was randomly selected from their respective sample populations with replacement. Generalized estimating equations were used to compare the AUC for PET/MRI with the AUC for multiparametric MRI. Two-sided P ≤ .05 was considered indicative of a statistically significant difference.
Results
Thirty-two patients with biopsy-proven prostate cancer underwent preoperative staging with simultaneous 68Ga-PSMA-11 PET, whole-body time-of-flight MRI, and multiparametric MRI of the prostate before radical prostatectomy. Demographic and pathologic characteristics are listed in Table 2. Imaging was performed a median of 20 days (range, 2–160 days) before prostatectomy. Twenty-nine of the 32 patients underwent conclusive multiparametric MRI examinations. Three patients had suboptimal examinations: One patient had susceptibility artifact from a previous hip replacement, and two patients had suboptimal diffusion-weighted images owing to susceptibility artifact. All three examinations were interpreted as negative for cancer. Thirty-two patients were included for analysis. The patient population is summarized in the flowchart in Figure 1. No adverse events occurred during imaging.
Table 2:
Summary of Patient Characteristics
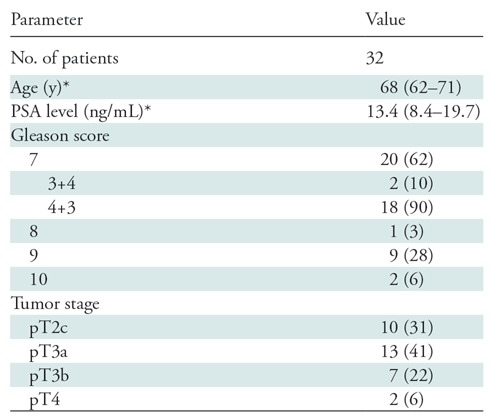
Note.—Except where indicated, data are numbers of patients, with percentages in parentheses. PSA = prostate-specific antigen.
*Data are medians, with interquartile range in parentheses.
At histopathologic examination, 412 tumor-positive regions were identified among 960 total regions in 32 patients, corresponding to 66 distinct tumors. Gleason scores were 3+3 in 23 tumors (35%) and 7 or greater in the remaining 43 tumors (65%). Nine tumors (14%) were 5 mm or less in diameter, of which seven had a Gleason score of 3+3.
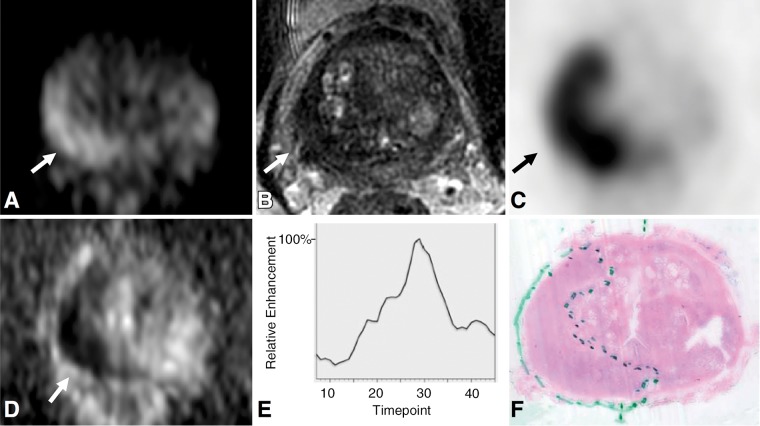
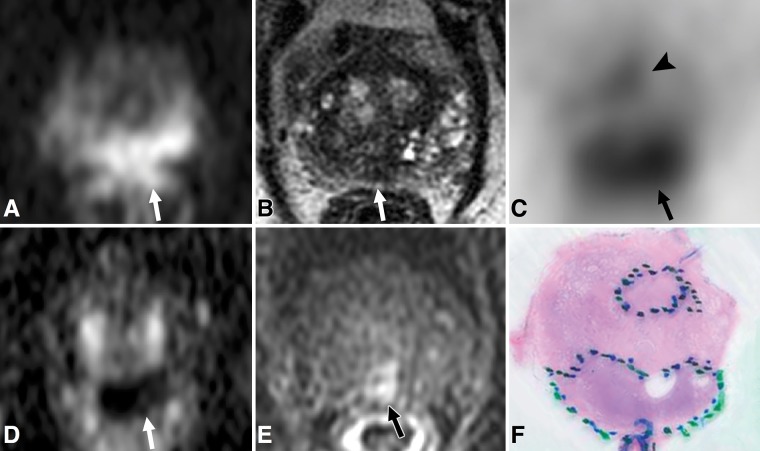
PET/MRI depicted 434 regions with elevated radiotracer uptake graded as positive for tumor. Multiparametric MRI depicted 287 regions graded as PI-RADS 3, 4, or 5 (three, 22, and 278 regions, respectively), which are considered positive for tumor. Figure 2 provides an example of concordant radiologic and pathologic findings. Region-specific and population-averaged sensitivities and specificities of both PET/MRI and MRI are outlined in Table 3. With the raw stringent approach, PET/MRI enabled the correct identification of 275 of 412 tumor-positive regions and 389 of 548 tumor-negative regions, corresponding to a sensitivity of 67% (95% CI: 62%, 71%) and specificity of 71% (95% CI: 67%, 75%). With the alternative neighboring approach, sensitivity and specificity increased to 74% (383 of 520; 95% CI: 70%, 77%) and 88% (389 of 440; 95% CI: 85%, 91%), respectively. Multiparametric MRI enabled the correct identification of 174 tumor-positive regions and 475 tumor-negative regions, corresponding to a sensitivity of 42% (95% CI: 37%, 47%) and specificity of 79% (95% CI: 76%, 83%). Sensitivity and specificity of multiparametric MRI also increased with the alternative neighboring approach (sensitivity: 50% [237 of 475; 95% CI: 45%, 54%]; specificity: 90% [435 of 485; 95% CI: 87%, 92%]). Sensitivity was higher for PET/MRI compared with multiparametric MRI for both approaches (P < .001). The population-averaged estimates of sensitivity obtained with the generalized estimating equation approach were 73% (95% CI: 68%, 79%) for PET/MRI and 69% (95% CI: 62%, 75%) for multiparametric MRI (P = .04). Specificity for PET/MRI was lower than that for multiparametric MRI with the raw stringent approach (71% [95% CI: 67%, 75%] vs 79% [95% CI: 76%, 83%], respectively; P < .001) but similar to that with the neighboring approach (88% [95% CI: 70%, 77%] vs 90% [95% CI: 87%, 92%], P = .99) and the population-averaged estimate (70% [95% CI: 64%, 76%] vs 70% [95% CI: 64%, 75%], P = .99). Overall, PET/MRI depicted prostate cancer in 97% of patients (31 of 32 men), compared with 79% of patients in whom prostate cancer was detected with multiparametric MRI (23 of 29 patients with conclusive multiparametric MRI examinations). Figure 3 is an example of discordant PET/MRI and multiparametric MRI findings.
Figure 2:
Images in 75-year-old man with prostate-specific antigen level of 25.6 ng/mL. A, Axial diffusion-weighted image (b value, 1350 sec/mm2) of midprostate and, D, corresponding apparent diffusion coefficient map demonstrate restricted diffusion in right posterior peripheral zone (arrow), with well-defined low signal intensity on, B, T2-weighted image. C, Corresponding PET scan demonstrates focal radiotracer uptake (arrow) with maximum standardized uptake value of 23.9. E, Enhancement curve with washout reconstructed from dynamic T1-weighted postcontrast images. F, Histopathologic slide of midprostate (hematoxylin-eosin stain; original magnification, ×1) confirms presence of tumor (Gleason score 4+5) with extraprostatic extension.
Table 3:
Diagnostic Accuracy of 68Ga-PSMA-11 PET and Multiparametric MRI
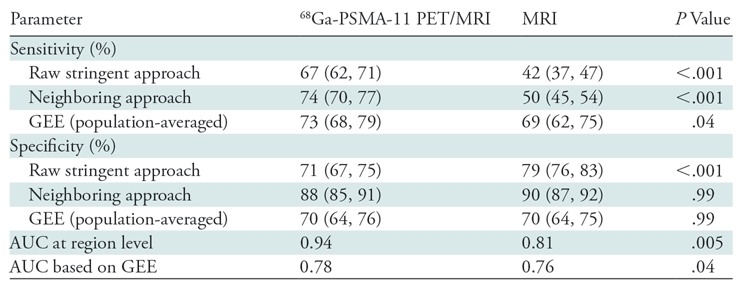
Note.—Numbers in parentheses are 95% confidence intervals. AUC = area under the receiver operating characteristic curve, 68Ga = gallium 68, GEE = generalized estimating equation, PSMA = prostate-specific membrane antigen.
Figure 3:
Images in 72-year-old man with prostate-specific antigen level of 5.9 ng/mL. A, Axial diffusion-weighted image of midprostate (b value, 1350 sec/mm2) and, D, corresponding apparent diffusion coefficient map demonstrate single focus of restricted diffusion (arrow) in midline posterior peripheral zone. The focus (arrow) has ill-defined low signal intensity on, B, T2-weighted image and suspicious enhancement on, E, dynamic T1-weighted postcontrast image. C, Corresponding PET scan demonstrates two separate areas of focal radiotracer uptake, including one focus in midline posterior peripheral zone with maximum standardized uptake value (SUVmax) of 11.7 (arrow) and additional focus in central aspect of left anterior peripheral zone with SUVmax of 6.2 (arrowhead). F, Histopathologic slide of midprostate (hematoxylin-eosin stain; original magnification, ×1) confirms presence of two distinct tumors, one within midline posterior peripheral zone (Gleason score 4+5) with extraprostatic extension and one in central aspect of left anterior peripheral zone (Gleason score 4+3).
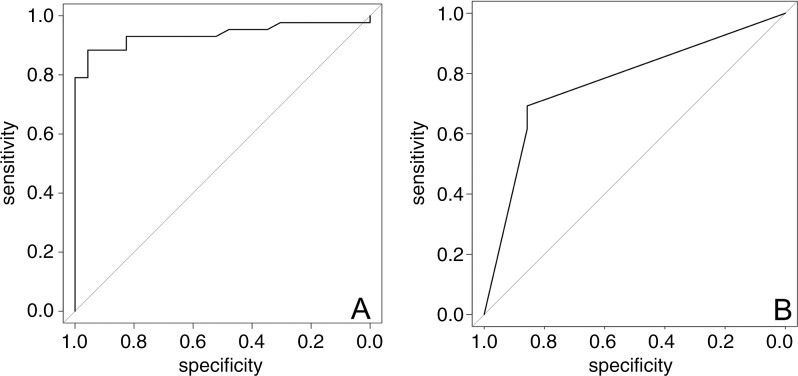
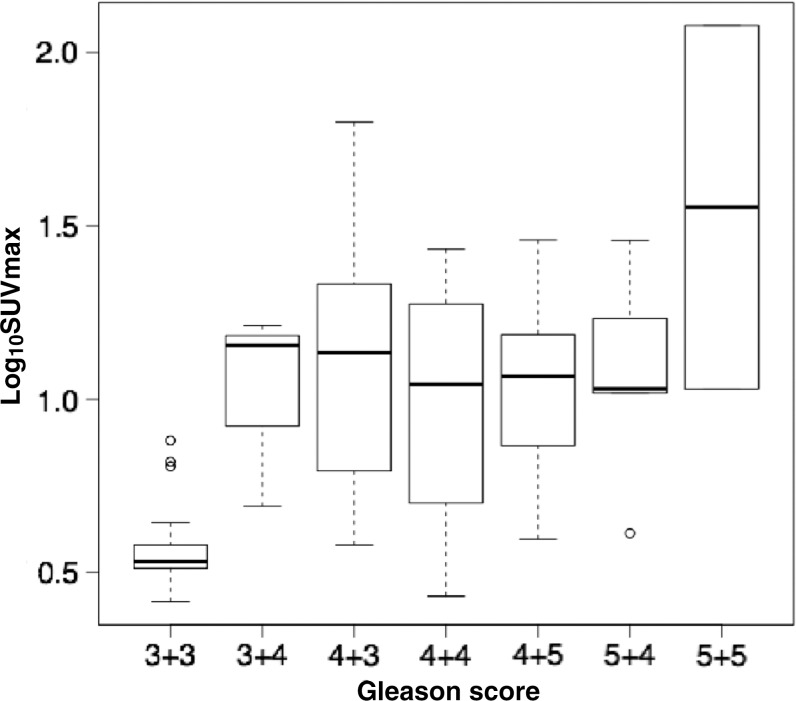
The generalized linear model demonstrated an association between SUVmax and Gleason score of 7 or greater and between PI-RADS score and Gleason score (odds ratio = 2.21 [95% CI: 1.46, 3.36], P < .001 and 1.94 [95% CI: 1.05, 3.58], respectively; P = .04). Taking into account lesion size, the model demonstrated a size-independent association between SUVmax and Gleason score (odds ratio = 1.71 [95% CI: 1.27, 2.31], P < .001). Receiver operating characteristic curves for PET/MRI and multiparametric MRI are shown in Figure 4. The corresponding AUC for PET/MRI was higher than that for multiparametric MRI (0.94 vs 0.81, respectively [P = .005], at the region level and 0.78 vs 0.76 [P = .04] at the patient level), with an optimal SUVmax cutoff of 6.7 (sensitivity, 88%; specificity, 96%). Figure 5 illustrates the relationship between SUVmax and various Gleason patterns in our cohort with a logarithmic scale.
Figure 4:
Receiver operating characteristic curves generated with generalized linear models of maximum standardized uptake value for, A, gallium 68–labeled prostate-specific membrane antigen PET/MRI and, B, Prostate Imaging Reporting and Data System score with multiparametric MRI. With generalized linear model estimate, the area under the receiver operating characteristic curve for PET/MRI was higher than that for multiparametric MRI (P = .04).
Figure 5:
Box plot depicts maximum tumor standardized uptake value (SUVmax), on a logarithmic scale, across various tumor Gleason scores. Vertical borders of box represent 25th and 75th percentiles, and middle bar represents median. Error bars represent first and 99th percentiles, and circles represent outliers. Generalized linear model demonstrated an association between SUVmax and Gleason score of 7 or greater (odds ratio = 2.22 [95% confidence interval: 1.46, 3.35], P < .001).
Discussion
In our study of 32 patients with biopsy-proven intermediate- to high-risk prostate cancer undergoing 68Ga-PSMA-11 PET/ MRI before radical prostatectomy, we demonstrated that 68Ga-PSMA-11 PET/MRI improved region-specific and population-averaged sensitivity for the detection of prostate cancer compared with multiparametric MRI. Moreover, measurements of tumor SUVmax were predictive of histopathologic tumor patterns, with values greater than 6.9 suggestive of overall tumor Gleason pattern of at least 7. Our findings may improve the diagnostic confidence of radiologists when evaluating patients referred for imaging after a positive biopsy result. Radiologists will then be able to risk-stratify patients as having a high likelihood of clinically significant prostate cancer and identify appropriate candidates for definitive therapy.
Our study demonstrated improved rates of primary prostate cancer detection compared with previous studies evaluating 68Ga-PSMA-11 PET in high-risk patients before prostatectomy, using both the raw stringent and alternative neighboring approaches. Rhee et al (27) used CT for anatomic localization and attenuation correction and reported a sensitivity of 49% for PET based on a 27-region prostate analysis, compared with 44% with multiparametric MRI. Eiber et al (19) used a sextant-based analysis and demonstrated a sensitivity of 64% with 68Ga-PSMA-11 PET with MRI for anatomic localization, compared with 58% with multiparametric MRI. In both studies, the sensitivity of PET was found to be similar to that of multiparametric MRI. The higher sensitivity of PET/MRI in our study compared with the literature may in part be explained by our use of MRI for anatomic localization when compared with the former study, and our characterization of prostate cancer with PET imaging using a binary scale, compared with the use of a five-point Likert scale in the latter study. Although the region-based sensitivity of multiparametric MRI was low, the overall patient-based sensitivity of 79% is comparable to that in the literature (28). We chose to include the three inconclusive multiparametric MRI examinations because susceptibility is an artifact inherent to the modality, which lowered its sensitivity for prostate cancer detection in our study.
The improvements in sensitivity and specificity for both PET/MRI and multiparametric MRI when using the alternative neighboring approach underscore the challenges of accurate correlation of radiologic and pathologic findings. The neighboring approach was performed to account for errors in sectioning angle and specimen deformation during the pathologic fixation process with use of a standardized method. Although a variety of techniques have been developed in an attempt to correct the issue of misregistration, the neighboring approach allowed for blinded readers to make unbiased observations. In any case, our data obtained with both the raw stringent and neighboring approaches support the observation that 68Ga-PSMA-11 PET/MRI aids in the diagnosis of prostate cancer compared with imaging with multiparametric MRI.
The results of logistic regression analysis may provide insight into tumor biology. Abnormal radiotracer accumulation was associated with a tumor Gleason score of 7 and higher, independent of tumor size. Tumors identified at pathologic examination that were not identified on PET/MRI images (n = 20; median diameter, 7.5 mm) were assigned SUVmax values equal to the average standardized uptake value of the background prostate parenchyma. PSMA is overexpressed in primary and metastatic prostate cancer cells and in prostate cancer tissues after androgen deprivation therapy (29,30). Tumor PSMA expression is also associated with higher Gleason scores (8,31). 68Ga-PSMA-11 PET/MRI could potentially serve as a marker for clinically significant prostate cancer, with patients with negative PET/MRI results considered to have low risk of clinically significant disease. Further studies are required to investigate the role of 68Ga-PSMA-11 PET/MRI in the screening and active surveillance populations.
Our study had several limitations, including its retrospective study design. Most patients included in this study had a high-risk profile, and all had biopsy-proven prostate cancer. Therefore, our results are not directly generalizable to the screening or active surveillance populations and may not apply to all surgical populations. The radiologists reviewing the PET/MRI and multiparametric MR images were aware that patients had biopsy-proven prostate cancer, which may have introduced bias during image interpretation. Our multiparametric MRI protocol could be improved with the addition of an endorectal coil, which may improve sensitivity for cancer detection. In addition, our MRI protocol used 6-mm-thick sections for diffusion-weighted imaging to improve the signal-to-noise ratio on diffusion-weighted images, but this may limit sensitivity for small lesions. The alternative neighboring approach may overestimate the true sensitivity of PET/MRI and multiparametric MRI in some patients, although the effect would be equal for both modalities. Because sensitivity depends on the number of true-positive lesions in a given patient, the neighboring approach has the potential to incorrectly estimate sensitivity in patients with multiple lesions.
In conclusion, 68Ga-PSMA-11 PET/MRI improved the sensitivity in the detection of prostate cancer compared with multiparametric MRI, with similar specificity. Abnormal radiotracer accumulation is predictive of a tumor Gleason score of 7 and higher. Further studies evaluating 68Ga-PSMA-11 PET/MRI in the screening and active surveillance populations are warranted.
T.A.H. was supported by the Prostate Cancer Foundation (2017 Jonathan Kovler Young Investigator Award), the National Institutes of Health (grant R01CA212148), and GE Healthcare (research grant).
Disclosures of Conflicts of Interest: R.M.H. disclosed no relevant relationships. J.P.S. Activities related to the present article: disclosed no relevant relationships. Activities not related to the present article: institution received money for board membership at 3D Biopsy; has stock/stock options in 3D Biopsy. Other relationships: disclosed no relevant relationships. A.C.W. Activities related to the present article: disclosed no relevant relationships. Activities not related to the present article: is a paid consultant for 3D Biopsy. Other relationships: disclosed no relevant relationships. H.G.N. disclosed no relevant relationships. K.L.G. Activities related to the present article: disclosed no relevant relationships. Activities not related to the present article: is a paid consultant for Ambu. Other relationships: disclosed no relevant relationships. L.Z. Activities related to the present article: disclosed no relevant relationships. Activities not related to the present article: is a paid consultant for Dendreon. Other relationships: disclosed no relevant relationships. P.R.C. disclosed no relevant relationships. T.A.H. Activities related to the present article: disclosed no relevant relationships. Activities not related to the present article: has grants/grants pending from GE Healthcare. Other relationships: disclosed no relevant relationships.
Abbreviations:
- AUC
- area under the receiver operating characteristic curve
- CI
- confidence interval
- PI-RADS
- Prostate Imaging Reporting and Data System
- PSMA
- prostate-specific membrane antigen
- SUVmax
- maximum standardized uptake value
References
- 1.Siegel RL, Miller KD, Jemal A. Cancer statistics, 2017. CA Cancer J Clin 2017; 67(1):7–30. [DOI] [PubMed] [Google Scholar]
- 2.Carlson GD, Calvanese CB, Kahane H, Epstein JI. Accuracy of biopsy Gleason scores from a large uropathology laboratory: use of a diagnostic protocol to minimize observer variability. Urology 1998;51(4):525–529. [DOI] [PubMed] [Google Scholar]
- 3.Chun FK, Steuber T, Erbersdobler A, et al. Development and internal validation of a nomogram predicting the probability of prostate cancer Gleason sum upgrading between biopsy and radical prostatectomy pathology. Eur Urol 2006;49(5): 820–826. [DOI] [PubMed] [Google Scholar]
- 4.Dickinson L, Ahmed HU, Allen C, et al. Magnetic resonance imaging for the detection, localisation, and characterisation of prostate cancer: recommendations from a European consensus meeting. Eur Urol 2011;59(4):477–494. [DOI] [PubMed] [Google Scholar]
- 5.Muller BG, Shih JH, Sankineni S, et al. Prostate cancer: interobserver agreement and accuracy with the revised Prostate Imaging Reporting and Data System at multiparametric MR imaging. Radiology 2015;277(3):741–750. [DOI] [PMC free article] [PubMed] [Google Scholar]
- 6.Rosenkrantz AB, Ginocchio LA, Cornfeld D, et al. Interobserver reproducibility of the PI-RADS version 2 lexicon: a multicenter study of six experienced prostate radiologists. Radiology 2016;280(3):793–804. [DOI] [PMC free article] [PubMed] [Google Scholar]
- 7.Israeli RS, Powell CT, Corr JG, Fair WR, Heston WD. Expression of the prostate-specific membrane antigen. Cancer Res 1994;54(7):1807–1811. [PubMed] [Google Scholar]
- 8.Ross JS, Sheehan CE, Fisher HA, et al. Correlation of primary tumor prostate-specific membrane antigen expression with disease recurrence in prostate cancer. Clin Cancer Res 2003;9(17):6357–6362. [PubMed] [Google Scholar]
- 9.Afshar-Oromieh A, Haberkorn U, Eder M, Eisenhut M, Zechmann CM. [68Ga]Gallium- labelled PSMA ligand as superior PET tracer for the diagnosis of prostate cancer: comparison with 18F-FECH. Eur J Nucl Med Mol Imaging 2012;39(6):1085–1086. [DOI] [PubMed] [Google Scholar]
- 10.Afshar-Oromieh A, Avtzi E, Giesel FL, et al. The diagnostic value of PET/CT imaging with the (68)Ga-labelled PSMA ligand HBED-CC in the diagnosis of recurrent prostate cancer. Eur J Nucl Med Mol Imaging 2015;42(2):197–209. [DOI] [PMC free article] [PubMed] [Google Scholar]
- 11.Eiber M, Maurer T, Souvatzoglou M, et al. Evaluation of hybrid 68Ga-PSMA ligand PET/CT in 248 patients with biochemical recurrence after radical prostatectomy. J Nucl Med 2015;56(5):668–674. [DOI] [PubMed] [Google Scholar]
- 12.Maurer T, Eiber M, Fanti S, Budäus L, Panebianco V. Imaging for prostate cancer recurrence. Eur Urol Focus 2016;2(2):139–150. [DOI] [PubMed] [Google Scholar]
- 13.Rauscher I, Maurer T, Beer AJ, et al. Value of 68Ga-PSMA HBED-CC PET for the assessment of lymph node metastases in prostate cancer patients with biochemical recurrence: comparison with histopathology after salvage lymphadenectomy. J Nucl Med 2016;57(11):1713–1719. [DOI] [PubMed] [Google Scholar]
- 14.Rahbar K, Weckesser M, Huss S, et al. Correlation of intraprostatic tumor extent with 68Ga-PSMA distribution in patients with prostate cancer. J Nucl Med 2016;57(4):563–567. [DOI] [PubMed] [Google Scholar]
- 15.Fendler WP, Eiber M, Beheshti M, et al. 68Ga-PSMA PET/CT: joint EANM and SNMMI procedure guideline for prostate cancer imaging: version 1.0. Eur J Nucl Med Mol Imaging 2017;44(6):1014–1024. [DOI] [PubMed] [Google Scholar]
- 16.Koerber SA, Utzinger MT, Kratochwil C, et al. 68Ga-PSMA-11 PET/CT in newly diagnosed carcinoma of the prostate: correlation of intraprostatic PSMA uptake with several clinical parameters. J Nucl Med 2017;58(12):1943–1948. [DOI] [PubMed] [Google Scholar]
- 17.Zamboglou C, Drendel V, Jilg CA, et al. Comparison of 68Ga-HBED-CC PSMA-PET/CT and multiparametric MRI for gross tumour volume detection in patients with primary prostate cancer based on slice by slice comparison with histopathology. Theranostics 2017;7(1):228–237. [DOI] [PMC free article] [PubMed] [Google Scholar]
- 18.Woythal N, Arsenic R, Kempkensteffen C, et al. Immunohistochemical validation of PSMA expression measured by 68Ga-PSMA PET/CT in primary prostate cancer. J Nucl Med 2018;59(2):238–243. [DOI] [PubMed] [Google Scholar]
- 19.Eiber M, Weirich G, Holzapfel K, et al. Simultaneous 68Ga-PSMA HBED-CC PET/MRI improves the localization of primary prostate cancer. Eur Urol 2016;70(5):829–836. [DOI] [PubMed] [Google Scholar]
- 20.Nanabala R, Anees MK, Sasikumar A, Joy A, Pillai MR. Preparation of [(68)Ga]PSMA-11 for PET-CT imaging using a manual synthesis module and organic matrix based (68)Ge/(68)Ga generator. Nucl Med Biol 2016;43(8):463–469. [DOI] [PubMed] [Google Scholar]
- 21.Hope TA, Aggarwal R, Chee B, et al. Impact of 68Ga-PSMA-11 PET on management in patients with biochemically recurrent prostate cancer. J Nucl Med 2017;58(12):1956–1961. [DOI] [PubMed] [Google Scholar]
- 22.Wollenweber SD, Ambwani S, Lonn AHR, et al. Comparison of 4-class and continuous fat/water methods for whole-body, MR-based PET attenuation correction. IEEE Trans Nucl Sci 2013;60(5):3391–3398. [Google Scholar]
- 23.Hope TA, Petkovska I, Saranathan M, Hargreaves BA, Vasanawala SS. Combined parenchymal and vascular imaging: high spatiotemporal resolution arterial evaluation of hepatocellular carcinoma. J Magn Reson Imaging 2016;43(4):859–865. [DOI] [PubMed] [Google Scholar]
- 24.Loening AM, Litwiller DV, Saranathan M, Vasanawala SS. Increased speed and image quality for pelvic single-shot fast spin-echo imaging with variable refocusing flip angles and full-Fourier acquisition. Radiology 2017;282(2):561–568. [DOI] [PMC free article] [PubMed] [Google Scholar]
- 25.Weinreb JC, Barentsz JO, Choyke PL, et al. PI-RADS prostate imaging—reporting and data system: 2015, version 2. Eur Urol 2016;69(1):16–40. [DOI] [PMC free article] [PubMed] [Google Scholar]
- 26.Turkbey B, Pinto PA, Mani H, et al. Prostate cancer: value of multiparametric MR imaging at 3 T for detection—histopathologic correlation. Radiology 2010; 255(1):89–99. [DOI] [PMC free article] [PubMed] [Google Scholar]
- 27.Rhee H, Thomas P, Shepherd B, et al. Prostate specific membrane antigen positron emission tomography may improve the diagnostic accuracy of multiparametric magnetic resonance imaging in localized prostate cancer. J Urol 2016;196(4):1261–1267. [DOI] [PubMed] [Google Scholar]
- 28.de Rooij M, Hamoen EH, Fütterer JJ, Barentsz JO, Rovers MM. Accuracy of multiparametric MRI for prostate cancer detection: a meta-analysis. AJR Am J Roentgenol 2014;202(2):343–351. [DOI] [PubMed] [Google Scholar]
- 29.Wright GL, Jr, Grob BM, Haley C, et al. Upregulation of prostate-specific membrane antigen after androgen-deprivation therapy. Urology 1996;48(2):326–334. [DOI] [PubMed] [Google Scholar]
- 30.Silver DA, Pellicer I, Fair WR, Heston WD, Cordon-Cardo C. Prostate-specific membrane antigen expression in normal and malignant human tissues. Clin Cancer Res 1997;3(1):81–85. [PubMed] [Google Scholar]
- 31.Marchal C, Redondo M, Padilla M, et al. Expression of prostate specific membrane antigen (PSMA) in prostatic adenocarcinoma and prostatic intraepithelial neoplasia. Histol Histopathol 2004;19(3):715–718. [DOI] [PubMed] [Google Scholar]


