

Abstract
Purpose
To determine if the change in tumor apparent diffusion coefficient (ADC) at diffusion-weighted (DW) MRI is predictive of pathologic complete response (pCR) to neoadjuvant chemotherapy for breast cancer.
Materials and Methods
In this prospective multicenter study, 272 consecutive women with breast cancer were enrolled at 10 institutions (from August 2012 to January 2015) and were randomized to treatment with 12 weekly doses of paclitaxel (with or without an experimental agent), followed by 12 weeks of treatment with four cycles of anthracycline. Each woman underwent breast DW MRI before treatment, at early treatment (3 weeks), at midtreatment (12 weeks), and after treatment. Percentage change in tumor ADC from that before treatment (ΔADC) was measured at each time point. Performance for predicting pCR was assessed by using the area under the receiver operating characteristic curve (AUC) for the overall cohort and according to tumor hormone receptor (HR)/human epidermal growth factor receptor 2 (HER2) disease subtype.
Results
The final analysis included 242 patients with evaluable serial imaging data, with a mean age of 48 years ± 10 (standard deviation); 99 patients had HR-positive (hereafter, HR+)/HER2-negative (hereafter, HER2-) disease, 77 patients had HR-/HER2- disease, 42 patients had HR+/HER2+ disease, and 24 patients had HR-/HER2+ disease. Eighty (33%) of 242 patients experienced pCR. Overall, ΔADC was moderately predictive of pCR at midtreatment/12 weeks (AUC = 0.60; 95% confidence interval [CI]: 0.52, 0.68; P = .017) and after treatment (AUC = 0.61; 95% CI: 0.52, 0.69; P = .013). Across the four disease subtypes, midtreatment ΔADC was predictive only for HR+/HER2- tumors (AUC = 0.76; 95% CI: 0.62, 0.89; P < .001). In a test subset, a model combining tumor subtype and midtreatment ΔADC improved predictive performance (AUC = 0.72; 95% CI: 0.61, 0.83) over ΔADC alone (AUC = 0.57; 95% CI: 0.44, 0.70; P = .032.).
Conclusion
After 12 weeks of therapy, change in breast tumor apparent diffusion coefficient at MRI predicts complete pathologic response to neoadjuvant chemotherapy.
© RSNA, 2018
See also the editorial by deSouza in this issue.
Introduction
Diffusion-weighted (DW) MRI, a functional imaging technique reflecting water diffusion properties in tissue, holds strong potential to reveal early pathologic changes in tumors responding to therapy. Specifically, the apparent diffusion coefficient (ADC) measured at DW MRI, which reflects cellularity and interstitial water mobility, has shown promise as an imaging biomarker to measure early tumor response to treatment (1). Cytotoxic effects of chemotherapy cause cell lysis, alterations in cell membrane permeability, and increases in extracellular space, which lead to a less restrictive environment for water to diffuse. Therefore, it has been hypothesized that an increase in tumor ADCs may reflect favorable treatment response earlier than detectable changes in tumor size.
Change in tumor ADC with treatment has been investigated in a variety of malignancies, including breast cancer (2). Results of prior studies have demonstrated that breast tumor ADCs can significantly differentiate patients who respond to treatment from those who do not (3–5) and predict pathologic response (6–9). However, reports have been variable as to the utility of DW MRI for monitoring therapy (10–12), and authors of a recent meta-analysis identified wide heterogeneity in approach and findings across 15 studies, concluding that further investigation in the form of well-designed large-scale multicenter clinical trials is needed to validate ADC as a predictive biomarker of therapeutic efficacy in breast cancer (13).
The American College of Radiology Imaging Network (ACRIN) trial 6698, Diffusion Weighted MR Imaging Biomarkers for Assessment of Breast Cancer Response to Neoadjuvant Treatment (14), is a multicenter study to evaluate the effectiveness of quantitative DW MRI for assessing breast cancer response to chemotherapy, performed as a substudy to the ongoing I-SPY 2 (Investigation of Serial Studies to Predict Your Therapeutic Response with Imaging and Molecular analysis 2) trial to identify more effective breast cancer treatments (15–17).
Although there have been numerous promising single-center studies, DW MRI has not previously been validated as a reliable biomarker of breast cancer response to therapy in a prospective multicenter clinical trial. Therefore, the primary objective of ACRIN 6698 was to test the hypothesis that change in tumor ADC at DW MRI is predictive of pathologic complete response (pCR) in women undergoing neoadjuvant chemotherapy for breast cancer. A secondary aim was to investigate the combined predictive value of ADC and dynamic contrast material–enhanced (DCE) MRI-derived functional tumor volume (FTV) measures.
Materials and Methods
Subject Eligibility and Enrollment
In this prospective Health Insurance Portability and Accountability Act–compliant multi-institution study, consecutive subjects who were enrolled in I-SPY 2 at sites that met DW MRI qualification requirements were also co-enrolled in the ACRIN 6698 imaging trial (ClinicalTrials.gov: NCT01564368 [14]). Patients eligible for I-SPY 2 included women 18 years of age or older with invasive breast tumors 2.5 cm or larger at clinical examination or imaging who were planning to undergo neoadjuvant chemotherapy. Patients with evidence of distant metastasis were excluded, and those found to have low-risk disease did not proceed to the treatment arm of I-SPY 2. Low-risk disease was defined as hormone receptor (HR)-positive (hereafter, HR+)/human epidermal growth factor receptor 2 (HER2)-negative (hereafter, HER2-) disease or disease with a low-risk profile at MammaPrint testing (Agendia; Irvine, Calif). Both the I-SPY 2 and ACRIN 6698 protocols were approved by institutional review boards at all participating sites, and all subjects gave written informed consent by using a single combined consent form. Six patients in our study overlapped with those of two prior I-SPY 2 trial publications reporting promising efficacy of supplemental neratinib and veliparib-carboplatin treatments in select cancer subtypes (15,16).
MRI examinations with DW MRI were performed before treatment, during early treatment (after three weekly doses of paclitaxel/taxane-based therapy), at midtreatment (12 weeks, between taxane and anthracycline regimens), and after treatment after all chemotherapy, prior to surgery. Our study schema is shown in Figure 1a.
Figure 1a:

(a) ACRIN 6698 trial schema and (b) study patient inclusion and exclusion flowchart. Exp = experimental, Tx = treatment.
Site Qualification
Each MRI system used in the ACRIN 6698 study was required to pass a DW MRI qualification process incorporating assessment of both phantom and patient studies, as described in detail in Appendix E1 (online).
MRI Acquisition
MRI was performed by using a 1.5- or 3.0-T field strength magnet and a dedicated breast radiofrequency coil. The standardized image acquisition protocol included T2-weighted, DW, and DCE MRI sequences performed bilaterally in the axial orientation (18); imaging parameters for each sequence are provided in Table E1 (online). DW MRI was performed before DCE MRI by using a DW single-shot echo planar imaging sequence with parallel imaging (reduction factor, two or greater); fat suppression; a repetition time of greater than 4000 msec; echo time minimum; flip angle, 90°; field of view, 300–360 mm; acquired matrix, 128 × 128 to 192 × 192; in-plane resolution, 1.7–2.8 mm; section thickness, 4–5 mm; and imaging time, 5 or fewer minutes. Diffusion gradients were applied in three orthogonal directions by using diffusion weightings (b values) of 0, 100, 600, and 800 sec/mm2. No respiratory triggering or other motion compensation methods were used. T2-weighted imaging was performed by using a two-dimensional fast spin-echo or a short inversion time inversion recovery sequence (repetition time msec/echo time msec, 2000–10 000/70–140; flip angle, 90°; in-plane resolution, ≤1.4 mm; section thickness, ≤4 mm; gap, ≤1 mm; and imaging time, ≤7 minutes). DCE MRI was performed by using a three-dimensional fat-suppressed T1-weighted gradient-echo sequence with the following parameters: repetition time, 4–10 msec; echo time, minimum; flip angle, 10–20°; in-plane resolution, ≤1.4 mm; section thickness, ≤2.5 mm; and imaging time, 80–100 seconds. Multiple sequential phases were acquired: one before and five or more (for at least 8 minutes) after intravenous gadolinium-based contrast material injection (0.1 mmol per kilogram of body weight at 2 mL/sec, followed by a 20-mL saline flush). The study protocol did not specify the gadolinium agent to be used, but required that the same agent be used for all MRI examinations for an individual patient.
Image Analysis
Centralized DW MRI analysis was performed by trained researchers at University of California, San Francisco, who were blinded to pathologic outcomes (final review performed by J.E.G., with more than 10 years of quantitative breast MR analysis experience), using custom software tools developed with IDL (Exelis Visual Information Solutions, Boulder, Colo). ADC parametric maps (in square millimeters per second) were created by using a linear least-squares fit of the log of the signal intensities at all four b values (0, 100, 600, and 800 sec/mm2) and a classic monoexponential decay model (19), as follows:
where S(b) is the signal intensity with diffusion weighting b and S0 is the signal with no diffusion weighting (20).
Tumors were identified on postcontrast DCE subtraction images and were then localized on DW MR images. Multisection whole-tumor regions of interest (ROIs) were manually defined by selecting regions with hyperintensity at high–b-value DWI (b = 600 or 800 sec/mm2) and relatively low ADC while avoiding adjacent adipose and fibroglandular tissue, biopsy clip artifacts, and regions of high T2 signal (eg, seroma and necrosis). For large and multicentric or multifocal disease, all disease regions were included in the ROI, and several distinct contours could be drawn on multiple sections to cover the entire tumor region as depicted on the DCE images, without including intervening stroma (Fig E1 [online]). All voxels from separate contours were then combined into a single composite ROI to represent the entire tumor, and the mean ADC was calculated. Tumor ROIs were redefined for each treatment time point, referencing lesion location on prior examinations. In tumors without residual enhancement at DCE MRI after treatment, ROIs were defined in the same tissue region as the prior examination.
Per the I-SPY 2 trial protocol, FTV at DCE MRI was prospectively calculated at each treatment time point by site investigators, blinded to pathologic outcomes, using semiautomated U.S. Food and Drug Administration (FDA) investigational device exemption–approved software (Aegis; Hologic, Danbury, Conn). FTV is a previously established predictive imaging marker reflecting tumor vascularity (21,22) used in I-SPY 2 to adjust randomization and evaluate response. As previously described (22), FTV (in cubic centimeters) was computed by summing all tumor voxels meeting specific enhancement criteria, with customized thresholds for each site to account for variability in MRI systems. The default percentage enhancement threshold applied to select tumor voxels for FTV calculation was a 70% increase in the DCE phase acquired closest to 150 seconds after injection.
Pathologic Response Reference Standard
Histopathologic analysis was performed at study sites by institutional pathologists (blinded to FTV and ADC MRI measures) according to the I-SPY 2 trial protocol using the residual cancer burden system (17,23). Following U.S. FDA rationale and guidelines (24), pCR was the reference standard for determining response to neoadjuvant chemotherapy in our study, defined and reported as no residual invasive disease in either breast or axillary lymph nodes after neoadjuvant therapy (ypT0/is, ypN0). Patients were categorized as having pCR or non-pCR on the basis of postsurgical histopathologic examination findings.
Biopsy-based Biomarkers
HR positivity (estrogen receptor positivity or progesterone receptor positivity) and HER2 receptor expression were determined from pretreatment core biopsy by immunohistochemistry or other methods according to the I-SPY 2 trial protocol (17). Tumor subtypes were categorized as HR+/HER2-, HR+/HER2+, HR-/HER2+, and HR-/HER2- (triple negative).
Statistical Analysis
ACRIN 6698 was powered to enroll 160 evaluable subjects to adequately test whether changes in tumor ADC during treatment were predictive of pCR (18). Tumor ADC change, calculated as the percentage change from the pretreatment value (ΔADC), was evaluated at each treatment time point. Receiver operating characteristic curves and the areas under the receiver operating characteristic curve (AUCs) were estimated empirically, and the 95% confidence interval (CI) of the estimated AUC was constructed by using variance derived from the DeLong method (25). The empirical AUC was tested by using the Z-test to determine if the AUC was at least 0.5. Exploratory analyses were also performed according to tumor subtype. The Bonferroni correction was used for multiple comparisons of ΔADC: for all lesions and by tumor subtype across three treatment time points (early, middle, and post), where P < .003 (.05/15) was considered to indicate a statistically significant difference. To build prediction models with ADC and other variables, a data-splitting approach was used where a randomly selected 60% of participants, stratified according to pCR status and tumor subtype, were selected as the training data set and the rest as the test set. Logistic regression with backward variable selection was used to construct the prediction models, which were then applied to the remaining 40% of the data to obtain predictive scores for each participant. Receiver operating characteristic curves were constructed for the predictive scores to predict pCR, and the corresponding AUCs and 95% CIs were calculated. Statistical analyses were performed by using SAS/STAT software, version 9.4 (SAS Institute, Cary, NC), and R, version 3.0.3 (R Foundation for Statistical Computing, Vienna, Austria).
Results
A total of 406 consecutive patients were enrolled in the ACRIN 6698 trial at 10 institutions, including patients from all treatment arms active during the period of enrollment from August 2012 to January 2015. Eighteen (4.4%) of 406 patients were found to be ineligible for I-SPY 2; 116 patients (30%) were not randomized to treatment (factors included MammaPrint low-risk disease, tissue sample and/or microarray issues precluding MammaPrint determination, and patient withdrawal) and 30 patients (7.7%) were excluded because of missing or nonevaluable or poor-quality DW MRI studies (Fig 1b). Of the remaining 242 participants comprising the analysis set, 227 (94%) had evaluable imaging studies at early treatment/3 weeks, 210 (87%) at midtreatment/12 weeks, and 186 (77%) after treatment. Patient characteristics were comparable for the eligible (n = 388) and analysis set (n = 242) groups (Table 1). In the 242 evaluable patients, the mean age was 48 years ± 10. The majority of participants had grade III breast cancer (168 [69%] of 242) and either HR+/HER2- (99 [41%] of 242) or HR-/HER2- (triple negative) (77 [32%] of 242) subtypes (Table 1). After treatment, 80 (33%) of the 242 patients experienced pCR. Multiple MRI vendor systems were represented, and the majority of the patients (169 [70%] of 242) were imaged at 1.5 T (Table E2 [online]).
Figure 1b:

(a) ACRIN 6698 trial schema and (b) study patient inclusion and exclusion flowchart. Exp = experimental, Tx = treatment.
Table 1:
Patient Demographic Data and Disease Characteristics for Eligible and Analysis Cohorts
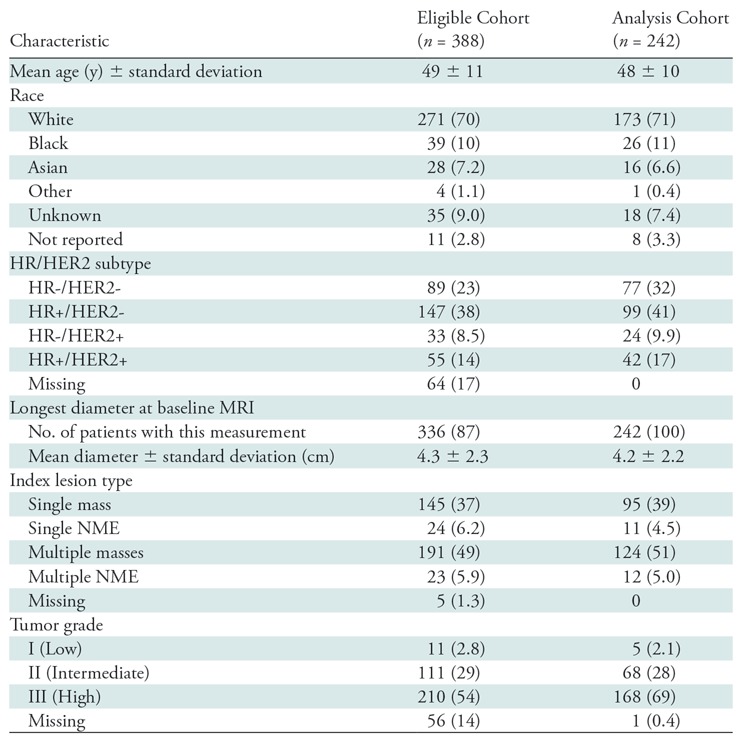
Note.—Unless otherwise specified, data are numbers of patients, with percentages in parentheses. HER2 = human epidermal growth factor receptor 2, HR = hormone receptor, NME = non-mass enhancement.
Association of ADC with Pathologic Response
Mean tumor ADCs (×10–3 mm2/sec) were 1.08 ± 0.20, 1.24 ± 0.27, 1.48 ± 0.42, and 1.62 ± 0.41 at pretreatment, early-treatment (3 weeks), midtreatment (12 weeks), and posttreatment time points, respectively, suggesting a generally increasing trend as treatment progressed. Examples of serial DW MRI quantification in study patients exhibiting different responses to treatment are shown in Figures 2 and 3. No differences were observed in pretreatment ADC between patients with pCR and those without pCR (mean, 1.08 ± 0.16 and 1.08 ± 0.22, respectively), but differences in ADC response were evident during treatment (Fig 4a). ΔADC was not predictive of pCR at early treatment/3 weeks (AUC = 0.53; 95% CI: 0.45, 0.61; P = .48). By midtreatment/12 weeks, mean ΔADC was greater in patients with pCR than in patients without pCR (50% ± 49 and 36% ± 44, respectively) and was predictive of pCR, with AUC = 0.60 (95% CI: 0.52, 0.68; P = .017). ΔADC at posttreatment was similarly predictive, with AUC = 0.61 (95% CI: 0.52, 0.69, P = .013) (Table 2), although neither ΔADC at midtreatment nor ΔADC at posttreatment was significant after multiple-comparison adjustment.
Figure 2:

Serial diffusion-weighted (DW) MR images in a 54-year-old woman who underwent neoadjuvant treatment for grade III triple-negative (hormone receptor–negative/human epidermal growth factor receptor 2–negative) cancer and who experienced pathologic complete response. Imaging was performed with a 3.0-T MRI unit. Shown are axial postcontrast dynamic contrast-enhanced (DCE) MRI images (left), noncontrast DW MRI (b = 800 sec/mm2) images (center), and apparent diffusion coefficient (ADC) maps (right). At each time point, a whole-tumor region of interest (ROI) was defined across multiple sections at DW MRI, and mean ADC was calculated for all voxels in the composite ROI. The tumor manifested as a 4.2-cm mass at pretreatment DCE MRI (top), and the ROI was defined to avoid a central necrotic region. Serial ADC measures increased progressively with treatment, with ΔADC = 18% at early treatment/3 weeks, 28% at midtreatment/12 weeks, and 47% at posttreatment.
Figure 3:

Serial diffusion-weighted (DW) MR images in a 51-year-old woman who underwent neoadjuvant treatment for grade III hormone receptor–positive/human epidermal growth factor receptor 2–negative cancer and who had residual disease at surgery (and thus did not experience pathologic complete response). Imaging was performed with a 3.0-T MRI unit. Shown are axial postcontrast dynamic contrast-enhanced (DCE) MRI images (left), noncontrast DW MRI (b = 800 sec/mm2) images (center), and apparent diffusion coefficient (ADC) maps (right). At each time point, a whole-tumor region of interest (ROI) was defined across multiple sections at DW MRI, and mean ADC was calculated for all voxels in the composite ROI. The tumor appeared as a 7.5-cm mass at pretreatment DCE MRI (top). Serial ADC measures increased only slightly with treatment, with ΔADC = 9.5% at early treatment/3 weeks, 14% at midtreatment/12 weeks, and 29% at posttreatment.
Figure 4a:

Time course of tumor apparent diffusion coefficient (ADC) response during treatment. Plots show mean ADCs at pretreatment, early treatment (3 weeks), midtreatment (12 weeks) and posttreatment time points. Error bars = standard deviations. Shown are results for all 242 patients stratified by (a) pathologic complete response (pCR) versus non-pCR pathologic outcome and (b) cancer hormone receptor (HR)/human epidermal growth factor receptor 2 (HER2) subtype. Tx = treatment.
Table 2:
Performance of Tumor ΔADC for Predicting pCR at Each Treatment Time Point
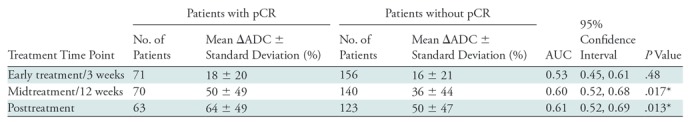
Note.—AUC = area under the receiver operating characteristic curve, ΔADC = change in tumor apparent diffusion coefficient (from pretreatment value), pCR = pathologic complete response.
*Significant at P < .05, but not after multiple-comparison adjustment (P < .003).
Influence of Lesion Subtype on Predictive Value of ADC Measures
Because mechanisms of treatment response vary with underlying tumor biology, the predictive value of ADC was explored in post-hoc analysis by HR/HER2 subtype. The time course of tumor ADC response differed somewhat across tumor subtypes (Fig 4b), as well as between patients with and those without pCR within each subtype (Fig E2 [online]). HR+/HER2- tumors (the most common subtype) demonstrated the lowest pCR rate (15 [15%] of 99), while HR-/HER2+ tumors (the least common subtype) demonstrated the highest pCR rate (18 [75%] of 24). After adjustment for multiple comparisons, ΔADC was predictive of pCR at midtreatment/12 weeks (AUC = 0.76; 95% CI: 0.62, 0.89; P < .001) in HR+/HER2- tumors and was predictive in triple-negative (HR-/HER2-) tumors at posttreatment (AUC = 0.75; 95% CI: 0.62, 0.88; P < .001), but did not reach significance in HR-/HER2+ or HR+/HER2+ tumors at any time point (AUCs ranged from 0.55 to 0.67) (Table 3, Fig 5).
Figure 4b:

Time course of tumor apparent diffusion coefficient (ADC) response during treatment. Plots show mean ADCs at pretreatment, early treatment (3 weeks), midtreatment (12 weeks) and posttreatment time points. Error bars = standard deviations. Shown are results for all 242 patients stratified by (a) pathologic complete response (pCR) versus non-pCR pathologic outcome and (b) cancer hormone receptor (HR)/human epidermal growth factor receptor 2 (HER2) subtype. Tx = treatment.
Table 3:
Performance of Tumor ΔADC for Predicting pCR Stratified by Cancer Subtype
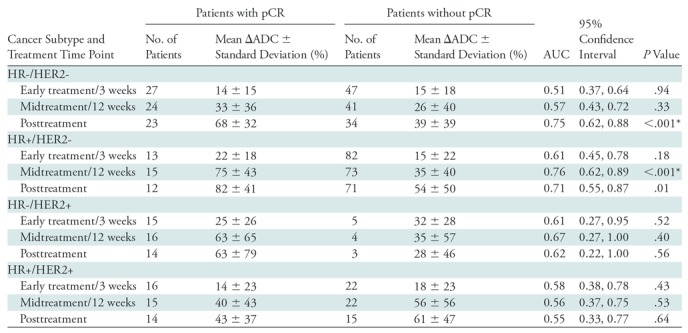
Note.—AUC = area under the receiver operating characteristic curve, ΔADC = change in tumor apparent diffusion coefficient (from pretreatment value), HER2 = human epidermal growth factor receptor 2, HR = hormone receptor, pCR = pathologic complete response.
*Significant after multiple-comparison adjustment (P < .003).
Figure 5a:

Receiver operating characteristic curves for predicting pathologic complete response on the basis of percentage change in tumor apparent diffusion coefficient, stratified by tumor subtype. Curves and calculated areas under the curves are shown with 95% confidence intervals at (a) early treatment/3 weeks, (b) midtreatment/12 weeks, and (c) posttreatment/presurgery time points. HR = hormone receptor, HER2 = human epidermal growth factor receptor 2.
Figure 5b:

Receiver operating characteristic curves for predicting pathologic complete response on the basis of percentage change in tumor apparent diffusion coefficient, stratified by tumor subtype. Curves and calculated areas under the curves are shown with 95% confidence intervals at (a) early treatment/3 weeks, (b) midtreatment/12 weeks, and (c) posttreatment/presurgery time points. HR = hormone receptor, HER2 = human epidermal growth factor receptor 2.
Figure 5c:

Receiver operating characteristic curves for predicting pathologic complete response on the basis of percentage change in tumor apparent diffusion coefficient, stratified by tumor subtype. Curves and calculated areas under the curves are shown with 95% confidence intervals at (a) early treatment/3 weeks, (b) midtreatment/12 weeks, and (c) posttreatment/presurgery time points. HR = hormone receptor, HER2 = human epidermal growth factor receptor 2.
Association of FTV with Pathologic Response
Overall, ΔFTV was predictive of pCR (P < .001) at each time point, with AUCs ranging from 0.63 to 0.68 (Table 4). Greater decreases in FTV predicted pCR, as has been reported in prior trials. By tumor subtype, ΔFTV was predictive only in HR+/HER2- tumors (at all time points; AUCs = 0.69–0.70) and triple-negative (HR-/HER2-) tumors (at posttreatment only, AUC = 0.74; 95% CI: 0.62, 0.86)—similar results to those of ΔADC (Table E3 [online]).
Table 4:
Performance of ΔFTV for Predicting pCR at Each Treatment Time Point
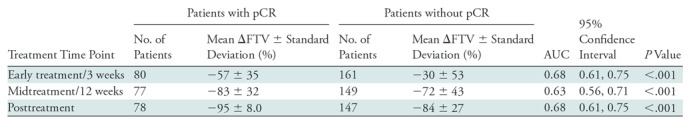
Note.—AUC = area under the receiver operating characteristic curve, ΔFTV = change in functional tumor volume (from pretreatment value), pCR = pathologic complete response.
Predictive Modeling for Pathologic Response
We next sought to construct a predictive model using ADC, tumor subtype, and FTV to improve performance for predicting pCR. Predictive logistic regression modeling was performed in 207 patients with complete midtreatment ΔADC and ΔFTV data. The data were split into a 60% training set (124 patients, randomly selected and stratified according to tumor subtype) and a 40% validation set (86 patients). Characteristics of the 86-patient test set were representative of the full analysis set, with a mean age of 48 years ± 11; 35 patients (41%) had HR+/HER2- disease, 27 (31%) had HR-/HER2- disease, 15 (17%) had HR+/HER2+ disease, and nine (11%) had HR-/HER2+ disease; 29 (34%) of the 86 patients achieved pCR. A model combining ΔADC, ΔFTV, and cancer subtype resulted in an overall predictive performance of AUC = 0.71 (95% CI: 0.59, 0.84). After employing the backward selection algorithm, ΔFTV was eliminated, and the final prediction model retained ΔADC and tumor subtype as predictors. The final model with ΔADC and tumor subtype was significantly more predictive of pCR (AUC = 0.72; 95% CI: 0.61, 0.83) than was ΔADC alone (AUC = 0.57; 95% CI: 0.44, 0.70; P = .032) in the same test set (Fig 6).
Figure 6:

Receiver operating characteristic curves for predictive models at midtreatment/12 weeks. Each model was tested in the same randomly selected group of 86 study patients whose data were not used for model training. Curves reflect the performance in predicting pathologic complete response, with area under the curve (AUC) and 95% confidence intervals given for each. Predictive models incorporating change in apparent diffusion coefficient (ΔADC) alone (solid line), ΔADC + hormone receptor (HR)/human epidermal growth factor receptor 2 (HER2) subtype (dashed line), and ΔADC + change in functional tumor volume (ΔFTV) + HR/HER2 subtype (dotted line) produced AUCs of 0.57, 0.72, and 0.71, respectively.
Discussion
Results of the multicenter ACRIN 6698 trial demonstrate that change in tumor ADC at DW MRI after 12 weeks of therapy is a noninvasive and quantitative imaging biomarker of response in women undergoing neoadjuvant chemotherapy for breast cancer. Our study found that midtreatment (12 weeks, between taxane and anthracycline regimens) tumor ADC changes were predictive of pathologic response, with patients with pCR demonstrating greater increases in ADC from pretreatment levels than patients without pCR.
Exploratory analysis suggested higher predictive performance of ΔADC in HR-positive, HER2-negative tumors. This may have special clinical importance, as HR+/HER2- tumors are less likely to shrink in response to chemotherapy and less often achieve pCR (26), while residual disease is also more commonly underestimated at DCE MRI in HR+/HER2- tumors (26,27). While the primary aim of the ACRIN 6698 trial was to evaluate the performance of ADC alone as a predictor of pCR, multiparametric MRI approaches hold promise to enhance sensitivity for detecting response (7). Our findings showed that the predictive value of ADC may be comparable to or higher than that of DCE MRI–derived FTV for midtreatment response prediction (particularly in HR+/HER2- disease), but the combination of ADC and FTV may not further improve overall predictive accuracy. Although the ADC measurements were not fully independent of the contrast-enhanced images (the ROIs were drawn using the postcontrast images for guidance), these results suggest that DW MRI may have a role as a noncontrast alternative to DCE MRI. This could enable more frequent monitoring of response without the time, costs, and toxicities associated with administration of gadolinium-based contrast material, but additional studies would be required to evaluate the relative advantages of ADC and FTV. It is also important to note that our study was not powered for subgroup analysis, and the failure to detect ΔADC as a significant predictor of pCR in the three tumor subtypes other than HR+/HER2- may be due to inadequate statistical power in these smaller subgroups.
Our study supports results from multiple single-site studies reporting greater treatment-induced increases in tumor ADCs in responders versus nonresponders (3–5,28–30). This increase in tumor ADC is thought to reflect reduced cell membrane integrity and reduced cellularity due to effective cytotoxic chemotherapy, resulting in a less restrictive environment for diffusing water molecules. While several prior studies reported changes in ADC to be predictive after the first cycle of chemotherapy (3–5,7), we did not observe a difference between responders and nonresponders until midtreatment, after 12 weekly cycles of paclitaxel-based therapy. Exclusion of patients with low-risk HR+/HER2- disease in I-SPY 2 may partially explain differences in our results versus those of prior studies, because ADC was most predictive in this subtype. Another important consideration is the variety of treatment regimens comprising the ACRIN 6698 trial data. Patients were randomized to one of multiple experimental treatment arms. Because of the adaptive I-SPY 2 study design, it was not possible to power ACRIN 6698 to control for varying therapies. However, because mechanisms of action differ across treatments, stratification by treatment regimen may yield more insights on the relative value of DW MRI versus DCE MRI and optimal timing for assessing treatment efficacy.
Our study found that change in ADC predicts response despite the expected challenges involved in generalizing single-center results to the multicenter, multiplatform setting. Results from single-center trials are often not widely generalizable for a variety of reasons, including technical factors. While current ACR guidelines exist for performing and interpreting breast DCE MRI, standards for breast DW MRI are not yet incorporated in clinical guidelines. Compared with DCE MRI, DW MRI suffers from poorer spatial resolution, lower signal-to-noise ratio, and greater spatial distortion. Intersite differences in imaging protocol implementations (across systems of varying manufacturers, field strengths, and capabilities) further led to variable image quality. Differences in manufacturer approaches to image reconstruction, scaling, and system-generated ADC maps must also be taken into account, as these differences necessitated additional centralized postprocessing steps before the intersite data were pooled in our study. Many of these limitations are being addressed by MRI system manufacturers and will hopefully lead to greater accuracy and reproducibility of breast DW MRI.
Our study had limitations. ADC was calculated by using a conventional monoexponential decay model with b values ranging from 0 to 800 sec/mm2, which likely included contributions from microvasculature (more prominent at low b values < 200 sec/mm2) and limited the sensitivity for identifying microstructural changes. Advanced DW MRI modeling techniques may better depict therapeutic effects, including intravoxel incoherent motion modeling to additionally quantify perfusion and kurtosis or stretched-exponential modeling to assess microstructural complexity (31,32). ROIs were manually defined; automated tumor segmentation approaches may reduce interoperator variability and improve accuracy for serial measures (33,34). Furthermore, ADC was calculated by averaging all tumor voxels. Alternate analytic approaches are being investigated to improve ability to detect changes in tumor cellularity, including histogram-based analysis and characterization of the “worst” (ie, lowest ADC) tumor subregion. No image registration across time points was performed; through spatial registration of serial DW MRI studies, Galbán et al (3) recently demonstrated that parametric response maps of voxel-based ADC changes may help identify response earlier than averaged whole-tumor ADC measures.
In conclusion, the primary results of this multicenter trial demonstrate that ADC measures to detect treatment-induced microstructural alterations in breast tumors are predictive of pathologic response to neoadjuvant chemotherapy. Although DW MRI and DCE MRI characterize different and potentially independent prognostic biologic properties related to tumor proliferation and angiogenesis, respectively, our preliminary findings did not confirm them to be complementary in predicting pCR. Further investigation is warranted to assess the potential role of DW MRI as a noncontrast alternative to DCE MRI for midtreatment assessment of therapeutic efficacy. More detailed evaluation of ACRIN 6698 trial data regarding specific therapies, alternate analytic approaches, and optimal assessment timing will likely yield additional value of DW MRI for monitoring therapy and further clarify the role of DW MRI as a quantitative imaging marker of response in breast cancer clinical trials and personalized treatment regimens.
Summary
Change in apparent diffusion coefficient at diffusion-weighted MRI after 12 weeks of therapy is a noninvasive and quantitative imaging biomarker of response in women undergoing neoadjuvant chemotherapy for breast cancer.
Implications for Patient Care
■ Diffusion-weighted MRI depicts the cytotoxic effects of chemotherapy in breast tumors.
■ Greater increases in tumor apparent diffusion coefficient after 12 weeks of chemotherapy predict pathologic response and higher likelihood of pathologic complete response.
■ Diffusion-weighted MRI may enable objective assessment of therapeutic efficacy, particularly for hormone receptor–positive, human epidermal growth factor receptor 2–negative disease.
APPENDIX
SUPPLEMENTAL FIGURES
Acknowledgments
Acknowledgments
The authors acknowledge those individuals who have contributed substantially to the work reported in the manuscript, including the ACRIN 6698 and I-SPY 2 trial teams, the patients who participated in the study, and the staff members who contributed to the conduct of the study at the University of California, San Francisco; University of Minnesota; University of Pennsylvania; University of Washington; University of Alabama, Birmingham; University of California, San Diego; University of Texas MD Anderson Cancer Center; Oregon Health Sciences University; University of Chicago; and H. Lee Moffitt Cancer Center and Research Institute.
Supported by the National Cancer Institute through grants U01 CA079778 and U01 CA080098 (to the American College of Radiology Imaging Network), grant R01 CA151326 (to S.C.P.), grant U01 CA166104 (to T.L.C.), grant P41 EB015894 (to P.J.B.), and grants U01 CA151235 and R01 CA132870 (to N.M.H.).
Disclosures of Conflicts of Interest: S.C.P. Activities related to the present article: disclosed no relevant relationships. Activities not related to the present article: institution has received funding from GE Healthcare and Philips Healthcare; institution has received in-kind research support for an advanced MRI study. Other relationships: disclosed no relevant relationships. Z.Z. disclosed no relevant relationships. D.C.N. disclosed no relevant relationships. J.E.G. disclosed no relevant relationships. T.L.C. disclosed no relevant relationships. M.A.R. disclosed no relevant relationships. P.J.B. disclosed no relevant relationships. H.S.M. disclosed no relevant relationships. J.R. disclosed no relevant relationships. L.C. disclosed no relevant relationships. B.N.J. disclosed no relevant relationships. H.R.U. Activities related to the present article: disclosed no relevant relationships. Activities not related to the present article: institution has received grants from AUR and GE Healthcare and from Philips Healthcare; receives royalties from Wolters Kluwer. Other relationships: disclosed no relevant relationships. H.O. disclosed no relevant relationships. B.D. disclosed no relevant relationships. K.O. disclosed no relevant relationships. H.A. disclosed no relevant relationships. J.S.D. disclosed no relevant relationships. L.J.E. Activities related to the present article: disclosed no relevant relationships. Activities not related to the present article: institution has travel reimbursement grants from the Breast Cancer Research Foundation, the National Cancer Institute, and the Quantum Leap Healthcare Collaborative; has received travel reimbursement and honoraria from WIN 2018, the Einstein/Montefiore Visiting Professor Program, Cancer Progress 2018, the Bridging Clinical Collaborative Meeting, the Sanford H. Cole Memorial Symposium, and the UK Interdisciplinary Breast Cancer Symposium; has received travel expenses and an honorarium from the Blue Cross Blue Shield Association Medical Advisory Panel. Other relationships: disclosed no relevant relationships. N.M.H. disclosed no relevant relationships.
Abbreviations:
- ACRIN
- American College of Radiology Imaging Network
- ADC
- apparent diffusion coefficient
- AUC
- area under the receiver operating characteristic curve
- CI
- confidence interval
- DCE
- dynamic contrast enhanced
- DW
- diffusion weighted
- FDA
- Food and Drug Administration
- FTV
- functional tumor volume
- HER2
- human epidermal growth factor receptor 2
- HR
- hormone receptor
- I-SPY 2
- Investigation of Serial Studies to Predict Your Therapeutic Response with Imaging and Molecular Analysis 2
- pCR
- pathologic complete response
- ROI
- region of interest
References
- 1.Chenevert TL, Stegman LD, Taylor JM, et al. Diffusion magnetic resonance imaging: an early surrogate marker of therapeutic efficacy in brain tumors. J Natl Cancer Inst 2000;92(24):2029–2036. [DOI] [PubMed] [Google Scholar]
- 2.Partridge SC, Nissan N, Rahbar H, Kitsch AE, Sigmund EE. Diffusion-weighted breast MRI: Clinical applications and emerging techniques. J Magn Reson Imaging 2017;45(2):337–355. [DOI] [PMC free article] [PubMed] [Google Scholar]
- 3.Galbán CJ, Ma B, Malyarenko D, et al. Multi-site clinical evaluation of DW-MRI as a treatment response metric for breast cancer patients undergoing neoadjuvant chemotherapy. PLoS One 2015;10(3):e0122151. [DOI] [PMC free article] [PubMed] [Google Scholar]
- 4.Sharma U, Danishad KK, Seenu V, Jagannathan NR. Longitudinal study of the assessment by MRI and diffusion-weighted imaging of tumor response in patients with locally advanced breast cancer undergoing neoadjuvant chemotherapy. NMR Biomed 2009;22(1):104–113. [DOI] [PubMed] [Google Scholar]
- 5.Li XR, Cheng LQ, Liu M, et al. DW-MRI ADC values can predict treatment response in patients with locally advanced breast cancer undergoing neoadjuvant chemotherapy. Med Oncol 2012;29(2):425–431. [DOI] [PubMed] [Google Scholar]
- 6.Richard R, Thomassin I, Chapellier M, et al. Diffusion-weighted MRI in pretreatment prediction of response to neoadjuvant chemotherapy in patients with breast cancer. Eur Radiol 2013;23(9):2420–2431. [DOI] [PubMed] [Google Scholar]
- 7.Li X, Abramson RG, Arlinghaus LR, et al. Multiparametric magnetic resonance imaging for predicting pathological response after the first cycle of neoadjuvant chemotherapy in breast cancer. Invest Radiol 2015;50(4):195–204. [DOI] [PMC free article] [PubMed] [Google Scholar]
- 8.Liu S, Ren R, Chen Z, et al. Diffusion-weighted imaging in assessing pathological response of tumor in breast cancer subtype to neoadjuvant chemotherapy. J Magn Reson Imaging 2015;42(3):779–787. [DOI] [PubMed] [Google Scholar]
- 9.Bufi E, Belli P, Costantini M, et al. Role of the apparent diffusion coefficient in the prediction of response to neoadjuvant chemotherapy in patients with locally advanced breast cancer. Clin Breast Cancer 2015;15(5):370–380. [DOI] [PubMed] [Google Scholar]
- 10.Manton DJ, Chaturvedi A, Hubbard A, et al. Neoadjuvant chemotherapy in breast cancer: early response prediction with quantitative MR imaging and spectroscopy. Br J Cancer 2006;94(3):427–435 [Published correction appears in Br J Cancer 2006;94(10):1544.]. [DOI] [PMC free article] [PubMed] [Google Scholar]
- 11.Minarikova L, Bogner W, Pinker K, et al. Investigating the prediction value of multiparametric magnetic resonance imaging at 3 T in response to neoadjuvant chemotherapy in breast cancer. Eur Radiol 2017;27(5):1901–1911. [DOI] [PMC free article] [PubMed] [Google Scholar]
- 12.Nilsen L, Fangberget A, Geier O, Olsen DR, Seierstad T. Diffusion-weighted magnetic resonance imaging for pretreatment prediction and monitoring of treatment response of patients with locally advanced breast cancer undergoing neoadjuvant chemotherapy. Acta Oncol 2010;49(3):354–360. [DOI] [PubMed] [Google Scholar]
- 13.Chu W, Jin W, Liu D, et al. Diffusion-weighted imaging in identifying breast cancer pathological response to neoadjuvant chemotherapy: a meta-analysis. Oncotarget 2017;9(6):7088–7100. [DOI] [PMC free article] [PubMed] [Google Scholar]
- 14.DWI in assessing treatment response in patients with breast cancer receiving neoadjuvant chemotherapy (ACRIN6698). https://clinicaltrials.gov/ct2/show/NCT01564368. Accessed July 9, 2018.
- 15.Rugo HS, Olopade OI, DeMichele A, et al. Adaptive randomization of veliparib-carboplatin treatment in breast cancer. N Engl J Med 2016;375(1):23–34. [DOI] [PMC free article] [PubMed] [Google Scholar]
- 16.Park JW, Liu MC, Yee D, et al. Adaptive randomization of neratinib in early breast cancer. N Engl J Med 2016;375(1):11–22. [DOI] [PMC free article] [PubMed] [Google Scholar]
- 17.I-SPY 2 trial: neoadjuvant and personalized adaptive novel agents to treat breast cancer (I-SPY 2). https://clinicaltrials.gov/ct2/show/NCT01042379. Accessed July 9, 2018.
- 18.ACRIN 6698 trial protocol and imaging materials . https://www.acrin.org/PROTOCOLSUMMARYTABLE/PROTOCOL6698/6698ImagingMaterials.aspx. Accessed July 9, 2018.
- 19.Stejskal EO, Tanner JE. Spin diffusion measurements: spin echoes in the presence of a time-dependent field gradient. J Chem Phys 1965;42(1):288–292. [Google Scholar]
- 20.Le Bihan D, Breton E, Lallemand D, Grenier P, Cabanis E, Laval-Jeantet M. MR imaging of intravoxel incoherent motions: application to diffusion and perfusion in neurologic disorders. Radiology 1986;161(2):401–407. [DOI] [PubMed] [Google Scholar]
- 21.Hylton NM, Blume JD, Bernreuter WK, et al. Locally advanced breast cancer: MR imaging for prediction of response to neoadjuvant chemotherapy—results from ACRIN 6657/I-SPY trial. Radiology 2012;263(3):663–672. [DOI] [PMC free article] [PubMed] [Google Scholar]
- 22.Hylton NM, Gatsonis CA, Rosen MA, et al. Neoadjuvant chemotherapy for breast cancer: functional tumor volume by MR imaging predicts recurrence-free survival-results from the ACRIN 6657/CALGB 150007 I-SPY 1 trial. Radiology 2016;279(1):44–55. [DOI] [PMC free article] [PubMed] [Google Scholar]
- 23.Symmans WF, Peintinger F, Hatzis C, et al. Measurement of residual breast cancer burden to predict survival after neoadjuvant chemotherapy. J Clin Oncol 2007;25(28):4414–4422. [DOI] [PubMed] [Google Scholar]
- 24.U.S. Food and Drug Administration (FDA) . Guidance for industry: pathological complete response in neoadjuvant treatment of high-risk early-stage breast cancer: use as an endpoint to support accelerated approval. https://www.fda.gov/downloads/drugs/guidances/ucm305501.pdf. Accessed July 9, 2018.
- 25.DeLong ER, DeLong DM, Clarke-Pearson DL. Comparing the areas under two or more correlated receiver operating characteristic curves: a nonparametric approach. Biometrics 1988;44(3):837–845. [PubMed] [Google Scholar]
- 26.Loo CE, Straver ME, Rodenhuis S, et al. Magnetic resonance imaging response monitoring of breast cancer during neoadjuvant chemotherapy: relevance of breast cancer subtype. J Clin Oncol 2011;29(6):660–666. [DOI] [PubMed] [Google Scholar]
- 27.Ojeda-Fournier H, de Guzman J, Hylton N. Breast magnetic resonance imaging for monitoring response to therapy. Magn Reson Imaging Clin N Am 2013;21(3):533–546. [DOI] [PubMed] [Google Scholar]
- 28.Park SH, Moon WK, Cho N, et al. Diffusion-weighted MR imaging: pretreatment prediction of response to neoadjuvant chemotherapy in patients with breast cancer. Radiology 2010;257(1):56–63. [DOI] [PubMed] [Google Scholar]
- 29.Iacconi C, Giannelli M, Marini C, et al. The role of mean diffusivity (MD) as a predictive index of the response to chemotherapy in locally advanced breast cancer: a preliminary study. Eur Radiol 2010;20(2):303–308. [DOI] [PubMed] [Google Scholar]
- 30.Fangberget A, Nilsen LB, Hole KH, et al. Neoadjuvant chemotherapy in breast cancer-response evaluation and prediction of response to treatment using dynamic contrast-enhanced and diffusion-weighted MR imaging. Eur Radiol 2011;21(6):1188–1199. [DOI] [PMC free article] [PubMed] [Google Scholar]
- 31.Bedair R, Priest AN, Patterson AJ, et al. Assessment of early treatment response to neoadjuvant chemotherapy in breast cancer using non-mono-exponential diffusion models: a feasibility study comparing the baseline and mid-treatment MRI examinations. Eur Radiol 2017;27(7):2726–2736. [DOI] [PMC free article] [PubMed] [Google Scholar]
- 32.Che S, Zhao X, Ou Y, et al. Role of the intravoxel incoherent motion diffusion weighted imaging in the pre-treatment prediction and early response monitoring to neoadjuvant chemotherapy in locally advanced breast cancer. Medicine (Baltimore) 2016;95(4):e2420. [DOI] [PMC free article] [PubMed] [Google Scholar]
- 33.Rahbar H, Kurland BF, Olson ML, et al. Diffusion-weighted breast magnetic resonance imaging: a semiautomated voxel selection technique improves interreader reproducibility of apparent diffusion coefficient measurements. J Comput Assist Tomogr 2016;40(3):428–435. [DOI] [PMC free article] [PubMed] [Google Scholar]
- 34.Stephen RM, Jha AK, Roe DJ, et al. Diffusion MRI with semi-automated segmentation can serve as a restricted predictive biomarker of the therapeutic response of liver metastasis. Magn Reson Imaging 2015;33(10):1267–1273. [DOI] [PMC free article] [PubMed] [Google Scholar]
Associated Data
This section collects any data citations, data availability statements, or supplementary materials included in this article.