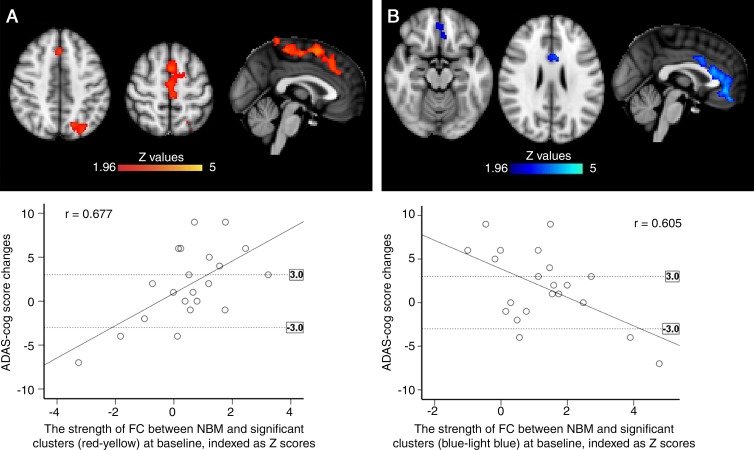
Figure 5:
Images show correlation between baseline functional connectivity (FC) mapping of nucleus basalis of Meynert (NBM) cholinergic network (hereafter, NBM FC) and changes of cognitive performance assessed by Alzheimer’s Disease Assessment Scale-Cognitive subscale (ADAS-Cog) over 6 months of treatment with cholinesterase inhibitor. A, Positive correlation between ADAS-Cog change (posttreatment minus pretreatment; positive difference represents worsening cognition) and baseline NBM FC (red) in patients with mild cognitive impairment (MCI). Scatterplot illustrates positive correlation for significant clusters. B, Negative correlation between changes of ADAS-Cog and NBM FC (blue) at baseline in patients with MCI. Scatterplot shows negative correlation in significant clusters. Dotted lines in scatterplots indicate three-point change (improve/decline) on ADAS-Cog, which is considered as clinically relevant. All analyses were controlled for age and mean relative displacement. All results were masked by gray matter masks obtained from Montreal Neurological Institute 152 standard-space T1-weighted average structural template image. Significance level was at corrected P ˂ .05.

