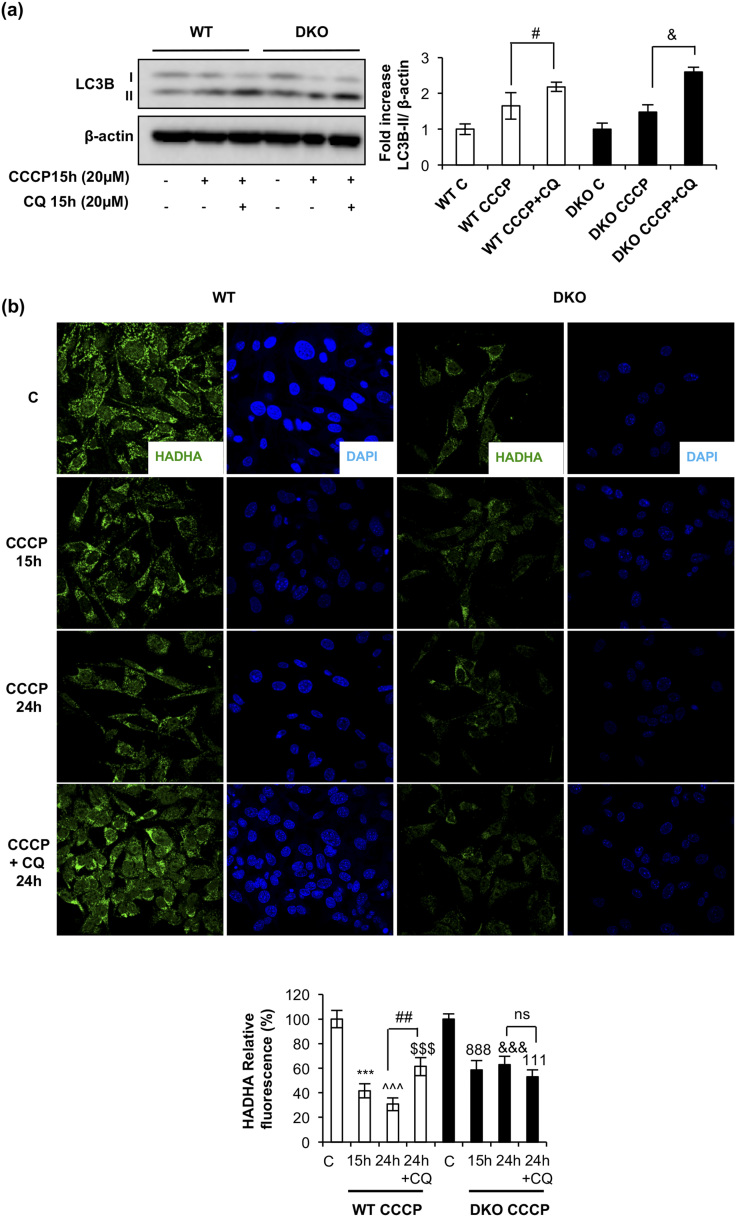
Figure 3.
Impaired mitophagic flux in DKO brown preadipocytes. (a) Representative Western blots analyzing LC3B protein levels in response to CCCP for 15 hours in the presence or absence of CQ, comparing brown preadipocytes WT and DKO, with the respective quantitation. Results are presented as mean ± standard error of the mean (SEM). Statistical significance was assessed by two-tailed Student t test; #P < 0.05 between CCCP and CCCP+CQ groups in WT preadipocytes (n = 3) and &P < 0.05 between CCCP and CCCP+CQ groups in DKO preadipocytes (n = 3). (b) Immunofluorescence for HADHA protein from brown preadipocytes WT and DKO in response to the indicated CCCP treatment, followed by CQ stimulation where indicated. All images were taken at ×63 magnification. The relative fluorescence intensity, as detailed in the Materials and Methods section, was quantified and represented in the contiguous graph. Results were represented as mean ± SEM. Statistical significance was assessed by two-tailed Student t test; ***P < 0.001 between WT control and WT with CCCP for 15 hours (n = 4); ^^^P < 0.001 between WT control and WT with CCCP for 24 hours (n = 4); $$$P < 0.001 between WT control and WT with CCCP and CQ for 24 hours (n = 4); ##P < 0.01 between WT with CCCP for 24 hours and WT with CCCP and CQ for 24 hours (n = 4); 888P < 0.001 between DKO control and DKO with CCCP for 15 hours (n = 4); &&&P < 0.001 between DKO control and DKO with CCCP for 24 hours (n = 4); 111P < 0.001 between DKO control and DKO with CCCP and CQ for 24 hours (n = 4); not significant (ns) between DKO with CCCP for 24 hours and DKO with CCCP and CQ for 24 hours (n = 4).

