

Abstract
Neurons in the lateral hypothalamic area that express hypocretin (Hcrt) neuropeptides help regulate many behaviors including wakefulness and reward seeking. These neurons project throughout the brain, including to neural populations that regulate wakefulness, such as the locus coeruleus (LC) and tuberomammilary nucleus (TMN), as well as to populations that regulate reward, such as the nucleus accumbens (NAc) and ventral tegmental area (VTA). To address the roles of Hcrt neurons in seemingly disparate behaviors, it has been proposed that Hcrt neurons can be anatomically subdivided into at least two distinct subpopulations: a “medial group” that projects to the LC and TMN, and a “lateral group” that projects to the NAc and VTA. Here, we use a dual retrograde tracer strategy to test the hypotheses that Hcrt neurons can be classified based on their downstream projections and medial/lateral location within the hypothalamus. We found that individual Hcrt neurons were significantly more likely to project to both the LC and TMN or to both the VTA and NAc than would be predicted by chance. In contrast, we found that Hcrt neurons that projected to the LC or TMN were mostly distinct from Hcrt neurons that projected to the VTA or NAc. Interestingly, these two populations of Hcrt neurons are intermingled within the hypothalamus and cannot be classified into medial or lateral groups. These results suggest that Hcrt neurons can be distinguished based on their downstream projections but are intermingled within the hypothalamus.
Keywords: Hypocretin, Orexin, Locus Coeruleus, Nucleus Accumbens, Tuberomammilary Nucleus, Ventral Tegmental Area, RRID:AB_2315019
Graphical Abstract
A substantial number of hypocretin neurons send bifurcating projections to the nucleus accumbens and ventral tegmental area. A separate group of hypocretin neurons send bifurcating projections to the locus coeruleus and tuberomammilary nucleus. Both groups of neurons are intermingled within the hypocretin field. Other bifurcating projections from hypocretin neurons to these four downstream populations occur much more rarely.
1. Introduction
The hypocretins (Hcrts) consist of a pair of neuropeptides, hypocretin-1 and hypocretin-2 (also known as orexin A and orexin B, respectively), that are processed from the same genetic precursor, preprohypocretin (de Lecea et al., 1998; Sakurai et al., 1998). In mammals, neurons that express Hcrts are located in the hypothalamus with species-specific expression patterns (Nixon & Smale, 2007; Swanson, Sanchez-Watts, & Watts, 2005). Most Hcrt neurons are glutamatergic and cause excitatory effects on their postsynaptic targets (Date et al., 1999; de Lecea et al., 1998; Rosin, Weston, Sevigny, Stornetta, & Guyenet, 2003; van den Pol, Gao, Obrietan, Kilduff, & Belousov, 1998). Through their downstream connections, Hcrt neurons regulate many behaviors and physiological processes (Graebner, Iyer, & Carter, 2015) and play an especially prominent role in regulating wakefulness and reward seeking behaviors (A. Adamantidis & de Lecea, 2008; Alexandre, Andermann, & Scammell, 2013; Carter, Borg, & de Lecea, 2009; Harris & Aston-Jones, 2006).
The role of Hcrt neurons in promoting wakefulness was first demonstrated by the finding that dysregulation of Hcrt neurons or their downstream receptors causes the sleep disorder narcolepsy (Chemelli et al., 1999; Lin et al., 1999; Nishino, Ripley, Overeem, Lammers, & Mignot, 2000; Thannickal et al., 2000). Indeed, loss of function of Hcrt neurons causes a decrease in wakefulness (Sasaki et al., 2011; Tabuchi et al., 2014; Tsunematsu et al., 2011), while intracerebroventricular injection of hypocretin-1 or stimulation of Hcrt neurons causes an increase in total wake time and frequency of sleep-to-wake transitions (A. R. Adamantidis, Zhang, Aravanis, Deisseroth, & de Lecea, 2007; Carter, Adamantidis, Ohtsu, Deisseroth, & de Lecea, 2009; Piper, Upton, Smith, & Hunter, 2000; Sasaki et al., 2011). To regulate wakefulness, Hcrt neurons project to a variety of downstream populations known to promote wakefulness and arousal, including the locus coeruleus (LC) and tuberomammilary nucleus (TMN) (Graebner et al., 2015; Peyron et al., 1998). Hcrt neuropeptides cause an increase in wakefulness when selectively microinjected into the LC (Hagan et al., 1999; Horvath et al., 1999; Walling, Nutt, Lalies, & Harley, 2004) or TMN (Huang et al., 2001; Ishizuka, Yamamoto, & Yamatodani, 2002; Schone et al., 2012). These two downstream structures also play a necessary role in Hcrt-mediated effects on wakefulness, as effects on wakefulness are diminished when there is loss of function in the LC (Carter et al., 2012; Chen et al., 2010; Choudhary, Khanday, Mitra, & Mallick, 2014) or TMN (Huang et al., 2001).
The role of Hcrt neurons in promoting reward seeking behaviors and cue-induced reinstatement has been established for a variety of drugs of abuse including cocaine (Borgland, Taha, Sarti, Fields, & Bonci, 2006; Boutrel et al., 2005; Harris, Wimmer, & Aston-Jones, 2005; Smith, See, & Aston-Jones, 2009; Smith, Tahsili-Fahadan, & Aston-Jones, 2010), ethanol (Mayannavar, Rashmi, Rao, Yadav, & Ganaraja, 2014, 2016; Shoblock et al., 2011; Srinivasan et al., 2012), nicotine (Dehkordi et al., 2017; Hollander, Lu, Cameron, Kamenecka, & Kenny, 2008; LeSage, Perry, Kotz, Shelley, & Corrigall, 2010; Plaza-Zabala, Martin-Garcia, de Lecea, Maldonado, & Berrendero, 2010), morphine (Georgescu et al., 2003; Harris et al., 2005; Harris, Wimmer, Randall-Thompson, & Aston-Jones, 2007; Narita et al., 2006; Sharf, Guarnieri, Taylor, & DiLeone, 2010; Sharf, Sarhan, & Dileone, 2008; Zarepour, Fatahi, Sarihi, & Haghparast, 2014), and heroin (Smith & Aston-Jones, 2012). These effects are thought to be mediated by direct projections to both components of the mesolimbic reward circuit, the ventral tegmental area (VTA) (Baimel & Borgland, 2015; Borgland, Storm, & Bonci, 2008; Borgland et al., 2006; España, Melchior, Roberts, & Jones, 2011; España et al., 2010; Hrabovszky et al., 2013; Muschamp et al., 2014; Srinivasan et al., 2012; Taslimi et al., 2012; Zarepour et al., 2014) and the nucleus accumbens (NAc) (Mayannavar et al., 2014, 2016; Mori, Kim, & Sasaki, 2011; Mukai et al., 2009; Sharf et al., 2008; Thorpe & Kotz, 2005).
To address the potentially dichotomous functions of Hcrt neurons in regulating both wakefulness and reward seeking behaviors, it has been proposed that Hcrt neurons can be anatomically subdivided into at least two separate subpopulations: one subpopulation is thought to reside in the medial Hcrt field and send projections to the LC and TMN; the other subpopulation is thought to reside in the lateral Hcrt field and send projections to the VTA and NAc (Harris & Aston-Jones, 2006). The hypothesis that medial Hcrt neurons mediate wakefulness is based on the observation that Fos, an indirect marker of neuronal activation, is preferentially expressed in medial Hcrt neurons during the active versus the inactive period (Estabrooke et al., 2001).
In contrast, the hypothesis that lateral Hcrt neurons mediate reward seeking is based on observations that Fos is expressed specifically in lateral Hcrt neurons following environmental cues conditioned with food or drug reward (Harris et al., 2005). Additionally, Fos is preferentially expressed in lateral Hcrt neurons following morphine administration, and these neurons project to the VTA (Richardson & Aston-Jones, 2012). In contrast, recent studies have shown that LC and VTA-projecting Hcrt neurons located in equal frequencies in the lateral and medial subdivisions of the Hcrt field (España, Reis, Valentino, & Berridge, 2005; Gonzalez, Jensen, Fugger, & Burdakov, 2012). Fos expression was observed in both lateral and medial Hcrt neurons in response to administration of antipsychotic drugs and to environmental stimuli causing positive reinforcement (Fadel, Bubser, & Deutch, 2002; McGregor, Wu, Barber, Ramanathan, & Siegel, 2011). Interestingly, Hcrt neurons can be functionally subdivided based on their electrophysiological properties (Schone, Venner, Knowles, Karnani, & Burdakov, 2011); however, retrograde tracers injected into either the LC or VTA do not seem to preferentially label either electrically active class of Hcrt neurons (Gonzalez et al., 2012). Hcrt neurons send bifurcating projections to the LC and basal forebrain (España et al., 2005), as well as to the paraventricular thalamic nucleus and NAc (E. Y. Lee & Lee, 2016), suggesting that specific Hcrt neurons could be classified based on collateral downstream projection patterns. However, it is unknown whether Hcrt neurons can be identified based on collateral projections to downstream populations, and the identification of lateral versus medial populations of Hcrt neurons remains unresolved.
The goal of this study was to test the hypothesis that Hcrt neurons can be classified by bifurcating downstream projections to the LC and VTA or to the NAc and VTA, and to further analyze whether Hcrt neurons projecting to these areas could be categorized by lateral/medial location within the Hcrt field. Specifically, we asked four overall questions: (1) Are individual Hcrt neurons likely to project to both the LC and TMN? (2) Are individual Hcrt neurons likely to project to both the VTA and NAc? (3) Are individual Hcrt neurons that project to the LC or TMN less likely to also project to the NAc and VTA (and vice versa)? (4) Finally, do Hcrt neurons that project to the LC, TMN, NAC, or VTA, or different combinations of these downstream nuclei, exhibit lateral/medial topography within the hypothalamus?
To answer these questions, we used a dual retrograde tracer approach by unilaterally injecting a green retrograde tracer into one downstream projection of Hcrt neurons and a red retrograde tracer into a separate downstream projection (Figure 1a–c). For each experiment, we hypothesized multiple potential outcomes: green and red retrograde signal could be located in distinct Hcrt neurons, each exhibiting a lateral or medial bias within the hypothalamus (Figure 1d); green and red retrograde signal could be located in distinct Hcrt neurons, with no lateral or medial bias (Figure 1e); green and red retrograde signal could be located in the same Hcrt neurons, with no lateral or medial bias (Figure 1f); green and red retrograde signal could be located in the same Hcrt neurons, with either a lateral or medial bias (Figure 1g). This dual retrograde tracer approach resolves the question of how Hcrt neurons can be classified based on downstream projections and lateral/medial topography.
Figure 1.

Potential outcomes of experiments to test for subpopulations of Hcrt neurons. (a) Representative coronal brain section immunolabeled for Hcrt neurons, showing precise location of Hcrt-positive neurons in the lateral hypothalamic area. (b) Higher power magnification of the full Hcrt field. (c) Dual retrograde tracer injection strategy. For each animal, a green retrograde tracer and a red retrograde tracer was injected into two distinct downstream brain regions to retrogradely label individual populations of Hcrt neurons. (d–g) Four potential outcomes for dual retrograde tracer experiments: (d) Hcrt neurons can be classified as projecting to two distinct downstream regions, with each population exhibiting a lateral or medial location bias; (e) Hcrt neurons can be classified as projecting to two distinct downstream regions, with no population exihibing a lateral or medial location bias; (f) Hcrt neurons send bifurcating projections to two distinct downstream regions, with no demonstration of lateral or medial location bias; (g) Hcrt neurons send bifurcating projections to two distinct downstream regions, with demonstration of a lateral or medial location bias. Grey ovals represent Hcrt neurons; green or red ovals represent green or red retrogradely labeled Hcrt neurons, respectively; white ovals represent dual labeled Hcrt neurons. fx, fornix. Scale bar = 250 μm.
2. Materials and Methods
2.1 Animals
All experiments were approved by the Institutional Animal Care and Use Committee at Williams College and were performed in accordance with the guidelines described in the U.S. National Institutes of Health Guide for the Care and Use of Laboratory Animals as well as the U.S. Public Health Service’s Policy on Humane Care and use of Laboratory Animals. We used male mice bred on a C57Bl/6 background. All mice were 7–9 weeks old at the time of surgery and perfused exactly 7 days following surgery. Mice were housed in individual cages with a 12h/12h light/dark cycle at 22 °C.
2.2 Stereotaxic surgery
Mice were anaesthetized with 4% isoflurane and placed on a stereotaxic frame (David Kopf Instruments). Once on the frame and throughout the remainder of surgical procedures, mice received 1–2% isoflurane trans-nasally. After the skull was exposed and leveled in the horizontal plane, green or red retrobeads (Lumofluor) were injected into the right LC, NAc, TMN, or VTA (Table 1). Per the recommendation of the manufacturer, red retrobeads were diluted 1:2 in 0.9% sterile saline solution and green retrobeads were undiluted. A total of 0.20 μl of retrobeads was injected at a rate of 0.10 μl/min using a microsyringe (Hamilton, #7105) controlled by an automated micropump (World Precision Instruments). For injections into the LC or NAc, the microsyringe was raised 100 μm immediately following the injection to allow for more dorsoventral spread of the tracer. For all injection sites, the microsyringe was not removed for an additional 8–10 min post-injection to allow the tracer time to diffuse. After withdrawal of the microsyringe delivering the first retrograde tracer, the second retrograde tracer was injected using a separate syringe into the same animal. Following surgical procedures, mice recovered for seven days to allow for retrograde transport prior to perfusion.
Table 1.
Stereotaxic injection coordinates relative to bregma.
| Structure | Anteroposterior (mm) | Mediolateral (mm) | Dorsoventral (mm) |
|---|---|---|---|
| LC | −5.3 | 0.9 | −4.0 |
| NAc | +0.9 | 1.2 | −4.5 |
| TMN | −2.7 | 1.0 | −5.5 |
| VTA | −3.1 | 0.4 | −4.8 |
2.3 Histology
Seven days following stereotaxic surgery, mice were anaesthetized with intraperitoneal injection of 2,2,2 tribromoethanol (Sigma, #48402) dissolved in Tert-amyl alcohol and sterile 0.9% saline. Mice were then transcardially perfused with cold 0.01M phosphate buffered saline (PBS), pH 7.4, followed by 4% paraformaldehyde in PBS. The brains were extracted, allowed to postfix overnight in 4% paraformaldehyde at 4 °C, and cryoprotected in 30% sucrose dissolved in PBS for an additional 24 h at 4 °C. Each brain was sectioned at 30 μm in the coronal plane on a microtome (Leica Microsystems). Sections were stored in PBS for no more than two days prior to immunohistochemical procedures.
To identify Hcrt neurons using immunohistochemistry, sections were washed three times in PBS with 0.2% Triton X-100 (PBST) for 10 min at room temperature. Sections were then incubated in a blocking solution composed of PBST with 3% normal donkey serum (Jackson ImmunoResearch, #017-000-121) for 15 min at room temperature. For primary antibody exposure, sections were incubated in rabbit anti-Orexin-A (1:1000; Phoenix Pharmaceuticals #H-003-30) in blocking solution overnight at 4 °C. After three 5-min washes in blocking solution, sections were incubated in Alexa Fluor 350 donkey anti-rabbit (1:250; Life Technologies, #A10039) in block solution for 1 h at room temperature. Finally, sections were washed three times in PBS. Brain sections were mounted in PBS onto SuperFrost Plus glass slides (VWR, #48311-703), coverslipped with Fluoromount-G (Southern Biotech, #0100-01), and stored in the dark at 4 °C before microscopy and imaging.
2.4 Antibody characterization
To visually identify Hcrt neurons using immunohistochemistry, we used a rabbit polyclonal antibody against Orexin A (Phoenix Pharmaceuticals #H-003-30; Lot # 01651-6; RRID:AB_2315019). The manufacturer reports this antibody shows 100% cross reactivity with Orexin A from human, rat, mouse, porcine, ovine, bovine, and monkey, and 0% cross reactivity with Orexin B and other neuropeptides including agouti-related peptide, α-MSH, and leptin, as determined by competitive radioimmunoassay and enzyme immunoassay (EIA). The manufacturer also reports that this antibody recognizes bands of 15 kDa and 3.5 kDa molecular weight, representing prepro-ORX-A and ORX-A respectively, on immunoblots of rat brain. A previous study used a dot blot assay to demonstrate that this antibody was specific to Orexin A but showed no cross reactivity with a panel of 21 other neuropeptides expressed in the hypothalamus (Fronczek, Lammers, Balesar, Unmehopa, & Swaab, 2005). Pre-adsorption with ORX-A peptide eliminates staining from hamster (Helwig et al., 2006) and human brain (Fronczek et al., 2007). This antibody was used in previous studies to visually identify Hcrt neurons using immunohistochemistry (Fronczek et al., 2005; Fronczek et al., 2007; Fronczek et al., 2012; Hamlin, Newby, & McNally, 2007; S. Lee, Lee, Elias, & Elmquist, 2009; Satoh et al., 2006; Solomon, De Fanti, & Martinez, 2007). In our experiments, immunolabeled cells were confined to the lateral hypothalamic area (Figure 1a), consistent with the well-documented expression pattern of Hcrt neurons in mice.
2.5 Microscopy and data analysis
Specimens were examined using an Eclipse 80i epifluorescent microscope (Nikon). To image in the blue spectrum, we used a Nikon 96310 UV-2E filter cube with 360nm emission (40nm bandpass) and 460nm barrier (50nm bandpass). To image in the green spectrum, we used a Nikon 96320 FITC filter cube with 480 nm emission (40 nm bandpass) and 535 nm barrier (50 nm bandpass). To image in the red spectrum, we used a Nikon 96365 mCH/TR filter cube with 560 nm emission (40nm bandpass) and a 630 nm barrier (75 nm bandpass). Throughout the data analysis, specimens were routinely surveyed for possible crosstalk between fluorescent channels, and no crossover was detected.
Quantification of colocalization of retrograde signal and Hcrt immunolabeling in the hypothalamus was performed on brain sections from approximately −1.23 to −1.91 mm from Bregma (exactly 21 serial sections per mouse) such that every section through the Hcrt population was included. Cell counts were performed by an investigator (MI or MEC) blinded to the identity of the injection sites. Quantification of single labeled, double labeled, or triple labeled neurons was performed using the microscope (i.e. not based off digital images) using 10x or 20x objectives. We considered cells to be double or triple labeled if the green or red retrograde signal was substantially brighter than background fluorescence and conformed to the shape of a blue immunolabelled Hcrt neuron. In initial experiments, we also confirmed colocalization between retrograde signal and Hcrt immunostaining in the same cell using z-stack analysis with an Observer Z1 epifluorescent microscope with Zen 2012 imaging software (Zeiss), however, due to the general distribution of Hcrt neurons within a single brain section, colocalization of retrograde signal with Hcrt neurons was determined to be accurate by adjusting the focus within the plane of the section. All quantification was performed on the Hcrt field ipsilateral to the injection sites.
To quantify the lateral versus medial distribution of retrogradely labeled Hcrt neurons, we used the fornix as a consistent anatomical reference point within each coronal section to divide the Hcrt field into lateral and medial subpopulations (as opposed to fixed mediolateral coordinates throughout the rostrocaudal axis), consistent with previous studies (Fadel et al., 2002; Gonzalez et al., 2012; Kessler, Stanley, Frederick-Duus, & Fadel, 2011; Williams, Alexopoulos, Jensen, Fugger, & Burdakov, 2008). Because we quantified immunolabelled cells versus a defined three-dimensional volume of brain tissue, and because the fornix serves as a reliable anatomical marker across the rostrocaudal axis, we did not employ further stereological analysis.
All cell counts were corrected for potential double counting using Abercrombie’s formula, N = n(T/T+D) in which N = the corrected cell count, n = the observed cell count, T = the section thickness (30 μm), and D = the diameter of the cell (Guillery, 2002). We estimated the diameter of a Hcrt neuron as 27.5 μm based on previous measurements (Peyron et al., 1998). Because red or green retrobeads tended to completely fill the cytoplasm, we also estimated the diameter of red or green retrogradely labeled neurons to be 27.5 μm.
Images were captured using a RETIGNA 2000R digital camera. Digital images were minimally processed using Photoshop CS5 (Adobe Systems) to enhance the brightness and contrast for optimal representation of the data. All digital images were processed in the same way between experimental conditions to avoid artificial manipulation between different datasets. Representative images for data presentation in Figures were taken from a consistent coronal plane, approximately bregma = −1.55 mm. For wide-field images of coronal brain sections, individual photomicrographs were taken and montaged together in Adobe Photoshop CS5.
To visually depict and compare injection sites across animals, injection areas (visible as a bright fluorescent signal) were overlaid and traced onto a single coronal brain diagram (LC, bregma = 5.30 mm; NAc, bregma = 0.90 mm; TMN, bregma = 2.70 mm; VTA, bregma = −3.10 mm) in Adobe Photoshop CS5. To standardize injection site analysis across different brains, we used the fourth ventricle as an anatomical reference point for the LC, the lateral ventricles and anterior commissure as reference points for the NAc, the third ventricle and dorsal third ventricle as reference points for the TMN, and the medial mammillary nucleus and interpeduncular nucleus as reference points for the VTA. We analyzed and presented injection sites relative to observable anatomical landmarks based on conventional mouse brain atlases (Dong, 2008; Paxinos & Franklin, 2004). Only animals for which both green and red tracer injection sites showed good accuracy and precision were included in the data analysis (about one out of every three animals).
2.6 Statistics
Statistical tests included a paired t-test, an unpaired t-test, Chi-squared tests, and two-way ANOVA without repeated measures, as described in the Results.
To assess the degree to which Hcrt neurons project to either one, both, or neither downstream population, we compared expected and observed numbers of Hcrt neurons using Chi-squared tests. We obtained the expected number by assuming that projections to the two downstream populations are independent events. Under independence, the probability of projecting to both populations is given by the product of the probability of projecting to one population times the probability of projecting to the other population. As a consequence, under independence, the expected number of Hcrt neurons that project to both populations is given by (# green retrolabeled Hcrt neurons) x (# red retrolabeled Hcrt neurons)/(# total Hcrt neurons). Table 2 shows the method used to determine expected counts from observed counts in each experiment. For each experiment we used the observed counts for all four possible outcomes: (red+/green+; red+/green–; red–/green+; red–/green–). We ran a Chi-squared test of independence for each pairwise comparison of two downstream populations. To adjust for the fact that we made a total of 6 such comparisons, we multiplied the p-value from the Chi-squared test by 6 (Bonferroni adjustment).
Table 2.
Observed and expected frequencies for Chi squared analysis†.
| Observed frequencies | Expected (under independence) frequencies | ||||||||
|---|---|---|---|---|---|---|---|---|---|
| Population 2 | Population 2 | ||||||||
| Projecting (red) | Not projecting | Projecting (red) | Not projecting | ||||||
|
|
|
||||||||
| Population 1 | Projecting (green) | a | b | e | Population 1 | Projecting (green) | e*g/N | e*h/N | e |
| Not projecting | c | d | f | Not projecting | f*g/N | f*h/N | f | ||
|
|
|
||||||||
| g | h | N | g | h | N | ||||
We defined a as the number of neurons that are labeled both green and red, b the number that are labeled solely green, c the number of neurons that are labeled solely red, d the number of unlabeled (non-projecting) neurons, with N the total number of Hcrt neurons for a given experiment. e, f and g, h are the row and column sums, respectively. The left table shows observed frequencies; the right table shows the frequencies we would expect to see if projections to population 1 and population 2 are independent.
3. Results
3.1 Red and green retrograde tracers label Hcrt neurons with equivalent efficiencies
Before performing retrolabeling experiments, we compared the efficiencies of red and green retrograde tracers. To compare the relative efficiencies, we injected either green (Figure 2a–d) or red (Figure 2e–h) retrograde tracers into the LC and quantified the number of retrogradely labeled Hcrt neurons (n=6 animals per condition). There was no statistical difference between the mean number of green retrogradely labeled Hcrt neurons (110.7 ± 6.9) versus green retrogradely labeled Hcrt neurons (118.2 ± 6.7), suggesting similar efficiencies between green and red retrograde tracers (Figure 2i; unpaired t-test, t10 = 0.78, p = 0.45).
Figure 2.

Equivalent efficiency of green and red retrograde tracers. (a) Injection of green retrograde tracer (diluted 1:2 with 0.9% saline) into the LC and (b–d) photomicrographs of the Hcrt field showing overlap of green retrograde signal and immunolabeled Hcrt neurons. (e) Injection of red retrograde tracer into the LC and (f–h) photomicrographs of the Hcrt field showing overlap of red retrograde signal and immunolabeled Hcrt neurons. (i) Quantification of the number of green versus red retrolabeled Hcrt neurons. Data represent mean ± standard deviation. Black dots represent individual animals (n=6 animals per condition). n.s., not significant; p=0.453. (j) Injection of mixture of green and red retrograde tracer (1:2 dilution) into the LC and (k–m) photomicrographs of the Hcrt field showing overlap of green and red retrograde signal. (n) Quantification of the number of green versus red retrolabeled Hcrt neurons. Data represent mean ± standard deviation. Black dots represent individual animals (n=6 animals per condition). n.s., not significant; p=0.875. Scale bar = 250 μm. fx, fornix.
To further determine the relative efficiencies of green and red retrograde tracers, we injected a mixture of green and red tracers together into the LC of the same animal (n=6 animals; Figure 2j–m). We found greater than 98% of green-labeled neurons also labeled with red tracer and greater than 98% of red-labeled neurons also labeled with green tracer. There was no statistical difference between the mean number of green labeled Hcrt neurons (111.8 ± 5.7) versus red labeled Hcrt neurons (113.2 ± 5.9), indicating similar efficiencies between green and red retrograde tracers (Figure 2n; paired t-test, t5 = 1.51 p = 0.0955). Taken together, the similar efficiency of green or red retrograde tracer allows for the relative quantification of green or red retrogradely labeled Hcrt neurons from different tracer injection sites.
3.2 Hcrt neurons project to the TMN and LC, or the NAc and VTA, with high fidelity
To determine if Hcrt neurons send bifurcating projections to the TMN and LC, we injected green or red retrograde tracers into each downstream population (n=6). Green retrograde tracer injections were accurately targeted to the TMN region (Figures 3a, b). Because the TMN is a small, ventrally located population, some green tracer was observed dorsally toward the lateral hypothalamus. Red retrograde tracer was also accurately targeted to the LC (Figures 3c, d). In 2–3 animals, there was minimal tracer spillover into Barrington’s nucleus (Ba) and the mesencephalic trigeminal nucleus (Me5). These patterns were consistent in the adjacent 4–6 rostrocaudal sections in which tracer spread along the anterior-posterior axis.
Figure 3.

High frequency of bifurcating Hcrt neuronal projections to the TMN and LC. (a) Diagram showing superimposed areas of green retrograde tracer injections into the TMN (bregma = −2.70 mm) across six animals. (b) Representative histological image of green retrograde tracer injection in the TMN. (c) Diagram showing superimposed areas of red retrograde tracer injections into the LC (bregma = −5.30 mm) across six animals. (d) Representative histological image of red retrograde tracer injection in the LC. (e–f) Representative merged images showing (e) green and red retrogradely labeled neurons in the Hcrt field and (f) green and red retrogradely labeled neurons with blue immunolabeled Hcrt neurons. Yellow arrows indicate Hcrt-expressing neurons co-labeled with both green and red retrograde signal. (g–j) Higher power images of the respective boxes in (e–f) showing (g) a Hcrt-positive neuron with only green retrograde signal, (h) a Hcrt-positive neuron with only red retrograde signal, (i) a Hcrt-positive neuron with both green and red retrograde signal, and (j) a Hcrt-positive neuron with no retrograde signal. (k) Expected and observed percentages of projecting Hcrt neurons with only red, only green, or both red and green retrograde signal. Expected percentages were calculated under the assumption that projections to the two populations are independent. ***p<0.0001, Chi Squared test comparing expected and observed numbers of Hcrt neurons under the assumption of independent projections to the two populations. Scale bar in a, b, c, d = 500 μm. Scale bar in e, f = 100 μm. See Abbreviations for full anatomical definitions.
As expected, a number of Hcrt neurons were labeled with green or red signal (Table 3 and Figures 3e, f), and we identified Hcrt neurons that expressed only green, only red, both green and red, and neither green nor red signal (Figures 3g–j). To test the null hypothesis that projecting to the TMN is independent of projecting to the LC, we compared the expected versus observed frequencies of these four possible outcomes using a Chi-squared test (Table 2). Under independence, we expect 5.2% of retrogradely labeled Hcrt neurons to be labeled both green and red (Figure 3k). In fact, in our experiment, we observed 21.7% dual labeled Hcrt neurons (Figure 3k). Therefore, Hcrt neurons project to both the TMN and LC populations much more frequently than would be expected if they were independent populations (see Table 4 for Chi-squared statistics, p < 0.0001).
Table 3.
Quantification of retrogradely labeled Hcrt neurons.
| Injection sites† | Hcrt neurons | Green retrogradely labeled Hcrt neurons | Red retrogradely labeled Hcrt neurons | Dual labeled Hcrt neurons | |||
|---|---|---|---|---|---|---|---|
| Mean ± standard deviation | Mean ± standard deviation | Percentage of Hcrt neurons | Mean ± standard deviation | Percentage of Hcrt neurons | Mean ± standard deviation | Percentage of Hcrt neurons | |

|
622.8 ± 60.0 | 55.9 ± 5.7 | 9.0 ± 0.85 | 67.3 ± 4.8 | 10.9 ± 0.76 | 22.0 ± 3.4 | 3.5 ± 0.31 |

|
679.1 ± 45.2 | 73.7 ± 5.3 | 10.9 ± 1.1 | 87.4 ± 10.3 | 12.9 ± 1.9 | 28.3 ± 2.2 | 4.2 ± 0.23 |

|
685.6 ± 87.2 | 95.7 ± 9.0 | 14.0 ± 1.2 | 78.2 ± 10.0 | 11.4 ± 0.6 | 2.2 ± 0.51 | 0.32 ± 0.05 |
|
|
647.0 ± 74.1 | 88.1 ± 7.9 | 13.7 ± 1.7 | 55.9 ± 5.3 | 8.7 ± 0.31 | 2.3 ± 0.6 | 0.35 ± 0.11 |
|
|
644.4 ± 125.5 | 54.8 ± 3.8 | 8.7 ± 1.3 | 69.4 ± 9.2 | 11.0 ± 1.4 | 2.1 ± 0.33 | 0.34 ± 0.12 |
|
|
638.1 ± 91.8 | 64.8 ± 5.9 | 10.3 ± 1.7 | 54.5 ± 5.2 | 8.7 ± 1.1 | 2.7 ± 0.39 | 0.43 ± 0.09 |
n=6 animals for each pair of injection sites.
Table 4.
Chi squared analysis.
| Injection sites† | Sample size (N) | X2 | Degrees of freedom | Multiplicity- adjusted p value |
|---|---|---|---|---|
|
|
3737 | 311.4 | 1 | < 0.0000 |
|
|
4075 | 287.4 | 1 | < 0.0000 |
|
|
4114 | 55.1 | 1 | < 0.0000 |
|
|
3882 | 28.6 | 1 | < 0.0000 |
|
|
3866 | 18.1 | 1 | 0.0001 |
|
|
3828 | 10.7 | 1 | 0.0066 |
n=6 animals for each pair of injection sites.
To determine if Hcrt neurons send bifurcating projections to the NAc and VTA, we injected green or red retrograde tracers into each downstream population (n=6). Green retrograde tracer injections were accurately targeted to the NAc (Figures 4a, b), with most tracer injected into the core region (NAcC) and lateral nucleus accumbens shell (NAcShl). In all six animals, a small amount of tracer was observed dorsally in the caudate putamen (CPu), however, Hcrt neurons do not project to this region (Peyron et al., 1998). Red retrograde tracer was also accurately targeted to the VTA (Figures 4c, d). In one animal there was potential spillover into the median reticular nucleus. These patterns were consistent in the adjacent 4–6 rostrocaudal sections in which tracer spread along the anterior-posterior axis.
Figure 4.

High frequency of bifurcating Hcrt neuronal projections to the NAc and VTA. (a) Diagram showing superimposed areas of green retrograde tracer injections into the NAc (bregma = 0.90 mm) across six animals. (b) Representative histological image of green retrograde tracer injection in the NAc. (c) Diagram showing superimposed areas of red retrograde tracer injections into the VTA (bregma = −3.10 mm) across six animals. (d) Representative histological image of red retrograde tracer injection in the VTA. (e–f) Representative merged images showing (e) green and red retrogradely labeled neurons in the Hcrt field and (f) green and red retrogradely labeled neurons with blue immunolabeled Hcrt neurons. Yellow arrows indicate Hcrt-expressing neurons co-labeled with both green and red retrograde signal. (g–j) Higher power images of the respective boxes in (e–f) showing (g) a Hcrt-positive neuron with only green retrograde signal, (h) a Hcrt-positive neuron with only red retrograde signal, (i) a Hcrt-positive neuron with both green and red retrograde signal, and (j) a Hcrt-positive neuron with no retrograde signal. (k) Expected and observed percentages of projecting Hcrt neurons with only red, only green, or both red and green retrograde signal. Expected percentages were calculated under the assumption that projections to the two populations are independent. ***p<0.0001, Chi Squared test comparing expected and observed numbers of Hcrt neurons under the assumption of independent projections to the two populations. Scale bar in a, b, c, d = 500 μm. Scale bar in e, f = 100 μm. See Abbreviations for full anatomical definitions.
We quantified the number and percentage of Hcrt neurons that were labeled by green or red signal (Table 3 and Figures 4g–j). Under independence, we expect 6.3% of retrogradely labeled Hcrt neurons to be labeled both green and red (Figure 4k). In fact, in our experiment, we observed 21.3% dual labeled Hcrt neurons (Figure 4k), indicating that Hcrt neurons project to both the NAc and VTA more frequently than would be expected if projections were independent (see Table 4 for Chi-squared statistics, p < 0.0001).
Taken together, these dual retrograde tracing experiments indicate that Hcrt neurons project to the LC and TMN, as well as to the NAc and VTA, at a much higher frequency than would be predicted under independence, suggesting a substantial collateral projection pattern for these subpopulations of Hcrt neurons.
3.3 Hcrt neurons that project to the LC or TMN are mostly distinct from Hcrt neurons that project to the NAc or VTA
Because we found that individual Hcrt neurons project to the LC or TMN or to the NAc or VTA at a higher frequency than would be predicted by chance (Figures 3,4), we examined the number of Hcrt neurons that send bifurcating projections to different permutations of these downstream populations. We tested four pairwise combinations of the neural populations previously described: VTA vs. LC (Figure 5), TMN vs. VTA (Figure 6), NAc vs. LC (Figure 7), and NAc vs. TMN (Figure 8). We only included animals in the data analysis that received accurate injection of retrograde tracers into the target regions. As before, there was occasional minor spillover of retrograde tracer into surrounding regions (Figures 5a–d, 6a–d, 7a–d, 8a–d). After confirming injection sites, we compared expected and observed frequencies for the four possible labeling outcomes in each experiment. In contrast to Hcrt neurons that project to the LC and TMN or to the NAc and VTA (Figures 3,4), we found that Hcrt neurons projected to different permutations of these populations less frequently than would be expected under independence (all four Chi-squared tests, p<0.01; for percentages and statistical values, respectively, see Figures 5k, 6k, 7k, 8k and Table 4). For example, comparing VTA and LC populations, we expect 6.7% of retrogradely labeled Hcrt neurons to be labeled both green and red. In fact, in our experiment, we observed only 1.3% dual labeled Hcrt neurons (Figure 5k), indicating that Hcrt neurons project to both the VTA and LC much less frequently than would be expected if projections were independent.
Figure 5.

Low frequency of bifurcating Hcrt neuronal projections to the VTA and LC. (a) Diagram showing superimposed areas of green retrograde tracer injections into the VTA (bregma = −3.10 mm) across six animals. (b) Representative histological image of green retrograde tracer injection in the VTA. (c) Diagram showing superimposed areas of red retrograde tracer injections into the LC (bregma = −5.30 mm) across six animals. (d) Representative histological image of red retrograde tracer injection in the LC. (e–f) Representative merged images showing (e) green and red retrogradely labeled neurons in the Hcrt field and (f) green and red retrogradely labeled neurons with blue immunolabeled Hcrt neurons. Yellow arrows indicate Hcrt-expressing neurons co-labeled with both green and red retrograde signal. (g–j) Higher power images of the respective boxes in (e–f) showing (g) a Hcrt-positive neuron with only green retrograde signal, (h) a Hcrt-positive neuron with only red retrograde signal, (i) a Hcrt-positive neuron with both green and red retrograde signal, and (j) a Hcrt-positive neuron with no retrograde signal. (k) Expected and observed percentages of projecting Hcrt neurons with only red, only green, or both red and green retrograde signal. Expected percentages were calculated under the assumption that projections to the two populations are independent. ***p<0.0001, Chi Squared test comparing expected and observed numbers of Hcrt neurons under the assumption of independent projections to the two populations. Scale bar in a, b, c, d = 500 μm. Scale bar in e, f = 100 μm. See Abbreviations for full anatomical definitions.
Figure 6.

Low frequency of bifurcating Hcrt neuronal projections to the VTA and TMN. (a) Diagram showing superimposed areas of green retrograde tracer injections into the VTA (bregma = −3.10 mm) across six animals. (b) Representative histological image of green retrograde tracer injection in the VTA. (c) Diagram showing superimposed areas of red retrograde tracer injections into the TMN (bregma = −2.70 mm) across six animals. (d) Representative histological image of red retrograde tracer injection in the TMN. (e–f) Representative merged images showing (e) green and red retrogradely labeled neurons in the Hcrt field and (f) green and red retrogradely labeled neurons with blue immunolabeled Hcrt neurons. Yellow arrows indicate Hcrt-expressing neurons co-labeled with both green and red retrograde signal. (g–j) Higher power images of the respective boxes in (e–f) showing (g) a Hcrt-positive neuron with only green retrograde signal, (h) a Hcrt-positive neuron with only red retrograde signal, (i) a Hcrt-positive neuron with both green and red retrograde signal, and (j) a Hcrt-positive neuron with no retrograde signal. (k) Expected and observed percentages of projecting Hcrt neurons with only red, only green, or both red and green retrograde signal. Expected percentages were calculated under the assumption that projections to the two populations are independent. ***p<0.0001, Chi Squared test comparing expected and observed numbers of Hcrt neurons under the assumption of independent projections to the two populations. Scale bar in a, b, c, d = 500 μm. Scale bar in e, f = 100 μm. See Abbreviations for full anatomical definitions.
Figure 7.

Low frequency of bifurcating Hcrt neuronal projections to the NAc and LC. (a) Diagram showing superimposed areas of green retrograde tracer injections into the NAc (bregma = 0.90 mm) across six animals. (b) Representative histological image of green retrograde tracer injection in the NAc. (c) Diagram showing superimposed areas of red retrograde tracer injections into the LC (bregma = −5.30 mm) across six animals. (d) Representative histological image of red retrograde tracer injection in the LC. (e–f) Representative merged images showing (e) green and red retrogradely labeled neurons in the Hcrt field and (f) green and red retrogradely labeled neurons with blue immunolabeled Hcrt neurons. Yellow arrows indicate Hcrt-expressing neurons co-labeled with both green and red retrograde signal. (g–j) Higher power images of the respective boxes in (e–f) showing (g) a Hcrt-positive neuron with only green retrograde signal, (h) a Hcrt-positive neuron with only red retrograde signal, (i) a Hcrt-positive neuron with both green and red retrograde signal, and (j) a Hcrt-positive neuron with no retrograde signal. (k) Expected and observed percentages of projecting Hcrt neurons with only red, only green, or both red and green retrograde signal. Expected percentages were calculated under the assumption that projections to the two populations are independent. ***p<0.0001, Chi Squared test comparing expected and observed numbers of Hcrt neurons under the assumption of independent projections to the two populations. Scale bar in a, b, c, d = 500 μm. Scale bar in e, f = 100 μm. See Abbreviations for full anatomical definitions.
Figure 8.

Low frequency of bifurcating Hcrt neuronal projections to the NAc and TMN. (a) Diagram showing superimposed areas of green retrograde tracer injections into the NAc (bregma = 0.90 mm) across six animals. (b) Representative histological image of green retrograde tracer injection in the NAc. (c) Diagram showing superimposed areas of red retrograde tracer injections into the TMN (bregma = −2.70 mm) across six animals. (d) Representative histological image of red retrograde tracer injection in the TMN. (e–f) Representative merged images showing (e) green and red retrogradely labeled neurons in the Hcrt field and (f) green and red retrogradely labeled neurons with blue immunolabeled Hcrt neurons. Yellow arrows indicate Hcrt-expressing neurons co-labeled with both green and red retrograde signal. (g–j) Higher power images of the respective boxes in (e–f) showing (g) a Hcrt-positive neuron with only green retrograde signal, (h) a Hcrt-positive neuron with only red retrograde signal, (i) a Hcrt-positive neuron with both green and red retrograde signal, and (j) a Hcrt-positive neuron with no retrograde signal. (k) Expected and observed percentages of projecting Hcrt neurons with only red, only green, or both red and green retrograde signal. Expected percentages were calculated under the assumption that projections to the two populations are independent. ***p<0.0001, Chi Squared test comparing expected and observed numbers of Hcrt neurons under the assumption of independent projections to the two populations. Scale bar in a, b, c, d = 500 μm. Scale bar in e, f = 100 μm. See Abbreviations for full anatomical definitions.
Taken together, these experiments demonstrate that Hcrt neurons that project to the LC or TMN are almost entirely anatomically separate from Hcrt neurons that project to the NAc or VTA.
3.4 Hcrt neuronal populations projecting to the LC, NAC, TMN, or VTA are not anatomically segregated into lateral and medial groups
To determine whether Hcrt neurons that project to the LC, NAc, TMN, or VTA are segregated into medial or lateral subpopulations, we quantified the number of retrogradely labeled neurons across all experiments (Figures 3–8) within the lateral or medial Hcrt field. To discriminate between the lateral and medial Hcrt field, we used the fornix as a consistent anatomical landmark in each coronal section (Figure 9a), consistent with previous studies (Fadel et al., 2002; Gonzalez et al., 2012; Kessler et al., 2011; Williams et al., 2008). Retrogradely labeled Hcrt neurons did not show a statistically significant lateral/medial bias within the Hcrt field (Figure 9b; no interaction between injection site and lateral/medial location: two way ANOVA, F3,136 = 0.99, p = 0.4013; n=18 mice per condition). Dual retrogradely labeled Hcrt neurons also did not show a statistically significant lateral/medial bias (Figure 9c; no interaction between injection sits and lateral/medial location: two way ANOVA, F1,20 = 0.7375; p = 0.4006; n=6 mice per condition). Taken together, these data do not support the hypothesis that Hcrt neuronal populations projecting to the LC, NAc, TMN, or VTA are anatomically segregated into lateral and medial groups.
Figure 9.

Hypocretin neurons projecting to the LC, NAc, TMN, or VTA do not segregate into lateral or medial populations. (a) We used the fornix (fx) as a consistent anatomical marker to divide the Hcrt field into lateral and medial populations within each coronal section. (b) The percentage of retrogradely labeled Hcrt neurons in the lateral or medial Hcrt field. Data represent mean ± standard deviation. Black dots represent individual animals (n=18 animals per injection site). (c) The percentage of dual retrogradely labeled Hcrt neurons in the lateral or medial Hcrt field. Data represent mean ± standard deviation. Black dots represent individual animals (n=6 animals per injection sites).
4. Discussion
4.1 Identification of distinct populations of Hcrt neurons based on downstream projections
Our data identify Hcrt neurons that project to both the LC and TMN or to both the VTA and NAc at a higher frequency than would be predicted by independent overlap of retrograde signal (modeled in Figure 1g). In contrast, we show that Hcrt neurons that project to the LC or TMN are unlikely to also project to the VTA or NAc (and vice versa; modeled in Figure 1e). Finally, our data do not support the hypothesis that Hcrt neurons that project to the LC, TMN, VTA, and NAc are anatomically segregated within the lateral or medial Hcrt field (Figure 9). These results are consistent with other studies that identified subpopulations of Hcrt neurons, but did not identify lateral/medial topography within the hypothalamus (España et al., 2005; Gonzalez et al., 2012). Taken together, these data suggest a model in which Hcrt neurons can be classified based on their downstream projections but that these classifications do not show a topographic location within the hypothalamus (Figure 10).
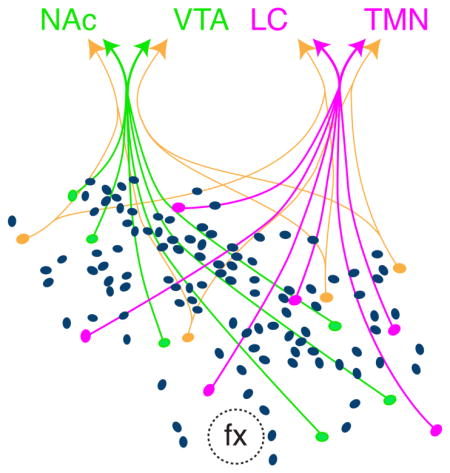
Figure 10.
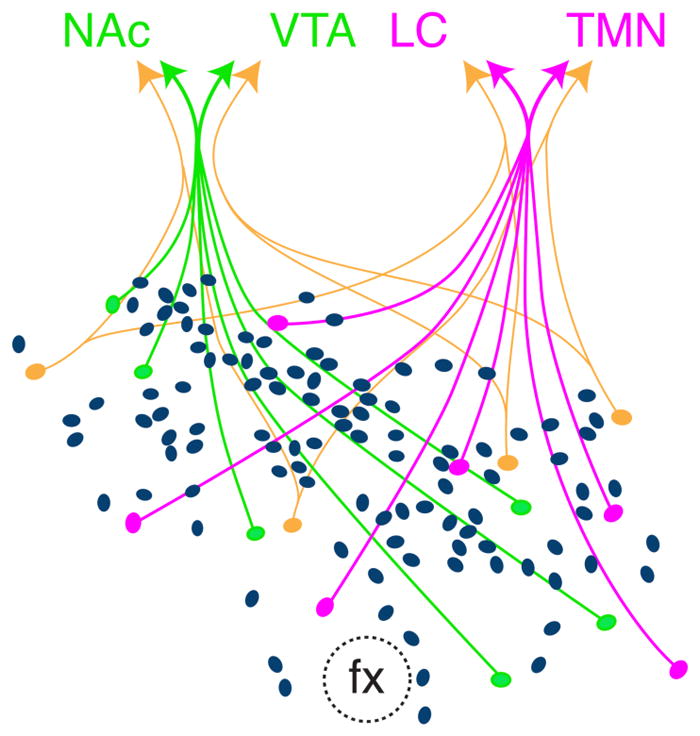
Model depicting subpopulations of Hcrt neurons within the Hcrt field. A substantial subset projects to both the NAc and VTA (green), and another substantial subset to both the LC and TMN (red). A small number of Hcrt neurons (orange) project to different combinations of downstream structures. Not depicted are Hcrt neurons that project to only a single downstream area. Note that the majority of Hcrt neurons do not project to any of the four downstream populations.
It is important to note that although we found that Hcrt neurons project to both the LC and TMN or to the NAc and VTA much more frequently than would be expected by chance (and much more frequently than other permutations of the downstream areas studied), most Hcrt neurons retrogradely labeled from a particular downstream population did not show colocalization with retrograde tracer from the other downstream population. Although we believe there are more dual-projecting Hcrt neuron populations than those observed (see below for technical limitations), our study shows that non-dual projecting Hcrt neurons to the LC and TMN or to the NAC and VTA are more prominent than dual projecting Hcrt neurons (Table 3 and Figures 3k and 4k).
It is also important to note that our study categorized Hcrt neurons based on their downstream projections, not based on their functional activity. Previous studies showing that Hcrt neurons can be classified into lateral/medial groups based on Fos expression during the active/inactive period (Estabrooke et al., 2001), morphine administration (Richardson & Aston-Jones, 2012), or rewarding environmental cues (Harris et al., 2005) are not inconsistent with our present results, and it is possible that Hcrt neurons can be functionally subdivided based on activity but not anatomically subdivided based on projections to the LC, TMN, NAc, and VTA. Furthermore, our study also did not consider other potential classifications of Hcrt neurons within the lateral hypothalamus other than lateral/medial topography, and it is possible that other projection patterns might emerge from different methods of analysis. For example, our immunofluorescent identification of Hcrt neurons did not allow for a formal analysis of cytoarchitecture or the ability to identify different populations of Hcrt neurons based on gene or protein expression. Therefore, our analysis only broadly distinguished between lateral and medial populations across the Hcrt field. Our study also does not account for differential expression of the two downstream Hypocretin receptors, the possibility of differential levels of Hcrt or Hcrt receptor protein expression, or changes in connectivity during different physiological states. It is possible that, during certain physiological or environmental conditions, synaptic strength to some downstream regions are emphasized over others.
Although the LC and TMN are often described as wakefulness/arousal populations and the VTA and NAc are often described as reward populations, wakefulness and reward-seeking behaviors are linked, and these downstream nuclei can indeed regulate behaviors much more broadly. For example, activity in the LC-norepinephrine system is sufficient to cause cue-induced reinstatement of reward seeking (Al-Hasani, McCall, Foshage, & Bruchas, 2013; Mi et al., 2017; Shaham, Highfield, Delfs, Leung, & Stewart, 2000). Likewise, stimulants that enhance VTA activity and dopaminergic tone promote wakefulness (Boutrel & Koob, 2004), and activation of the VTA has recently been shown to increase arousal during the presentation of salient and rewarding stimuli (Eban-Rothschild, Rothschild, Giardino, Jones, & de Lecea, 2016). Therefore, distinguishing Hcrt neurons that project to the LC and TMN as “wakefulness projections” and Hcrt neurons that project to the VTA and NAc as “reward projections” is overly simplistic. Nevertheless, the fact that the majority of these projections are segregated suggests that many Hcrt neurons can potentially engage with their targets selectively and specifically.
Finally, it is important to note that our experiments were conducted using mice, whereas many other studies were conducted using rats. Because neurons that express Hcrts show species-specific expression patterns (Nixon & Smale, 2007; Swanson et al., 2005), there may also be differences in the hodological or functional classification of these neurons across species, and indeed across different strains of mice.
4.2 Technical limitations
A technical limitation of this study is the inherent variability in successfully targeting discrete structures with injections of retrograde tracers. Because the LC and TMN are compact structures, we observed occasional minimal spillover into neighboring brain regions (Figure 3a–d). Additionally, the three-dimensional topography of the four neural populations studied makes 100% penetrance of tracer injections challenging. Therefore, the percentage of Hcrt neurons that project to each downstream structure is likely higher than our observations. Because the number of Hcrt neurons labeled with green or red retrograde tracer is likely smaller than the true value of Hcrt neurons that project to each target region, the percentage of Hcrt neurons projecting to two downstream populations is also likely to be greater than our observed values. Therefore, even though we observed 21.7% of retrogradely labeled Hcrt neurons projecting to both the LC and TMN (Figure 3) and 21.3% of retrogradely labeled Hcrt neurons projecting to both the VTA and NAc (Figure 4), the actual percentages of dual labeled Hcrt neurons are likely to be higher than these values.
Injections into the NAc were particularly challenging because of the presence of the lateral ventricles and anterior commissure (ac): in pilot experiments we found that more medial injections spread to other brain regions, likely due to spread through the ventricular system or passage along the commissural fiber tract. Therefore, we biased our injections towards the NAc core (NAcC) and lateral shell (NAcShl). Although previous studies indicate that Hcrt neurons project to the NAcC and NAcShl (Brown, Khoo, & Lawrence, 2013; Peyron et al., 1998), Hcrt neurons send especially dense projections to the medial shell (NAcShm) (Baldo, Daniel, Berridge, & Kelley, 2003; Peyron et al., 1998). In fact, the NAc region can be anatomically divided into many subregions with functional differences. Therefore, this study may have missed functional aspects of NAc topology based on our stereotaxic injection coordinates.
4.3 Categorizing peptidergic hypothalamic systems based on downstream projections
As shown for Hcrt neurons in the present study, other peptidergic hypothalamic neurons have also been reported to be segregated into subpopulations based on their downstream projections. For example, neurons that express agouti-related protein (AgRP) are exclusively expressed in the arcuate nucleus of the hypothalamus and are well known to regulate feeding behavior (Andermann & Lowell, 2017; Sternson & Eiselt, 2017). Using dual retrograde tracers and viral strategies, Betley et al. demonstrated that AgRP neurons could be divided into functional subpopulations based on projections to downstream brain regions that differentially affect feeding (Betley, Cao, Ritola, & Sternson, 2013). Interestingly, unlike Hcrt neurons, AgRP neurons showed almost no collateralization to downstream populations. Instead, AgRP neurons that project to distinct brain regions are subdivided along the anteroposterior axis of the brain. Furthermore, AgRP neurons only project to about ten distinct target populations, while Hcrt neurons project much more diffusely throughout the brain (Peyron et al., 1998). Therefore, classifying Hcrt neurons based on downstream projections is likely to be much more complicated than other neural populations, with potential collateral projections to many downstream brain regions.
Indeed, a major question stemming from our results is the degree to which Hcrt neurons send collateral projections to many other brain regions. Our results suggest that Hcrt neurons that send collateral projections to the LC and TMN or to the VTA and NAc are distinct, but there are likely several other categories of Hcrt neurons, each with distinct collateral projections. España et al. found collateral projections from Hcrt neurons to both the LC and basal forebrain (España et al., 2005), another downstream structure known to promote wakefulness (Han et al., 2014; Hassani, Lee, Henny, & Jones, 2009). It would be interesting to determine the frequency of Hcrt neurons that send bifurcating projections to the LC, basal forebrain, and TMN. In addition to regulating wakefulness and reward-seeking, Hcrt neurons influence many other phenotypes such as stress (Winsky-Sommerer et al., 2004) and sexual behavior, and do so through projections to several additional brain regions (Di Sebastiano, Yong-Yow, Wagner, Lehman, & Coolen, 2010; Muschamp, Dominguez, Sato, Shen, & Hull, 2007). For example, Hcrt neurons are known to influence the behavioral and physiological stress response through projections to the paraventricular thalamic nucleus (Sakamoto, Yamada, & Ueta, 2004; Samson, Taylor, Follwell, & Ferguson, 2002), bed nucleus of the stria terminalis (Lungwitz et al., 2012), and central amygdala (Bisetti et al., 2006), and influence sexual behavior through efferent projections to the median preoptic area (Gulia, Mallick, & Kumar, 2003). Future studies should use these and other functional downstream projections to investigate the possibility of other discrete populations of Hcrt neurons.
Acknowledgments
This research is supported by National Institutes of Health Grant DK105510 from the National Institute of Digestive and Diabetes and Kidney Diseases (NIDDK) and National Science Foundation Grant 1652060 to MEC. We thank A. Carter and N. Goldstein for constructive comments and feedback on the manuscript.
Abbreviations
- 3V
3rd ventricle
- 4V
4th ventricle
- ac
anterior commissure
- Arc
arcuate nucleus
- Ba
Barrington’s nucleus
- CPu
caudate putamen (striatum)
- fr
fasciculus retroflexus
- fx
fornix
- Hcrt
hypocretin
- IF
interfascicular nucleus
- IP
interpeduncular nucleus
- LC
locus coeruleus
- LDTg
laterodorsal tegmental nucleus
- LH
lateral hypothalamus
- Me5
mesencephalic trigeminal nucleus
- MM
medial mammillary nucleus
- MPB
medial parabrachial nucleus
- MRN
midbrain reticular nucleus
- MVe
medial vestibular nucleus
- NAc
nucleus accumbens
- NAcC
nucleus accumbens core region
- NAcShl
nucleus accumbens shell, lateral
- NAcShm
nucleus accumbens shell, medial
- PH
posterior hypothalamic nucleus
- PMD
premammillary nucleus, dorsal
- PMV
premammillary nucleus, ventral
- RLi
rostral linear nucleus
- RM
retromammillary nucleus
- SNR
substantia nigra pars reticulata
- TMN
tuberomammilary nucleus
- VTA
ventral tegmental area
Footnotes
Conflict of Interest
None of the authors have a known or potential conflict of interest including any financial, personal, or other relationships with other people or organizations within 3 years of beginning the submitted work that could inappropriately influence, or be perceived to influence, the work presented in this article.
Author Contributions
All authors contributed significantly to the research that led to preparation of this article. All authors had full access to all the data in the study and take responsibility for the integrity of the data and the accuracy of the data analysis. Study concept and design: MI, MEC. Acquisition of data: MI, RAE, MEC. Analysis and interpretation of data: MI, BK, MEC. Drafting of the manuscript: MI, MEC. Critical revision of the manuscript for important intellectual content: MI, RAE, BK, MEC. Obtained funding: MEC. Study supervision: MEC.
References
- Adamantidis A, de Lecea L. Physiological arousal: a role for hypothalamic systems. Cellular and molecular life sciences: CMLS. 2008;65(10):1475–1488. doi: 10.1007/s00018-008-7521-8. [DOI] [PMC free article] [PubMed] [Google Scholar]
- Adamantidis AR, Zhang F, Aravanis AM, Deisseroth K, de Lecea L. Neural substrates of awakening probed with optogenetic control of hypocretin neurons. Nature. 2007;450(7168):420–424. doi: 10.1038/nature06310. nature06310 [pii] [DOI] [PMC free article] [PubMed] [Google Scholar]
- Al-Hasani R, McCall JG, Foshage AM, Bruchas MR. Locus coeruleus kappa-opioid receptors modulate reinstatement of cocaine place preference through a noradrenergic mechanism. Neuropsychopharmacology: official publication of the American College of Neuropsychopharmacology. 2013;38(12):2484–2497. doi: 10.1038/npp.2013.151. [DOI] [PMC free article] [PubMed] [Google Scholar]
- Alexandre C, Andermann ML, Scammell TE. Control of arousal by the orexin neurons. Current opinion in neurobiology. 2013;23(5):752–759. doi: 10.1016/j.conb.2013.04.008. [DOI] [PMC free article] [PubMed] [Google Scholar]
- Andermann ML, Lowell BB. Toward a Wiring Diagram Understanding of Appetite Control. Neuron. 2017;95(4):757–778. doi: 10.1016/j.neuron.2017.06.014. [DOI] [PMC free article] [PubMed] [Google Scholar]
- Baimel C, Borgland SL. Orexin Signaling in the VTA Gates Morphine-Induced Synaptic Plasticity. J Neurosci. 2015;35(18):7295–7303. doi: 10.1523/JNEUROSCI.4385-14.2015. [DOI] [PMC free article] [PubMed] [Google Scholar]
- Baldo BA, Daniel RA, Berridge CW, Kelley AE. Overlapping distributions of orexin/hypocretin- and dopamine-beta-hydroxylase immunoreactive fibers in rat brain regions mediating arousal, motivation, and stress. The Journal of comparative neurology. 2003;464(2):220–237. doi: 10.1002/cne.10783. [DOI] [PubMed] [Google Scholar]
- Betley JN, Cao ZF, Ritola KD, Sternson SM. Parallel, redundant circuit organization for homeostatic control of feeding behavior. Cell. 2013;155(6):1337–1350. doi: 10.1016/j.cell.2013.11.002. [DOI] [PMC free article] [PubMed] [Google Scholar]
- Bisetti A, Cvetkovic V, Serafin M, Bayer L, Machard D, Jones BE, Muhlethaler M. Excitatory action of hypocretin/orexin on neurons of the central medial amygdala. Neuroscience. 2006;142(4):999–1004. doi: 10.1016/j.neuroscience.2006.07.018. [DOI] [PubMed] [Google Scholar]
- Borgland SL, Storm E, Bonci A. Orexin B/hypocretin 2 increases glutamatergic transmission to ventral tegmental area neurons. The European journal of neuroscience. 2008;28(8):1545–1556. doi: 10.1111/j.1460-9568.2008.06397.x. [DOI] [PubMed] [Google Scholar]
- Borgland SL, Taha SA, Sarti F, Fields HL, Bonci A. Orexin A in the VTA is critical for the induction of synaptic plasticity and behavioral sensitization to cocaine. Neuron. 2006;49(4):589–601. doi: 10.1016/j.neuron.2006.01.016. [DOI] [PubMed] [Google Scholar]
- Boutrel B, Kenny PJ, Specio SE, Martin-Fardon R, Markou A, Koob GF, de Lecea L. Role for hypocretin in mediating stress-induced reinstatement of cocaine-seeking behavior. Proceedings of the National Academy of Sciences of the United States of America. 2005;102(52):19168–19173. doi: 10.1073/pnas.0507480102. [DOI] [PMC free article] [PubMed] [Google Scholar]
- Boutrel B, Koob GF. What keeps us awake: the neuropharmacology of stimulants and wakefulness-promoting medications. Sleep. 2004;27(6):1181–1194. doi: 10.1093/sleep/27.6.1181. [DOI] [PubMed] [Google Scholar]
- Brown RM, Khoo SY, Lawrence AJ. Central orexin (hypocretin) 2 receptor antagonism reduces ethanol self-administration, but not cue-conditioned ethanol-seeking, in ethanol-preferring rats. Int J Neuropsychopharmacol. 2013;16(9):2067–2079. doi: 10.1017/S1461145713000333. [DOI] [PubMed] [Google Scholar]
- Carter ME, Adamantidis A, Ohtsu H, Deisseroth K, de Lecea L. Sleep homeostasis modulates hypocretin-mediated sleep-to-wake transitions. The Journal of Neuroscience. 2009;29(35):10939–10949. doi: 10.1523/JNEUROSCI.1205-09.2009. [DOI] [PMC free article] [PubMed] [Google Scholar]
- Carter ME, Borg JS, de Lecea L. The brain hypocretins and their receptors: mediators of allostatic arousal. Curr Opin Pharmacol. 2009;9(1):39–45. doi: 10.1016/j.coph.2008.12.018. S1471-4892(09)00002-2 [pii] [DOI] [PMC free article] [PubMed] [Google Scholar]
- Carter ME, Brill J, Bonnavion P, Huguenard JR, Huerta R, de Lecea L. Mechanism for Hypocretin-mediated sleep-to-wake transitions. Proceedings of the National Academy of Sciences of the United States of America. 2012;109(39):E2635–2644. doi: 10.1073/pnas.1202526109. [DOI] [PMC free article] [PubMed] [Google Scholar]
- Chemelli RM, Willie JT, Sinton CM, Elmquist JK, Scammell T, Lee C, … Yanagisawa M. Narcolepsy in orexin knockout mice: molecular genetics of sleep regulation. Cell. 1999;98(4):437–451. doi: 10.1016/s0092-8674(00)81973-x. [DOI] [PubMed] [Google Scholar]
- Chen L, McKenna JT, Bolortuya Y, Winston S, Thakkar MM, Basheer R, … McCarley RW. Knockdown of orexin type 1 receptor in rat locus coeruleus increases REM sleep during the dark period. The European journal of neuroscience. 2010;32(9):1528–1536. doi: 10.1111/j.1460-9568.2010.07401.x. [DOI] [PMC free article] [PubMed] [Google Scholar]
- Choudhary RC, Khanday MA, Mitra A, Mallick BN. Perifornical orexinergic neurons modulate REM sleep by influencing locus coeruleus neurons in rats. Neuroscience. 2014;279:33–43. doi: 10.1016/j.neuroscience.2014.08.017. [DOI] [PubMed] [Google Scholar]
- Date Y, Ueta Y, Yamashita H, Yamaguchi H, Matsukura S, Kangawa K, … Nakazato M. Orexins, orexigenic hypothalamic peptides, interact with autonomic, neuroendocrine and neuroregulatory systems. Proceedings of the National Academy of Sciences of the United States of America. 1999;96(2):748–753. doi: 10.1073/pnas.96.2.748. [DOI] [PMC free article] [PubMed] [Google Scholar]
- de Lecea L, Kilduff TS, Peyron C, Gao X, Foye PE, Danielson PE, … Sutcliffe JG. The hypocretins: hypothalamus-specific peptides with neuroexcitatory activity. Proceedings of the National Academy of Sciences of the United States of America. 1998;95(1):322–327. doi: 10.1073/pnas.95.1.322. [DOI] [PMC free article] [PubMed] [Google Scholar]
- Dehkordi O, Rose JE, Davila-Garcia MI, Millis RM, Mirzaei SA, Manaye KF, Jayam-Trouth A. Neuroanatomical Relationships between Orexin/Hypocretin-Containing Neurons/Nerve Fibers and Nicotine-Induced c-Fos-Activated Cells of the Reward-Addiction Neurocircuitry. J Alcohol Drug Depend. 2017;5(4) doi: 10.4172/2329-6488.1000273. [DOI] [PMC free article] [PubMed] [Google Scholar]
- Di Sebastiano AR, Yong-Yow S, Wagner L, Lehman MN, Coolen LM. Orexin mediates initiation of sexual behavior in sexually naive male rats, but is not critical for sexual performance. Horm Behav. 2010;58(3):397–404. doi: 10.1016/j.yhbeh.2010.06.004. [DOI] [PMC free article] [PubMed] [Google Scholar]
- Dong HW. Allen reference atlas: a digital color brain atlas of the C57Black/6J male mouse. Hoboken, N.J: Wiley; 2008. [Google Scholar]
- Eban-Rothschild A, Rothschild G, Giardino WJ, Jones JR, de Lecea L. VTA dopaminergic neurons regulate ethologically relevant sleep-wake behaviors. Nat Neurosci. 2016;19(10):1356–1366. doi: 10.1038/nn.4377. [DOI] [PMC free article] [PubMed] [Google Scholar]
- España RA, Melchior JR, Roberts DC, Jones SR. Hypocretin 1/orexin A in the ventral tegmental area enhances dopamine responses to cocaine and promotes cocaine self-administration. Psychopharmacology. 2011;214(2):415–426. doi: 10.1007/s00213-010-2048-8. [DOI] [PMC free article] [PubMed] [Google Scholar]
- España RA, Oleson EB, Locke JL, Brookshire BR, Roberts DC, Jones SR. The hypocretin-orexin system regulates cocaine self-administration via actions on the mesolimbic dopamine system. The European journal of neuroscience. 2010;31(2):336–348. doi: 10.1111/j.1460-9568.2009.07065.x. [DOI] [PMC free article] [PubMed] [Google Scholar]
- España RA, Reis KM, Valentino RJ, Berridge CW. Organization of hypocretin/orexin efferents to locus coeruleus and basal forebrain arousal-related structures. The Journal of comparative neurology. 2005;481(2):160–178. doi: 10.1002/cne.20369. [DOI] [PubMed] [Google Scholar]
- Estabrooke IV, McCarthy MT, Ko E, Chou TC, Chemelli RM, Yanagisawa M, … Scammell TE. Fos expression in orexin neurons varies with behavioral state. J Neurosci. 2001;21(5):1656–1662. doi: 10.1523/JNEUROSCI.21-05-01656.2001. [DOI] [PMC free article] [PubMed] [Google Scholar]
- Fadel J, Bubser M, Deutch AY. Differential activation of orexin neurons by antipsychotic drugs associated with weight gain. J Neurosci. 2002;22(15):6742–6746. doi: 10.1523/JNEUROSCI.22-15-06742.2002. 20026632. [DOI] [PMC free article] [PubMed] [Google Scholar]
- Fronczek R, Lammers GJ, Balesar R, Unmehopa UA, Swaab DF. The number of hypothalamic hypocretin (orexin) neurons is not affected in Prader-Willi syndrome. J Clin Endocrinol Metab. 2005;90(9):5466–5470. doi: 10.1210/jc.2005-0296. [DOI] [PubMed] [Google Scholar]
- Fronczek R, Overeem S, Lee SY, Hegeman IM, van Pelt J, van Duinen SG, … Swaab DF. Hypocretin (orexin) loss in Parkinson’s disease. Brain: a journal of neurology. 2007;130(Pt 6):1577–1585. doi: 10.1093/brain/awm090. [DOI] [PubMed] [Google Scholar]
- Fronczek R, van Geest S, Frolich M, Overeem S, Roelandse FW, Lammers GJ, Swaab DF. Hypocretin (orexin) loss in Alzheimer’s disease. Neurobiology of Aging. 2012;33(8):1642–1650. doi: 10.1016/j.neurobiolaging.2011.03.014. [DOI] [PubMed] [Google Scholar]
- Georgescu D, Zachariou V, Barrot M, Mieda M, Willie JT, Eisch AJ, … DiLeone RJ. Involvement of the lateral hypothalamic peptide orexin in morphine dependence and withdrawal. J Neurosci. 2003;23(8):3106–3111. doi: 10.1523/JNEUROSCI.23-08-03106.2003. [DOI] [PMC free article] [PubMed] [Google Scholar]
- Gonzalez JA, Jensen LT, Fugger L, Burdakov D. Convergent inputs from electrically and topographically distinct orexin cells to locus coeruleus and ventral tegmental area. The European journal of neuroscience. 2012;35(9):1426–1432. doi: 10.1111/j.1460-9568.2012.08057.x. [DOI] [PMC free article] [PubMed] [Google Scholar]
- Graebner AK, Iyer M, Carter ME. Understanding how discrete populations of hypothalamic neurons orchestrate complicated behavioral states. Front Syst Neurosci. 2015;9:111. doi: 10.3389/fnsys.2015.00111. [DOI] [PMC free article] [PubMed] [Google Scholar]
- Guillery RW. On counting and counting errors. The Journal of comparative neurology. 2002;447(1):1–7. doi: 10.1002/cne.10221. [DOI] [PubMed] [Google Scholar]
- Gulia KK, Mallick HN, Kumar VM. Orexin A (hypocretin-1) application at the medial preoptic area potentiates male sexual behavior in rats. Neuroscience. 2003;116(4):921–923. doi: 10.1016/s0306-4522(02)00877-1. [DOI] [PubMed] [Google Scholar]
- Hagan JJ, Leslie RA, Patel S, Evans ML, Wattam TA, Holmes S, … Upton N. Orexin A activates locus coeruleus cell firing and increases arousal in the rat. Proceedings of the National Academy of Sciences of the United States of America. 1999;96(19):10911–10916. doi: 10.1073/pnas.96.19.10911. [DOI] [PMC free article] [PubMed] [Google Scholar]
- Hamlin AS, Newby J, McNally GP. The neural correlates and role of D1 dopamine receptors in renewal of extinguished alcohol-seeking. Neuroscience. 2007;146(2):525–536. doi: 10.1016/j.neuroscience.2007.01.063. [DOI] [PubMed] [Google Scholar]
- Han Y, Shi YF, Xi W, Zhou R, Tan ZB, Wang H, … Yu YQ. Selective activation of cholinergic basal forebrain neurons induces immediate sleep-wake transitions. Curr Biol. 2014;24(6):693–698. doi: 10.1016/j.cub.2014.02.011. [DOI] [PubMed] [Google Scholar]
- Harris GC, Aston-Jones G. Arousal and reward: a dichotomy in orexin function. Trends in neurosciences. 2006;29(10):571–577. doi: 10.1016/j.tins.2006.08.002. [DOI] [PubMed] [Google Scholar]
- Harris GC, Wimmer M, Aston-Jones G. A role for lateral hypothalamic orexin neurons in reward seeking. Nature. 2005;437(7058):556–559. doi: 10.1038/nature04071. [DOI] [PubMed] [Google Scholar]
- Harris GC, Wimmer M, Randall-Thompson JF, Aston-Jones G. Lateral hypothalamic orexin neurons are critically involved in learning to associate an environment with morphine reward. Behavioural brain research. 2007;183(1):43–51. doi: 10.1016/j.bbr.2007.05.025. [DOI] [PMC free article] [PubMed] [Google Scholar]
- Hassani OK, Lee MG, Henny P, Jones BE. Discharge profiles of identified GABAergic in comparison to cholinergic and putative glutamatergic basal forebrain neurons across the sleep-wake cycle. The Journal of neuroscience: the official journal of the Society for Neuroscience. 2009;29(38):11828–11840. doi: 10.1523/JNEUROSCI.1259-09.2009. [DOI] [PMC free article] [PubMed] [Google Scholar]
- Helwig M, Khorooshi RM, Tups A, Barrett P, Archer ZA, Exner C, … Klingenspor M. PC1/3 and PC2 gene expression and post-translational endoproteolytic pro-opiomelanocortin processing is regulated by photoperiod in the seasonal Siberian hamster (Phodopus sungorus) J Neuroendocrinol. 2006;18(6):413–425. doi: 10.1111/j.1365-2826.2006.01431.x. [DOI] [PubMed] [Google Scholar]
- Hollander JA, Lu Q, Cameron MD, Kamenecka TM, Kenny PJ. Insular hypocretin transmission regulates nicotine reward. Proceedings of the National Academy of Sciences of the United States of America. 2008;105(49):19480–19485. doi: 10.1073/pnas.0808023105. [DOI] [PMC free article] [PubMed] [Google Scholar]
- Horvath TL, Peyron C, Diano S, Ivanov A, Aston-Jones G, Kilduff TS, van Den Pol AN. Hypocretin (orexin) activation and synaptic innervation of the locus coeruleus noradrenergic system. The Journal of comparative neurology. 1999;415(2):145–159. [PubMed] [Google Scholar]
- Hrabovszky E, Molnar CS, Borsay BA, Gergely P, Herczeg L, Liposits Z. Orexinergic input to dopaminergic neurons of the human ventral tegmental area. PloS one. 2013;8(12):e83029. doi: 10.1371/journal.pone.0083029. [DOI] [PMC free article] [PubMed] [Google Scholar]
- Huang ZL, Qu WM, Li WD, Mochizuki T, Eguchi N, Watanabe T, … Hayaishi O. Arousal effect of orexin A depends on activation of the histaminergic system. Proceedings of the National Academy of Sciences of the United States of America. 2001;98(17):9965–9970. doi: 10.1073/pnas.181330998. [DOI] [PMC free article] [PubMed] [Google Scholar]
- Ishizuka T, Yamamoto Y, Yamatodani A. The effect of orexin-A and -B on the histamine release in the anterior hypothalamus in rats. Neuroscience letters. 2002;323(2):93–96. doi: 10.1016/s0304-3940(01)02552-6. [DOI] [PubMed] [Google Scholar]
- Kessler BA, Stanley EM, Frederick-Duus D, Fadel J. Age-related loss of orexin/hypocretin neurons. Neuroscience. 2011;178:82–88. doi: 10.1016/j.neuroscience.2011.01.031. [DOI] [PMC free article] [PubMed] [Google Scholar]
- Lee EY, Lee HS. Dual projections of single orexin- or CART-immunoreactive, lateral hypothalamic neurons to the paraventricular thalamic nucleus and nucleus accumbens shell in the rat: Light microscopic study. Brain research. 2016;1634:104–118. doi: 10.1016/j.brainres.2015.12.062. [DOI] [PubMed] [Google Scholar]
- Lee S, Lee CE, Elias CF, Elmquist JK. Expression of the diabetes-associated gene TCF7L2 in adult mouse brain. The Journal of comparative neurology. 2009;517(6):925–939. doi: 10.1002/cne.22199. [DOI] [PMC free article] [PubMed] [Google Scholar]
- LeSage MG, Perry JL, Kotz CM, Shelley D, Corrigall WA. Nicotine self-administration in the rat: effects of hypocretin antagonists and changes in hypocretin mRNA. Psychopharmacology. 2010;209(2):203–212. doi: 10.1007/s00213-010-1792-0. [DOI] [PMC free article] [PubMed] [Google Scholar]
- Lin L, Faraco J, Li R, Kadotani H, Rogers W, Lin X, … Mignot E. The sleep disorder canine narcolepsy is caused by a mutation in the hypocretin (orexin) receptor 2 gene. Cell. 1999;98(3):365–376. doi: 10.1016/s0092-8674(00)81965-0. [DOI] [PubMed] [Google Scholar]
- Lungwitz EA, Molosh A, Johnson PL, Harvey BP, Dirks RC, Dietrich A, … Truitt WA. Orexin-A induces anxiety-like behavior through interactions with glutamatergic receptors in the bed nucleus of the stria terminalis of rats. Physiology & behavior. 2012;107(5):726–732. doi: 10.1016/j.physbeh.2012.05.019. [DOI] [PMC free article] [PubMed] [Google Scholar]
- Mayannavar S, Rashmi KS, Rao YD, Yadav S, Ganaraja B. Effect of Orexin-A infusion in to the Nucleus Accumbens on consummatory behaviour and alcohol preference in male Wistar rats. Indian J Physiol Pharmacol. 2014;58(4):319–326. [PubMed] [Google Scholar]
- Mayannavar S, Rashmi KS, Rao YD, Yadav S, Ganaraja B. Effect of Orexin A antagonist (SB-334867) infusion into the nucleus accumbens on consummatory behavior and alcohol preference in Wistar rats. Indian J Pharmacol. 2016;48(1):53–58. doi: 10.4103/0253-7613.174528. [DOI] [PMC free article] [PubMed] [Google Scholar]
- McGregor R, Wu MF, Barber G, Ramanathan L, Siegel JM. Highly specific role of hypocretin (orexin) neurons: differential activation as a function of diurnal phase, operant reinforcement versus operant avoidance and light level. J Neurosci. 2011;31(43):15455–15467. doi: 10.1523/JNEUROSCI.4017-11.2011. [DOI] [PMC free article] [PubMed] [Google Scholar]
- Mi W, Wang S, You Z, Lim G, McCabe MF, Kim H, … Mao J. Nortriptyline Enhances Morphine-Conditioned Place Preference in Neuropathic Rats: Role of the Central Noradrenergic System. Anesth Analg. 2017;125(3):1032–1041. doi: 10.1213/ANE.0000000000002128. [DOI] [PMC free article] [PubMed] [Google Scholar]
- Mori K, Kim J, Sasaki K. Electrophysiological effects of orexin-B and dopamine on rat nucleus accumbens shell neurons in vitro. Peptides. 2011;32(2):246–252. doi: 10.1016/j.peptides.2010.10.023. [DOI] [PubMed] [Google Scholar]
- Mukai K, Kim J, Nakajima K, Oomura Y, Wayner MJ, Sasaki K. Electrophysiological effects of orexin/hypocretin on nucleus accumbens shell neurons in rats: an in vitro study. Peptides. 2009;30(8):1487–1496. doi: 10.1016/j.peptides.2009.04.018. [DOI] [PubMed] [Google Scholar]
- Muschamp JW, Dominguez JM, Sato SM, Shen RY, Hull EM. A role for hypocretin (orexin) in male sexual behavior. The Journal of neuroscience: the official journal of the Society for Neuroscience. 2007;27(11):2837–2845. doi: 10.1523/JNEUROSCI.4121-06.2007. [DOI] [PMC free article] [PubMed] [Google Scholar]
- Muschamp JW, Hollander JA, Thompson JL, Voren G, Hassinger LC, Onvani S, … Carlezon WA., Jr Hypocretin (orexin) facilitates reward by attenuating the antireward effects of its cotransmitter dynorphin in ventral tegmental area. Proceedings of the National Academy of Sciences of the United States of America. 2014;111(16):E1648–1655. doi: 10.1073/pnas.1315542111. [DOI] [PMC free article] [PubMed] [Google Scholar]
- Narita M, Nagumo Y, Hashimoto S, Narita M, Khotib J, Miyatake M, … Suzuki T. Direct involvement of orexinergic systems in the activation of the mesolimbic dopamine pathway and related behaviors induced by morphine. J Neurosci. 2006;26(2):398–405. doi: 10.1523/JNEUROSCI.2761-05.2006. [DOI] [PMC free article] [PubMed] [Google Scholar]
- Nishino S, Ripley B, Overeem S, Lammers GJ, Mignot E. Hypocretin (orexin) deficiency in human narcolepsy. Lancet. 2000;355(9197):39–40. doi: 10.1016/S0140-6736(99)05582-8. [DOI] [PubMed] [Google Scholar]
- Nixon JP, Smale L. A comparative analysis of the distribution of immunoreactive orexin A and B in the brains of nocturnal and diurnal rodents. Behav Brain Funct. 2007;3:28. doi: 10.1186/1744-9081-3-28. [DOI] [PMC free article] [PubMed] [Google Scholar]
- Paxinos G, Franklin KBJ. The mouse brain in stereotaxic coordinates. 2. Amsterdam: Boston: Elsevier Academic Press; 2004. Compact. [Google Scholar]
- Peyron C, Tighe DK, van den Pol AN, de Lecea L, Heller HC, Sutcliffe JG, Kilduff TS. Neurons containing hypocretin (orexin) project to multiple neuronal systems. The Journal of Neuroscience. 1998;18(23):9996–10015. doi: 10.1523/JNEUROSCI.18-23-09996.1998. [DOI] [PMC free article] [PubMed] [Google Scholar]
- Piper DC, Upton N, Smith MI, Hunter AJ. The novel brain neuropeptide, orexin-A, modulates the sleep-wake cycle of rats. The European journal of neuroscience. 2000;12(2):726–730. doi: 10.1046/j.1460-9568.2000.00919.x. [DOI] [PubMed] [Google Scholar]
- Plaza-Zabala A, Martin-Garcia E, de Lecea L, Maldonado R, Berrendero F. Hypocretins regulate the anxiogenic-like effects of nicotine and induce reinstatement of nicotine-seeking behavior. J Neurosci. 2010;30(6):2300–2310. doi: 10.1523/JNEUROSCI.5724-09.2010. [DOI] [PMC free article] [PubMed] [Google Scholar]
- Richardson KA, Aston-Jones G. Lateral hypothalamic orexin/hypocretin neurons that project to ventral tegmental area are differentially activated with morphine preference. J Neurosci. 2012;32(11):3809–3817. doi: 10.1523/JNEUROSCI.3917-11.2012. [DOI] [PMC free article] [PubMed] [Google Scholar]
- Rosin DL, Weston MC, Sevigny CP, Stornetta RL, Guyenet PG. Hypothalamic orexin (hypocretin) neurons express vesicular glutamate transporters VGLUT1 or VGLUT2. The Journal of comparative neurology. 2003;465(4):593–603. doi: 10.1002/cne.10860. [DOI] [PubMed] [Google Scholar]
- Sakamoto F, Yamada S, Ueta Y. Centrally administered orexin-A activates corticotropin-releasing factor-containing neurons in the hypothalamic paraventricular nucleus and central amygdaloid nucleus of rats: possible involvement of central orexins on stress-activated central CRF neurons. Regul Pept. 2004;118(3):183–191. doi: 10.1016/j.regpep.2003.12.014. [DOI] [PubMed] [Google Scholar]
- Sakurai T, Amemiya A, Ishii M, Matsuzaki I, Chemelli RM, Tanaka H, … Yanagisawa M. Orexins and orexin receptors: a family of hypothalamic neuropeptides and G protein-coupled receptors that regulate feeding behavior. Cell. 1998;92(4):573–585. doi: 10.1016/s0092-8674(00)80949-6. [DOI] [PubMed] [Google Scholar]
- Samson WK, Taylor MM, Follwell M, Ferguson AV. Orexin actions in hypothalamic paraventricular nucleus: physiological consequences and cellular correlates. Regul Pept. 2002;104(1–3):97–103. doi: 10.1016/s0167-0115(01)00353-6. [DOI] [PubMed] [Google Scholar]
- Sasaki K, Suzuki M, Mieda M, Tsujino N, Roth B, Sakurai T. Pharmacogenetic modulation of orexin neurons alters sleep/wakefulness states in mice. PloS one. 2011;6(5):e20360. doi: 10.1371/journal.pone.0020360. [DOI] [PMC free article] [PubMed] [Google Scholar]
- Satoh S, Matsumura H, Kanbayashi T, Yoshida Y, Urakami T, Nakajima T, … Yoneda H. Expression pattern of FOS in orexin neurons during sleep induced by an adenosine A2A receptor agonist. Behavioural brain research. 2006;170(2):277–286. doi: 10.1016/j.bbr.2006.03.010. [DOI] [PubMed] [Google Scholar]
- Schone C, Cao ZF, Apergis-Schoute J, Adamantidis A, Sakurai T, Burdakov D. Optogenetic probing of fast glutamatergic transmission from hypocretin/orexin to histamine neurons in situ. J Neurosci. 2012;32(36):12437–12443. doi: 10.1523/JNEUROSCI.0706-12.2012. [DOI] [PMC free article] [PubMed] [Google Scholar]
- Schone C, Venner A, Knowles D, Karnani MM, Burdakov D. Dichotomous cellular properties of mouse orexin/hypocretin neurons. The Journal of physiology. 2011;589(Pt 11):2767–2779. doi: 10.1113/jphysiol.2011.208637. [DOI] [PMC free article] [PubMed] [Google Scholar]
- Shaham Y, Highfield D, Delfs J, Leung S, Stewart J. Clonidine blocks stress-induced reinstatement of heroin seeking in rats: an effect independent of locus coeruleus noradrenergic neurons. The European journal of neuroscience. 2000;12(1):292–302. doi: 10.1046/j.1460-9568.2000.00899.x. [DOI] [PubMed] [Google Scholar]
- Sharf R, Guarnieri DJ, Taylor JR, DiLeone RJ. Orexin mediates morphine place preference, but not morphine-induced hyperactivity or sensitization. Brain research. 2010;1317:24–32. doi: 10.1016/j.brainres.2009.12.035. [DOI] [PMC free article] [PubMed] [Google Scholar]
- Sharf R, Sarhan M, Dileone RJ. Orexin mediates the expression of precipitated morphine withdrawal and concurrent activation of the nucleus accumbens shell. Biological psychiatry. 2008;64(3):175–183. doi: 10.1016/j.biopsych.2008.03.006. [DOI] [PMC free article] [PubMed] [Google Scholar]
- Shoblock JR, Welty N, Aluisio L, Fraser I, Motley ST, Morton K, … Galici R. Selective blockade of the orexin-2 receptor attenuates ethanol self-administration, place preference, and reinstatement. Psychopharmacology. 2011;215(1):191–203. doi: 10.1007/s00213-010-2127-x. [DOI] [PubMed] [Google Scholar]
- Smith RJ, Aston-Jones G. Orexin/hypocretin 1 receptor antagonist reduces heroin self-administration and cue-induced heroin seeking. The European journal of neuroscience. 2012;35(5):798–804. doi: 10.1111/j.1460-9568.2012.08013.x. [DOI] [PMC free article] [PubMed] [Google Scholar]
- Smith RJ, See RE, Aston-Jones G. Orexin/hypocretin signaling at the orexin 1 receptor regulates cue-elicited cocaine-seeking. The European journal of neuroscience. 2009;30(3):493–503. doi: 10.1111/j.1460-9568.2009.06844.x. [DOI] [PMC free article] [PubMed] [Google Scholar]
- Smith RJ, Tahsili-Fahadan P, Aston-Jones G. Orexin/hypocretin is necessary for context-driven cocaine-seeking. Neuropharmacology. 2010;58(1):179–184. doi: 10.1016/j.neuropharm.2009.06.042. [DOI] [PMC free article] [PubMed] [Google Scholar]
- Solomon A, De Fanti BA, Martinez JA. Peripheral ghrelin interacts with orexin neurons in glucostatic signalling. Regul Pept. 2007;144(1–3):17–24. doi: 10.1016/j.regpep.2007.05.006. [DOI] [PubMed] [Google Scholar]
- Srinivasan S, Simms JA, Nielsen CK, Lieske SP, Bito-Onon JJ, Yi H, … Bartlett SE. The dual orexin/hypocretin receptor antagonist, almorexant, in the ventral tegmental area attenuates ethanol self-administration. PloS one. 2012;7(9):e44726. doi: 10.1371/journal.pone.0044726. [DOI] [PMC free article] [PubMed] [Google Scholar]
- Sternson SM, Eiselt AK. Three Pillars for the Neural Control of Appetite. Annu Rev Physiol. 2017;79:401–423. doi: 10.1146/annurev-physiol-021115-104948. [DOI] [PubMed] [Google Scholar]
- Swanson LW, Sanchez-Watts G, Watts AG. Comparison of melanin-concentrating hormone and hypocretin/orexin mRNA expression patterns in a new parceling scheme of the lateral hypothalamic zone. Neuroscience letters. 2005;387(2):80–84. doi: 10.1016/j.neulet.2005.06.066. [DOI] [PubMed] [Google Scholar]
- Tabuchi S, Tsunematsu T, Black SW, Tominaga M, Maruyama M, Takagi K, … Yamanaka A. Conditional ablation of orexin/hypocretin neurons: a new mouse model for the study of narcolepsy and orexin system function. J Neurosci. 2014;34(19):6495–6509. doi: 10.1523/JNEUROSCI.0073-14.2014. [DOI] [PMC free article] [PubMed] [Google Scholar]
- Taslimi Z, Arezoomandan R, Omranifard A, Ghalandari-Shamami M, Riahi E, Vafaei AA, … Haghparast A. Orexin A in the ventral tegmental area induces conditioned place preference in a dose-dependent manner: involvement of D1/D2 receptors in the nucleus accumbens. Peptides. 2012;37(2):225–232. doi: 10.1016/j.peptides.2012.07.023. [DOI] [PubMed] [Google Scholar]
- Thannickal TC, Moore RY, Nienhuis R, Ramanathan L, Gulyani S, Aldrich M, … Siegel JM. Reduced number of hypocretin neurons in human narcolepsy. Neuron. 2000;27(3):469–474. doi: 10.1016/s0896-6273(00)00058-1. [DOI] [PMC free article] [PubMed] [Google Scholar]
- Thorpe AJ, Kotz CM. Orexin A in the nucleus accumbens stimulates feeding and locomotor activity. Brain research. 2005;1050(1–2):156–162. doi: 10.1016/j.brainres.2005.05.045. [DOI] [PubMed] [Google Scholar]
- Tsunematsu T, Kilduff TS, Boyden ES, Takahashi S, Tominaga M, Yamanaka A. Acute optogenetic silencing of orexin/hypocretin neurons induces slow-wave sleep in mice. J Neurosci. 2011;31(29):10529–10539. doi: 10.1523/JNEUROSCI.0784-11.2011. [DOI] [PMC free article] [PubMed] [Google Scholar]
- van den Pol AN, Gao XB, Obrietan K, Kilduff TS, Belousov AB. Presynaptic and postsynaptic actions and modulation of neuroendocrine neurons by a new hypothalamic peptide, hypocretin/orexin. J Neurosci. 1998;18(19):7962–7971. doi: 10.1523/JNEUROSCI.18-19-07962.1998. [DOI] [PMC free article] [PubMed] [Google Scholar]
- Walling SG, Nutt DJ, Lalies MD, Harley CW. Orexin-A infusion in the locus ceruleus triggers norepinephrine (NE) release and NE-induced long-term potentiation in the dentate gyrus. The Journal of Neuroscience. 2004;24(34):7421–7426. doi: 10.1523/JNEUROSCI.1587-04.2004. [DOI] [PMC free article] [PubMed] [Google Scholar]
- Williams RH, Alexopoulos H, Jensen LT, Fugger L, Burdakov D. Adaptive sugar sensors in hypothalamic feeding circuits. Proceedings of the National Academy of Sciences of the United States of America. 2008;105(33):11975–11980. doi: 10.1073/pnas.0802687105. [DOI] [PMC free article] [PubMed] [Google Scholar]
- Winsky-Sommerer R, Yamanaka A, Diano S, Borok E, Roberts AJ, Sakurai T, … de Lecea L. Interaction between the corticotropin-releasing factor system and hypocretins (orexins): a novel circuit mediating stress response. The Journal of Neuroscience. 2004;24(50):11439–11448. doi: 10.1523/JNEUROSCI.3459-04.2004. [DOI] [PMC free article] [PubMed] [Google Scholar]
- Zarepour L, Fatahi Z, Sarihi A, Haghparast A. Blockade of orexin-1 receptors in the ventral tegmental area could attenuate the lateral hypothalamic stimulation-induced potentiation of rewarding properties of morphine. Neuropeptides. 2014;48(3):179–185. doi: 10.1016/j.npep.2014.04.003. [DOI] [PubMed] [Google Scholar]