

Abstract
Ocular dominance plasticity has been extensively studied in various mammalian species. While robust ocular dominance (OD) shifts are typically observed after monocular eyelid suture, relatively poor OD plasticity is observed for early eye removal or after tetrodotoxin (TTX) injections in mice. Hence, abnormal binocular signal interactions in the visual cortex may play a critical role in eliciting OD plasticity. Here, we examined the histochemical changes in the lateral geniculate nucleus (LGN) and the striate cortex (V1) in macaque monkeys that experienced two different monocular sensory deprivations in the same eye beginning at 3 weeks of age: restricted laser lesions in macular or peripheral retina and form deprivation induced by wearing a diffuser lens during the critical period. The monkeys were subsequently reared for 5 years under a normal visual environment. In the LGN, atrophy of neurons and a dramatic increase of GFAP expression were observed in the lesion projection zones (LPZs). In V1, although no obvious shift of the LPZ border was found, the ocular dominance columns (ODCs) for the lesioned eye shrunk and those for the intact eye expanded over the entirety of V1. This ODC size change was larger in the area outside the LPZ and in the region inside the LPZ near the border compared to that in the LPZ center. These developmental changes may reflect abnormal binocular interactions in V1 during early infancy. Our observations provide insights into the nature of degenerative and plastic changes in the LGN and V1 following early chronic monocular sensory deprivations.
Keywords: ocular dominance columns, visual cortex development, cytochrome oxidase histochemistry, monocular inactivation, monocular form deprivation, RRID: AB_2187552, RRID: AB_2313581
Graphical abstract
In the macaque that had laser macular lesion and diffuser in one of the eyes when infancy, change of ocular dominance column size was observed throughout V1. Interestingly, the size change was more conspicuous near the border of lesion projection zone (LPZ) than that in the center of LPZ.
Introduction
In nonhuman primates and other mammals, monocular deprivation during the sensitive (critical) period early in life disrupts the normal development of connections from the two eyes to the visual cortex, causing a decrease in the fraction of cortical cells responding to the deprived eye (Baker et al., 1974; Horton and Hocking, 1998; Hubel et al., 1977; LeVay et al., 1980; Mitchell et al., 2016; Wiesel and Hubel, 1963b). Monocular eyelid suture dramatically shifts the ocular dominance (OD) of neurons in the cat primary visual cortex (V1) to the intact eye within 2 days (LeVay et al., 1978; Shatz and Stryker, 1978). In mice, this sort of plasticity is accompanied by structural modifications of the arbors of geniculo-striate projections (Coleman et al., 2010; Hensch, 2004; Jaepel et al., 2017) and both the depression of the deprived eye input and the potentiation of the intact eye input to V1 from the thalamus are observed (Antonini et al., 1999; Frenkel and Bear, 2004). In non-human primates, the ocular dominance columns (ODCs) for the deprived eyes shrink while those for the intact eyes expand (Horton and Hocking, 1997; Hubel et al., 1977; Wong-Riley, 1979). In adult monkeys, OD shifts are absent or very weak (Hubel et al., 1977; Sawtell et al., 2003).
Interestingly, a complete monocular inactivation of the retina in young mice by tetrodotoxin (TTX) injection elicits more complex changes. Chronic monocular inactivation (more than 7 days) is as effective in shifting OD as monocular deprivation by eyelid suture, but short-term monocular inactivation (less than 2 days) has much less impact on cortical OD shifts, and depression of the deprived eye-input does not occur (Frenkel and Bear, 2004; Rittenhouse et al., 1999). These differences suggest that homosynaptic depression takes place only at active synapses. Thus, complete inactivation of retinal activity by TTX does not elicit the robust and acute OD shifts seen with eyelid suture because spontaneous or evoked synaptic activity is too weak to drive the OD shift (Frenkel and Bear, 2004; Rittenhouse et al., 1999).
Another approach for investigating visual deprivation involves placing restricted lesions of the retina in retinotopically corresponding regions of the two eyes. The effects of bilateral retinal lesions have largely been studied in adult animals. For example, physiological experiments in cats and monkeys revealed the presence of ectopic receptive fields for neurons within the lesion projection zone (LPZ) of primary visual cortex (V1) several months after matching restricted retinal laser lesions in the two eyes (Abe et al., 2015; Chino et al., 1992; Darian-Smith and Gilbert, 1995; Gilbert and Wiesel, 1992; Heinen and Skavenski, 1991; Kaas et al., 1990). However, other studies did not reveal substantial changes in V1, such as shrinkage of the LPZ (Smirnakis et al., 2005) or ODCs (Horton and Hocking, 1998).
In this study, we examined histological changes in the LGN and V1 after a restricted monocular deafferentation by laser burns combined with monocular form deprivation using a diffuser lens (Rittenhouse et al., 1999; Smith and Hung, 2000) during early infancy. More specifically, we examined the LGN and V1 of macaque monkeys that received restricted laser lesions in the macular or peripheral retina in one eye at 3-weeks of age and also wore a diffuser lens in the same eye from 3-weeks to 5 months of age. The monkeys were subsequently reared in a normal visual environment until 5 years of age. We found several intriguing histological changes in the LGN and V1 of our experimental monkeys.
Materials and methods
Animals and sample preparation
Seven rhesus macaques (Macaca mulatta) were examined in the current study. All monkeys underwent experimental monocular deprivation treatments at postnatal age of 3 weeks, as a part of separate research projects (Huang et al., 2011; Hung et al., 2005; Zhang et al., 2011). At 3 weeks of age, one eye of each monkey received a restricted laser lesion of the fovea and surrounding retina (macula), or the periphery of the retina. Five of these monkeys had a diffuser lens placed on the same eye when the retinal lesion was made. The diffuser consisted of a zero-powered carrier lens that was covered with a commercially available occlusion foil (Bangerter Occlusion Foils) (Ryser Optik, St. Gallen, Switzerland). These occlusion foils are available in various strengths that produce reliable and repeatable degrees of optical diffusion. The strongest diffuser (designated “LP” by the manufacturer) was used for this study. All monkeys (except ID10-56 and ID10-57) wore the optical diffuser with the same strength (LP). These lenses were removed approximately 4 months later (Fig. 1a). The details of treatment for each monkey are summarized in Table 1. The optics (refractive status) of each eye during the critical period are summarized in Table 2. All experimental monkeys exhibited anisometropia. The monkeys were made available for the present study when they were 5 years old. During early rearing years up until the time of perfusion, the monkeys did not appear to develop strabismus, although our testing could not detect a small angle deviation. After receiving a lethal dose of anesthesia (50-100 mg/kg, sodium pentobarbital), all animals were perfused intracardially with 1-2% paraformaldehyde (PFA) in 0.1 M phosphate-buffer (PB). The brain was then removed from the skull and the cortical tissue blocks that contained V1 were unfolded and flattened immediately after removal of the brain. The tissues were cryoprotected in 30% sucrose in 0.1 M PB at 4℃. The frozen blocks of the thalamus and flattened visual cortex were cut in the coronal and tangential plane, respectively, into 40 μm-thick sections on a sliding microtome. The sections were maintained in a cryoprotectant solution [30% glycerol, 30% ethylene glycol, 40% 0.1 M phosphate-buffered saline (PBS)] at −20 °C.
Figure 1.
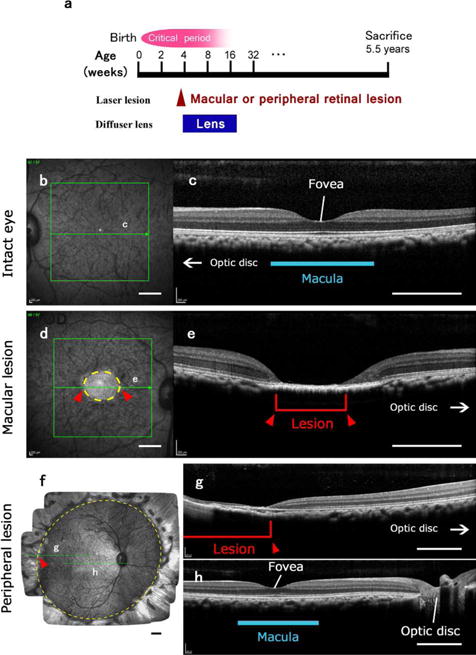
Visual deprivation produced by laser lesions of the retina of one eye and a period of visual deprivation for that eye with a diffuser lens. The other eye remained intact. (a) The time of the laser lesions and the period of deprivation with the diffuser lens. Although the diffuser lens was removed when the monkeys were 4-5 months old, the eye remained myopic or hyperopic. The deprivations were within the critical period of development where the ocular columns of visual cortex can be altered, but the full extent of this period is not well defined. After 5 years, the monkeys were sacrificed. (b)-(e). Examples of a retinal lesion of the macula, and the macula of the intact eye for monkey ID10-46. In (b) and (d), the fundus of the intact eye (b) and the lesioned eye (d) are shown as imaged through the pupil. Green arrows in the green boxes indicate the levels of the transverse sections through the retina shown in (c) and (e). Intact macular region is indicated with a blue line in (c). As the extent of the retinal lesions is apparent (circled with a yellow dashed line and also indicated with red arrowheads and a red bracket), the loss of vision in the right eye can be extrapolated based on a standard value for retinal magnification factor as within 5.9 × 7.3 degrees of central vision in this case. (f)-(h) Example of a retinal lesion of the peripheral retina. (f) A mosaic image of the fundus of the lesioned right eye of monkey ID10-49 taken through the pupil. Laser lesions damaged the entire periphery of the retina outside the yellow dashed circle. Green arrows indicate the levels of the transverse sections through the retina that are shown through a part of the lesion (g) and through the intact fovea and central retina (h). Red arrowheads and a red bracket indicate the site of the lesion. Scale bars = 1 mm.
Table 1.
Summary of monkeys used in this study.
| Monkey ID | 10-46 | 10-48 | 10-49 | 10-54 | 10-55 | 10-56 | 10-57 |
|---|---|---|---|---|---|---|---|
| Sex | M | M | M | M | F | M | M |
| Age of retinal lesion | 19 days | 25 days | 23 days | 31 days | 31 days | 23 days | 23 days |
| Deprived eye | right | right | right | left | right | right | right |
| Laser lesion | fovea | fovea | periphery | fovea | fovea | periphery | periphery |
| Visual field size of lesion (deg) | < 5.9 × 7.3 | < 8.3 × 8.9 | > 71.3 × 49.6 | < 9.8 × 10.8 | < 9.6 × 10.3 | > 61.4 × 53.1 | > 44.5 × 56.5 |
| Age of diffuser onset | 19 days | 25 days | 23 days | 21 days | 21 days | NA | NA |
| Age of diffuser removal | 161 days | 136 days | 155 days | 151 days | 135 days | NA | NA |
| Age of sacrifice | 5.5 years | 5.5 years | 5.5 years | 5.5 years | 5.5 years | 5.5 years | 5.5 years |
| Right V1 staining | Lost | Figure 5 | Figure 8 | Figure 6 | Figure 7, 10 | Not shown | Figure 9 |
| Left V1 staining | Figure 4 | Figure 5, 10 | Figure 8 | Figures 6, 10 | Figure 7 | Not shown | Figure 9 |
| LGN staining | Figure 2, 3 | Not shown | Figure 2, 3 | Not shown | Not shown | Not shown | Not shown |
Table 2.
Measured refractive power of each eye in monkeys of this study when they were 2 months old and the day of offset of diffuser (ID10-46 through ID10-55) or 5 months old (ID10-56 and ID10-57).
| Refractive power of each eye | ||
|---|---|---|
| 2 months | Last day of diffuser / 5 months | |
| ID10-46 | 4.25 (R) / 2.63(L) | 1.19 (R) / 4.81 (L) |
| ID10-48 | −1.88 (R) / 0.13 (L) | −4.88 (R) / 0.94 (L) |
| ID10-49 | 2.88 (R) / 1.38 (L) | 1.56 (R) / 1.63 (L) |
| ID10-54 | 3.06 (R) / 2.13 (L) | 2.00 (R) / 3.13 (L) |
| ID10-55 | 5.50 (R) / 4.49 (L) | 6.06 (R) / 4.63 (L) |
| ID10-56 | 1.38 (R) / 2.63 (L) | 5.19 (R) / 2.88 (L) |
| ID10-57 | 3.63 (R) / 2.75 (L) | 4.38 (R) / 2.69 (L) |
All of the surgical and related procedures were conducted at the University of Houston, and the protocols were approved by the Animal Care and Use Committee at the University of Houston. The protocols are in accordance with the animal care guidelines of the National Institutes of Health (NIH), USA.
Spectral domain optical coherence tomography (SD-OCT)
Shortly prior to sacrificing each animal, both retinas were imaged using a dual scanning system that included an infra-red scanning laser ophthalmoscope (IR-SLO) and optical coherence tomography system (Spectralis HRA+OCT, Heidelberg Engineering, Heidelberg, Germany). During imaging, both eyelids were kept open using a speculum, and corneal hydration to preserve optical clarity was maintained by a gas-permeable contact lens. In addition to a high resolution 30° single line scan through the macula and optic nerve head (Fig. 1g), a 20×20°, raster scan with at least 16 frame averaging was used to assess macular anatomy. To quantify peripheral lesions, high-density raster scans (193 lines, 30×20°, no averaging) in 9 overlapping positions, covering approximately 60° of the posterior segment, were captured. En face OCT scans and IR-SLO images were subsequently montaged (Figs. 1b, d), and the borders of the lesion manually marked. The lesions were marked on the scanning image, and the borders were then fit with an ellipse (Patel et al., 2017; Patel et al., 2012). Lesion size was quantified using the major and minor axis of the best fit ellipse to the lesion in both degrees and microns (nominal scaling 218 μm/deg).
In situ hybridization (ISH)
For colorimetric ISH, digoxigenin (DIG)-labeled antisense and sense riboprobes were prepared from plasmids using a DIG-dUTP labeling kit (Roche Diagnostics, Indianapolis, IN). The plasmids with inserts of VGLUT2-, GFAP- or c-FOS-specific sequences to each gene are identical to those used in the previous studies (Takahata et al., 2010; Takahata et al., 2009a). The sense probes detected no signals stronger than background. ISH was carried out as described previously (Takahata et al., 2009b). Free-floating sections were soaked in 4% PFA/0.1 M PB (pH 7.4) overnight at 4°C and treated with 10 μg/ml proteinase K for 30 min at 37℃. After acetylation, the sections were incubated in hybridization buffer [5×standard saline citrate (SSC: 150 mM NaCl, 15 mM Na citrate, pH 7.0), 50% formamide, 2% blocking reagent (Roche Diagnostics), 0.1% N-lauroylsarcosine (NLS), 0.1% sodium dodecyl sulphate (SDS), 20 mM maleic acid buffer; pH 7.5] containing 1.0 μg/ml DIG-labeled riboprobe at 60°C overnight. Hybridized sections were washed by successive immersion in wash buffer (2×SSC, 50% formamide, 0.1% NLS; 60°C, 20 min, twice), RNase A buffer [10 mM Tris-HCl, 10 mM ethylenediamine-N,N,N′,N′-tetraacetic acid (EDTA), 500 mM NaCl; pH 8.0] containing 20 μg/ml RNase A (37°C, 30 min), 2×SSC/0.1% NLS (37°C, 20 min) and 0.2×SSC/0.1% NLS (37 °°C, 15 min). Hybridization signals were visualized by alkaline phosphatase (AP) immunohistochemical staining using a DIG detection kit (Roche Diagnostics). Sections were mounted onto glass slides, dehydrated through a graded series of increasing ethanol concentrations followed by xylene, and then coverslipped with Permount (Fisher, Pittsburgh PA).
Immunohistochemistry
Mouse monoclonal anti-VGLUT2 (MAB5504, Millipore, Bedford MA, USA, RRID: AB_2187552) was commercially generated against a recombinant antigen. In Western blots of primate neocortex, the antibody recognizes a 56-kDa, the known molecular weight of VGLUT2. (Balaram et al., 2013; Baldwin et al., 2013). This mouse antibody has been used to label VGLUT2 in rodents (Dondzillo et al., 2010; Wong and Kaas, 2008), tree shrews (Balaram et al., 2015), sea lions (Sawyer et al., 2016) and primates (Balaram et al., 2013).
For VGLUT2 immunohistochemistry, sections were briefly fixed in 2% PFA, quenched in 0.01% hydrogen peroxide, and incubated for two hours in a blocking solution containing 5% horse serum (Vector Labs, Burlingame CA) and 0.05% Triton-X 100 (Fisher) in 0.1 M PBS. Sections were then incubated overnight in fresh blocking solution containing a 1:5000 dilution (0.2 ng/ml) of mouse anti-VGLUT2 (1 mg/ml). After multiple rinses in 0.01% Triton in 0.1 M PBS, sections were incubated for two hours in fresh blocking solution containing a 1:500 dilution (2 ng/ml) of biotinylated horse polyclonal anti-mouse IgG (1 mg/ml, BA-2000, Vector Labs, RRID: AB_2313581). Sections were rinsed again in 0.01% Triton/PBS, incubated overnight in an avidin-biotin amplification solution (ABC Elite Kit, Vector Labs), and reacted in a 0.2 mg/ml solution of 3′3-diaminobenzidine (DAB) (Sigma-Aldrich, St. Louis, MO) in 0.1 M PBS with 0.02% nickel chloride enhancement to reveal a dark gray colored product. Sections were briefly rinsed in distilled deionized water to stop the DAB reaction, mounted on gelatin-subbed slides, dehydrated in ethanol, cleared in xylene, coverslipped with Permount and air dried for several days prior to analysis.
CO and Nissl staining
For architectonically identifying V1 and its laminar structure, every 2 or 3 brain sections were processed for cytochrome oxidase (CO) (Wong-Riley, 1979). Free-floating sections were immersed into 10% sucrose/PBS (pH 7.4). The sections were then reacted with 0.50 mg/ml cytochrome C type III (Calbiochem, San Diego, CA), 0.25 mg/ml DAB and 0.37 mg/ml catalase (Sigma-Aldrich) in 10% sucrose/PBS at 37°C for 6-12 hours. In one of the flattened V1 series (Fig. 7a), enhanced CO histochemistry with nickel was utilized (Liu et al., 1993). LGN sections were stained for Nissl substance. Those sections were also mounted onto glass slides, dehydrated through a graded series of increasing ethanol concentrations followed by xylene, and then coverslipped with Permount.
Figure 7.

Changes in CO expression in of V1 after a macular lesion and a diffuser lens for the right eye in case ID10-55. (a), (b): Mosaic images of tangential sections in mainly layer 4 that were stained for CO activity. (a) is left V1 and (b) is right V1. An enhanced CO staining method with Nickel was used for (a), therefore, the color of this case is different from other CO histochemistry images. The LPZ border is marked by solid black line. White windows indicate regions magnified in (c)-(g). Scale bar in (c) = 2 mm. (h): Retinal scan of the right eye by SD-OCT showing the lesion (arrow). I: The lesion projection zone was estimated from the CO staining of V1 sections, and its area was calculated. The area and shape of the retinal lesion was also calculated from the retinal scan, and compared with that of V1. (j): Average widths of ODCs within the LPZ were measured in CO staining sections of the right V1. Dark CO columns were significantly larger than pale CO columns in both the LPZ border zone and LPZ center. Pale CO columns near the LPZ border were significantly smaller than those in LPZ centers, and dark CO columns near the LPZ border were significantly larger than those in LPZ centers (Unpaired Student t-test, ** P < 0.001, * P < 0.01).
Data acquisition and processing
Images of the ISH sections were captured with a Nikon Eclipse E800M microscope using a high-density CCD color digital camera, DXM1200F (Nikon, Tokyo, Japan). The images were cropped, and the brightness and contrast were enhanced using Photoshop CS3 Extended (Adobe Systems, CA). To superimpose and compare staining patterns of serial sections, distortion and shrinkage of sections were digitally corrected. As tangential sections sometimes contained different layers due to incomplete flattening, figures of tangential visual cortices were made from a mosaic of sections at different levels.
The widths of ODCs were digitally measured (see Fig. 4f) and significant differences between pale and dark columns, and between LPZ border and center regions, were quantified with an unpaired Student t-test. When CO columns run straight and parallel with each other, CO column widths were measured once each, and measurement with adjacent site of the previously measured column was avoided. If they were very long in the measured region, and measurement sites could be 3-4 mm apart, they were measured twice in the same straight column. In regions where the CO columns only had short straight portions, sites where curves did not increase the length of measurement of lines at 90 degrees to the column borders were selected.
Figure 4.

Changes in CO expression in V1 after a macular lesion and a diffuser lens for the right eye in case ID10-46. (a), (b): Mosaic images of tangential sections of left V1 stained for CO activity. (a) is mainly in layer 3 and (b) is mainly in layer 4. The estimated LPZ border is drawn by solid black lines. The expected retinotopic map follows Van Essen et al. (Van Essen et al., 1984), which is shown in (c). White windows indicate the magnified regions shown in D-G. Note the CO blobs in layer 3 and ODC stripes in layer 4 are observed. Scale bar in (d) = 2 mm. PC/pale CO columns, DC/dark CO columns. (h): The extent of the LPZ of vision loss was estimated from the CO staining of V1 sections. Impairment zone of the right V1 is unknown, because the tissue of right V1 was accidentally lost. The area and shape of retinal lesion was also calculated from retinal scan, and compared with that of V1. V.M./vertical meridian, H.M./horizontal meridian. I: Average widths of ODCs within LPZ were measured in CO staining sections. Dark CO columns were significantly larger than pale CO columns in both LPZ border and LPZ center, and pale CO columns in LPZ border were significantly smaller than those in LPZ centers (Unpaired Student t-test, ** P < 0.001).
The LPZ border region was defined as the area within 5 mm from the LPZ border in V1, and the LPZ center region was defined as the area further than 5 mm within the LPZ border in V1. The ratio of dark CO columns and pale CO columns (DC/PC) was also calculated in the LPZ border and center, and significant differences were examined with a paired Student t-test between them. The difference was considered significant when P was less than 0.01.
The areas of expected vision loss were measured from images of retina and V1, respectively, and the significant difference was examined with paired Student t-test. The difference was considered significant when P was less than 0.05.
Results
Retinal damage
Monkeys (excluding ID10-56 and ID10-57) received a retinal lesion and began diffuser lens treatment when they were 19-31 days old (Table 1). The refractive power of each eye was measured twice by standard refraction methods (Smith et al., 2014): first, when they were 2 months old (during the critical period) and second, either the day the diffuser was removed (ID10-46 through ID10-55) or at 5 months old (ID10-56 and ID10-57). The results are summarized in Table 2. A strong refractive error in the lesioned eye was observed in all cases at both 2 and 5 months, even for cases without the diffuser lens (ID10-56 and ID10-57), showing that they all exhibited anisometropia (large differences in refractive error between the two eyes). The monkeys did not develop obvious strabismus, although our testing method could not detect a small angle deviation.
OCT scans confirmed that laser-induced damage was confined to the retina, with loss of retinal layers above the retinal pigment epithelium (Fig. 1). There were no signs of choroidal neovascularization in any of the scanned regions, and none of the animals had abnormal retinal thickness in spared (no laser) retinal regions. All laser lesions were referenced to the center of the fovea. The average size of macular lesions (n=4) was 8.0° (range 5.9 – 9.8°) × 9.2° (range 7.3 –10.8°) or 1.75 mm (range 1.3 - 2.1 mm) × 2.0 mm (range 1.6 – 2.3 mm). In animals with peripheral lesions (n=3), the central retina corresponding to 63.0 (range 56.5 – 71.3°) × 49.0 (range 44.5 – 53.1°) or 13.7 mm (range 12.3 – 15.5 mm) × 10.7 mm (range 9.7 – 11.6 mm) was intact, without notable pathology. More specifically, peripheral lesions extended from the limits of the ‘normal’ area described above to the ora serrata (see Fig 1f). All retinal lesions were confluent to the extent visible. This was confirmed using high density OCT imaging. Peripheral lesions were also measured using montaged scanning laser ophthalmoscope images acquired concurrently with OCT imaging using the Spectralis OCT system. Hence, there is accurate registration of the OCT and fundus imaging from which extent of ablated retina can be accurately quantified.
Degenerative changes in LGN
We examined coronal sections through the LGN in both macular and peripheral lesion cases. In a macular lesion case (ID10-46), abnormal cytoarchitecture was observed in posterior portions of parvocellular (P) layers, which receive inputs from macular retinal ganglion cells (RGCs) that, in this case, correspond to the lesion projection zone (LPZ). While LGN layers that receive inputs from the intact eye (LGN layers P2 and P4 ipsilateral to the lesioned eye, and layers P1 and P3 contralateral to the lesioned eye) appeared normal, those that receive inputs from the lesioned eye (LGN layers P1 and P3 ipsilateral to the lesioned eye, and layers P2 and P4 contralateral to the lesioned eye) showed pale Nissl staining (Figs. 2a, b). Even outside the LPZ, labeling of Nissl was generally less intense in LGN layers that receive inputs from the lesioned eye than that in LGN layers corresponding to the intact eye.
Figure 2.
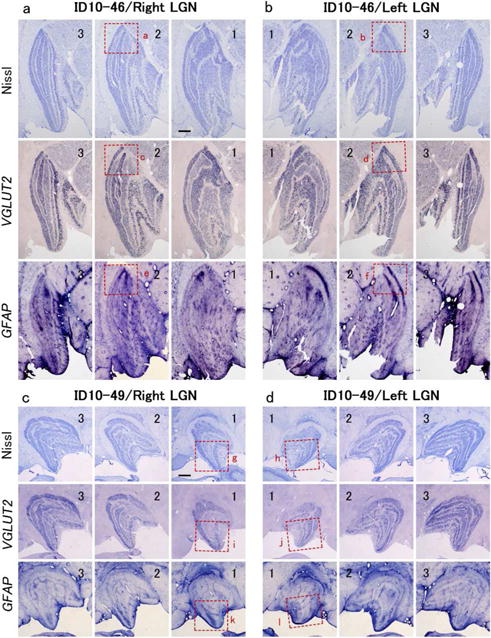
(a), (b): Histological effects of the visual deprivation and a macular lesion of the right eye in case ID10-46 on the ipsilateral (a) and contralateral (b) LGN. The sections move from anterior to posterior as the annotated number increases from 1 to 3. Note that the layers with inputs from the deprived ipsilateral right eye in (a) are less densely stained in the Nissl and VGLUT2-ISH preparations, while layers with contralateral inputs from the deprived right eye are also less densely stained in (b). In the posterior extent of parvocellular LGN layers where the macula is represented, the lightly stained layers become even less stained indicating some neuron loss or atrophy from the macular lesion. The GFAP-ISH staining was more intense in these same regions of the deprived LGN layers, suggesting that astrogliosis occurred after the retinal lesion. The red squares (a-d) outline parts of the LGN that are shown at higher magnification in Figure 3. (c), (d): the histological effects of the diffuser lens and lesions of the peripheral retina of the right eye in case ID10-49. The sections move from anterior to posterior as the annotated number increases from 1 to 3. Note lighter staining in Nissl and VGLUT2-ISH preparations of the deprived layers in the ipsilateral and contralateral (d) LGNs is similar to case ID10-46 in (a) and (b), thus reflecting the effect of the diffuser lens. A decrease of neuronal signal intensity in the parts of geniculate layers representing the lesioned peripheral retina is, at best, only weakly apparent. Scale bars = 1 mm
To further address the changes that may have occurred, we examined the brain sections for the expression of cell type markers, the vesicular glutamate transporter 2 (VGLUT2), which is a marker for glutamatergic excitatory neurons (Barroso-Chinea et al., 2007), and the glial fibrillary acidic protein (GFAP), which labels activated astrocytes (Hadley and Goshgarian, 1997). VGLUT2 and GFAP staining patterns were complimentary in the LPZ; the signal intensity for VGLUT2 mRNA was very low, whereas that for GFAP mRNA was robust (Figs. 2a, b). Even outside the LPZ, the VGLUT2 mRNA signal was less intense in LGN layers corresponding to the lesioned eye than those corresponding to the other eye, and GFAP mRNA signals were complementary to those of VGLUT2. At higher magnification, the size of thionine-stained cells was much smaller in the LPZ compared to cells in the LGN layers of the intact eye (Figs. 3a, b). Furthermore, cell morphology was visibly different between the LPZ and non-LPZ within LGN layers for the lesioned eye. Cells in the LPZ were small and appeared to be glia or atrophied neurons, while the larger cells outside the LPZ were clearly neurons of regular size.
Figure 3.
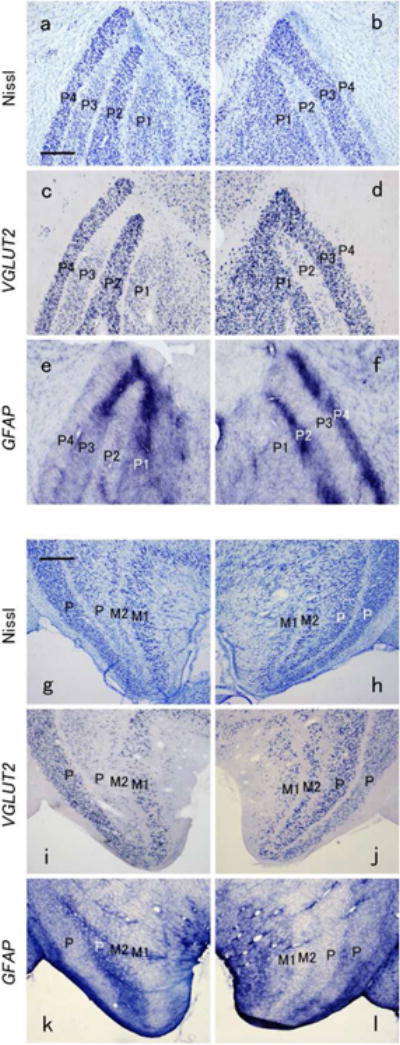
Magnified views of portions of the LGN layer indicated by squares in Figure 2. A-F are from case ID10-46 with a diffusion lens and a macular lesion of the right eye. Ipsilateral LGN sections on right, contralateral sections, left. A comparison of dorsal layer P3 in (a) and (c) indicates that the pale staining Nissl cells in (a) are likely glia, as the cells in that region of (c) do not exhibit VGLUT2 mRNA signals. The laminar regions expressing the least Nissl or VGLUT2 mRNA contain the most ISH signals for GFAP, suggesting that activated astrocytes were accumulated as a result of the macular lesion. (g)-(l) show magnified views of parts of LGN sections from case ID10-49 with a diffusion lens and lesions of the peripheral retina of the right eye. As in the case with a macular lesion, the layers deprived by the diffuser lens in the ipsilateral and contralateral LGNs are less dark with the Nissl and VGLUT2 ISH preparations. This is moderately apparent in the ventral part of the internal P layers in (g) and more so in (i), which indicate that the loss is of neurons. In (k), the dense expression of GFAP indicates accumulation of activated astrocyte. Overall, the effects of the lesions of the peripheral retina are variably apparent, and less obvious that those of the macular lesions. Scale bars = 500 μm.
In ISH sections, VGLUT2-positive large cells were rarely observed in the LPZ (Figs. 3c, d), and the size of neurons outside the LPZ in both parvocellular and magnocellular LGN layers, for the lesioned eye became smaller due to retinal deprivation by laser lesion and/or diffuser lens. In contrast, GFAP-positive small cells were fairly dense in the LPZ of parvocellular LGN layers. The reduction of VGLUT2 mRNA signals and accumulation of GFAP mRNA were also observed in magnocellular layers, but the affected area was limited to the most posterior portion. Because parvocellular projecting-RGCs are highly concentrated in the macular region (>95%) while magnocellular projecting-RGCs make up relatively small percentage of the total ganglion cell population (<5%) (Curcio and Allen, 1990; Dacey, 1993), the macular region is enormously expanded in parvocellular layers of the LGN, while it is not in magnocellular layers (Connolly and Van Essen, 1984). Thus, the LPZ may be too small to produce large histochemical abnormalities in the magnocellular layers. We did not examine any koniocellular markers. Other macular lesion cases showed similar results in LGN.
In the case ID10-49 with lesions of the peripheral retina, the abnormality of the LGN was more moderate (Figs. 2c, d and Figs. 3i, j). Abolishment of VGLUT2 mRNA or robust accumulation of GFAP mRNA was not observed anywhere. However, the moderate reduction of VGLUT2 mRNA was observed in LGN layers that receive inputs from the lesioned eye (LGN layers M2, P1 and P3 ipsilateral, and M1, P2 and P4 contralateral to the lesioned eye), but VGLUT2-positive cells were still present in the LPZ (anterior ventral part) (Figs. 3i, j). A moderate increase of GFAP mRNA signal was also observed in the LPZ (Figs. 2c, d and Figs. 3k, l).
Changes in V1: Macular lesion cases
In all cases, V1 from each hemisphere was flattened and stained for CO activity. Then, sections from layer 3 or layer 4 were digitally stitched together to make mosaic images. In all macular lesion cases, stripes of dark and pale CO staining were observed in layer 4 of the LPZ, which most likely represent ODCs, since CO activity is known to be reduced in ODCs for the deprived/inactivated eye after monocular deprivation/inactivation treatment (Horton and Hocking, 1997; Wong-Riley and Carroll, 1984a). We analyzed the size of the region where CO activity was reduced (presumptive LPZ size) and the width of ODCs for each eye.
ID10-46
This monkey received a macular lesion in the right eye at 19 days of age, and wore a diffuser lens from 19 to 161 days of age (Table 1). For this monkey, the right V1 was lost during sectioning of the brain, so mosaic images for both layers 3 and 4 were created from the left V1 (Figs. 4a, b). In layer 3, CO blobs were aligned along ODCs as previously reported (Horton and Hubel, 1981), and the blobs located within ODCs for the lesioned eye were small and faint (Fig. 4d). In the LPZ of layer 4, alternate pale and dark CO columns were observed, and the border between the LPZ and the non-LPZ was easily determined (Fig. 4b). Because the retinotopic map of V1 (Fig. 4c) is conserved across individuals [see Blasdel and Campbell, 2001 for review (Blasdel and Campbell, 2001)], we were able to outline the V1. As shown in Fig. 4f, Van Essen et al. (1984) showed commonly observed retinotopic map in the flattened macaque V1. According to this map, we marked presumptive retinotopy in the flattened V1 image with anatomical landmarks [e.g. the monocular crescent represents eccentricity (E) 45°-100°, the optic disk represents near E15°, the center of V1 long axis represents near E10°, the center of V1 short axis represents near horizontal meridian and the V1/V2 border represents vertical meridian in the visual field]. We then plotted V1 scotoma in the visual field map, comparing the obtained V1 image and the LPZ border. We adjusted the scale and calculated the size of V1 scotoma as square degrees. On the other hand, we plotted retinal scotoma in the visual field map, comparing the obtained retinal image and adjusting the scale (exact position of retinal scotoma in the visual field was not available, but the size could be calculated). Finally, we compared areas of the V1 scotoma and retinal scotoma (Fig. 4h). The estimated V1 scotoma for the right visual hemifield was similar but somewhat larger than the retinal scotoma (38.0 square degrees for the left V1 vs. 34.8 square degrees for retina).
The widths of observed dark CO columns were obviously wider than pale CO columns throughout the LPZ most likely because of ocular dominance plasticity, and unexpectedly, the difference between dark and pale CO columns appeared larger near the border of the LPZ (Fig. 4e) than that in the center of the LPZ (Fig. 4f). Since it was possible that the effects of laser lesions were different between the LPZ border and the LPZ center, we separately measured the ODC widths in these two regions. In the region near the LPZ border (within 5 mm from the LPZ border), ODC widths were significantly different between dark CO columns and pale CO columns; dark CO column widths were more than twice as wide as pale CO column widths [in the left V1, 538.8±15.8 μm (average±S.E.) (n=42) and 254.4±8.8 μm (n=50), dark and pale CO columns, respectively, P < 0.0001. Data was not available for the right V1] (Fig. 4i). Note that this pattern for the ODC widths was the same for the LPZ center [570.0±14.3 μm (n=67) and 296.4 ±7.5 μm (n=71), dark and pale CO columns, respectively, P < 0.0001]. However, the ratio of dark and pale CO columns (DC/PC) was larger near the LPZ border (2.12) compared to that in the LPZ center (1.92), and the pale CO column sizes were significantly smaller in the LPZ border than those in the LPZ center (P = 0.0004), whereas the dark CO column sizes were not statistically different between the LPZ border and center (P = 0.159) (Fig 4i). The dark CO columns, although not as conspicuous as in the LPZ, were also observed throughout the cortex outside of the LPZ (Fig. 4g), except for the two monocular segments for the optic disc and monocular periphery. The imbalance in ODC widths between pale CO columns and dark CO columns is likely due to severe monocular defocus with a diffuser lens following the laser lesion. Outside of the LPZ, the width of dark CO columns appeared smaller than that of pale CO columns.
ID10-48
This monkey also had a macular lesion and a diffuser lens in the right eye. Both the right and left V1 were available in this macular lesion case (Fig. 5). The histological appearance of V1 was similar to that for ID10-46. However, the size of the LPZ in V1 was smaller than expected from the size of the retinal lesion (48.8 square degrees for V1 vs. 56.0 square degrees for retina) (Fig. 5). Pale CO column widths were significantly smaller than dark CO column widths in both the LPZ border [in the right V1, 497.5±15.7 μm (n=63) and 199.7±6.5 μm (n=67), dark and pale CO columns, respectively, P < 0.0001. DC/PC=2.49; in the left V1, 513.3±14.3 μm (n=48) and 223.1±9.3 μm (n=61), dark and pale CO columns, respectively, P < 0.0001. DC/PC=2.30] (Figs. 5d, e, i) and the LPZ center [in the right V1, 521.3±14.1 μm (n=54) and 244.4±7.8 μm (n=67), dark and pale CO columns, respectively, P < 0.0001. DC/PC=2.13; in the left V1, 506.9±16.2 μm (n=39) and 216.5±7.6 μm (n=38), dark and pale CO columns, respectively, P < 0.0001. DC/PC=2.34] (Figs. 5f, i). As was for ID10-48, within the LPZ, pale CO column widths were significantly smaller near the LPZ border than those in the LPZ center in the right V1 (P < 0.0001), but there was no significant difference in ODC widths between the LPZ border and LPZ center in the left V1 (P=0.617) (Fig. 5i). There were relatively clear ODC-like CO stripe patterns outside of the LPZ, reflecting the effects of wearing a diffuser lens during early infancy (Fig. 5c). As in ID10-48, the widths of pale columns were generally wider than those of dark CO columns outside of the LPZ.
Figure 5.
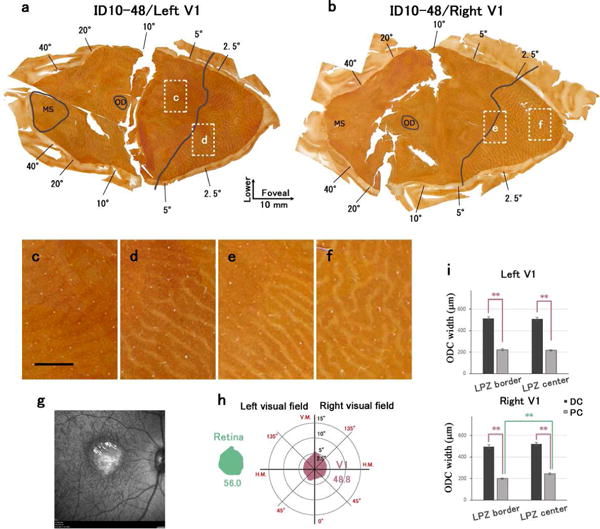
Changes in CO expression in V1 after a macular lesion and a diffuser lens for the right eye in case ID10-48. (a), (b): Mosaic images of tangential sections mainly in layer 4 that were stained for CO activity. (a) is left V1 and (b) is right V1. LPZ border is marked by solid black line. White windows indicate regions magnified in C-F. Scale bar in (c) = 2 mm. (g): Retinal scan of the right eye by showing the lesion (arrow). (h): The LPZ was estimated from the CO staining of V1 sections, and its area was calculated. The area and shape of retinal lesion was also calculated from the retinal scan, and compared with that of V1. (i): Average widths of ODCs within LPZ were measured in CO staining sections. Dark CO columns were significantly larger than pale CO columns in both LPZ border and LPZ center, and pale CO columns near the LPZ border were significantly smaller than those in LPZ centers of right V1 (Unpaired Student t-test, ** P < 0.001).
ID10-54
This case also had a macular lesion and a diffuser lens for the left eye. This monkey had the largest macular injury and largest LPZ in V1 for this study. The visual field size of the LPZ in V1 was slightly larger than the size of the retinal lesion (96.0 square degrees for V1 vs. 81.2 square degrees for retina). Pale CO column widths were significantly smaller than dark CO column widths in both the LPZ border and the LPZ center [in the right V1 LPZ border, 508.4±15.7 μm (n=42) and 240.6±7.9 μm (n=46), dark and pale CO columns, respectively, P < 0.0001. DC/PC=2.11; in the right V1 LPZ center, 464.0±14.0 μm (n=48) and 303.5±7.6 μm (n=77), dark and pale CO columns, respectively, P < 0.0001. DC/PC=1.53; in the left V1 LPZ border, 468.3±12.9 μm (n=47) and 205.8±6.8 μm (n=52), dark and pale CO columns, respectively, P < 0.0001. DC/PC=2.28; in the left V1 LPZ center, 457.1±11.5 μm (n=57) and 295.4±7.7 μm (n=71), dark and pale CO columns, respectively, P < 0.0001. DC/PC=1.55] (Fig. 6i). In this case ODC widths were different between the LPZ border and the LPZ center (Figs. 6c, e, f, i). Importantly, pale CO column widths were significantly smaller near the LPZ border than those in LPZ center in both the left and right V1 (in both V1, P < 0.0001). Moreover, dark CO column widths were significantly larger near the LPZ border than those in the LPZ center of the right V1 (in the right V1, P < 0.0001; in the left V1, P=0.521) (Fig. 6i). ODC-like CO stripe patterns were also weakly visible outside the LPZ (Fig. 6d).
Figure 6.

Changes in CO expression in V1 after a macular lesion and a diffuser lens for the left eye in case ID10-54. (a), (b): Mosaic images of tangential sections mainly in layer 4 that were stained for CO activity. (a) is left V1 and (b) is right V1. LPZ border is marked by solid black line. White windows indicate the regions magnified in (c)-(f). Scale bar in (c) = 2 mm. (g): Retinal scan of the right eye by SD-OCT showing the lesion (arrow). (h): Impaired vision was estimated from the CO staining of V1 sections, and area was calculated. The area and shape of retinal lesion was also calculated from the retinal scan, and compared with that of V1. I: Average widths of ODCs within the LPZ were measured in CO staining sections. Dark CO columns were significantly larger than pale CO columns in both LPZ border and LPZ center, and pale CO columns in LPZ border were significantly smaller than those in LPZ centers in both V1. In right V1, dark CO columns near the LPZ border were significantly larger than those in LPZ centers (Unpaired Student t-test, ** P < 0.001).
ID10-55
This monkey had a macular lesion and a diffuser lens in the right eye. In this monkey, the LPZ was restricted to the dorsal portion of the left V1, corresponding to the lower visual field (Fig. 7a). Even in the right V1, the LPZ did not extend into the upper visual field (Fig. 7b). However, when the loss of visual field was estimated from shapes of the LPZs in V1 and projected into the visual field map, it appeared circular, but displaced from the center (Fig. 7i). The size of vision loss was estimated to be 58.3 square degrees for V1 and 77.3 square degrees for the retina. Near the LPZ border, dark CO columns were nearly twice as wide as pale CO columns [in the left V1, data was not available. In the right V1 LPZ border, 519.6±12.5 μm (n=39) and 289.8±8.9 μm (n=45), dark and pale CO columns, respectively, P < 0.0001. DC/PC=1.79] (Fig 7f) while in the LPZ center, the widths of dark CO columns were more similar to pale CO columns [in the right V1 LPZ center, 403.7±9.8 μm (n=78) and 359.9±9.1 μm (n=82), dark and pale CO columns, respectively. DC/PC=1.12] (Figs. 7g). However, the dark CO columns were significantly wider than the pale CO columns even in the LPZ center (P = 0.0013) (Fig. 7j). Thin CO dark columns were also visible outside of the LPZ, and there was some evidence that they connect to the thin pale CO columns inside of the LPZ, likely reflecting the inputs from the intact eye in comparison with the lesioned eye (Figs. 7c, d).
Statistics of differences in ODC size changes between the LPG border and the LPG center
Since it has been shown that ODC widths are slightly wider for the macular representation compared to the peripheral representation in some individual macaques (Horton and Hocking, 1996), it is possible that our results of a wider ODC width near the LPZ border compared to the LPZ center shown above merely reflect the intrinsic variations and not the result of differences in plasticity. However, there are two reasons why this does not seem to be the case: 1) Compared to the study by Horton and Hocking (2 out of 8 cases), 3 out of 4 cases of macular lesions in this study exhibited clear and statistically significant differences for the ODC widths between the LPZ center and the LPZ borders, and 2) the magnitude of this difference was greater in our study than that of the previous study.
We took measurements in six hemispheres from four monkeys (ID10-46 left, ID10-48 left and right, ID10-54 left and right, ID10-55 right). The sum of pale and dark CO columns in the LPZ border was slightly smaller than that in the LPZ center [743.2±52.6 um (average±STDEV), and 773.2±48.5 um, respectively], which is consistent with the previously reported values (Horton and Hocking, 1996). Nonetheless, the ratio of dark CO columns and pale CO columns (DC/PC) was significantly larger in the LPZ border compared to that in the LPZ center [2.18±0.24 (average±STDEV), 1.77±0.45, respectively, p=0.019 in paired Student’s t-test]. Therefore, our result is not only consequence of locally wider macular columns, but it represents the plastic changes due to early retinal lesions combined with wearing an optical diffuser.
Changes in V1: Peripheral lesion cases
ID10-49
This monkey sustained a large lesion of the peripheral retina and had a diffuser on the right eye. The retinal lesion was located outside the area estimated to represent 71.3 × 49.6 degrees (Table 1). In the contralateral V1, the monocular segment showed a uniform reduction in CO activity (Fig. 8d) compared to darker uniform CO stain in the ipsilateral V1 (Fig. 8f). However, comparing the level of uniform CO expression in the two different tissues may not be very convincing. More importantly, darker thin stripes were also observed throughout the ‘normal’ regions of V1, representing the unequal ODCs resulting from anisometropia (see Table 2) and optical diffuser treatment during the critical period (Figs. 8e and g).
Figure 8.
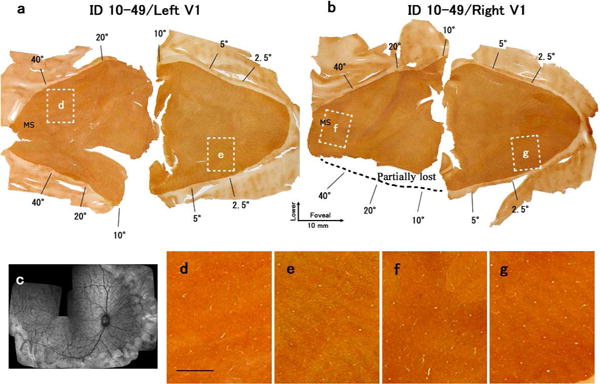
Changes in CO expression in V1 after lesions of the peripheral retina of the right eye in case ID10-49. (a), (b): Mosaic images of tangential sections mainly in layer 4 stained for CO activity. (a) is the left V1 and (b) is the right V1. A part of the right V1 was lost during procedure as indicated. White windows indicate the regions magnified in (d)-(g). Scale bar in (d) = 2 mm. (c): Retinal scan of the right eye by SD-OCT shows the lesion (arrow).
ID10-57
This monkey had a large lesion in the peripheral retina of the right eye, but did not wear a diffuser during infancy (Fig. 9). The retinal lesion was located outside the area corresponding to 44.5 × 56.5 degrees. Although the CO staining pattern of layer 4 appeared almost uniform (Figs. 9a, b), closer examination revealed the ODC-like dark/pale stripes throughout V1 (Figs. 9d–g). This is likely due to anisometropia resulting from the large peripheral laser lesion in the right eye of this monkey. Early anisometropia is known to lead to chronic monocular defocus due to either myopia or hyperopia and binocular suppression in V1 and V2 (Smith et al., 1997; Tao et al., 2014; Wang et al., 2017).
Figure 9.
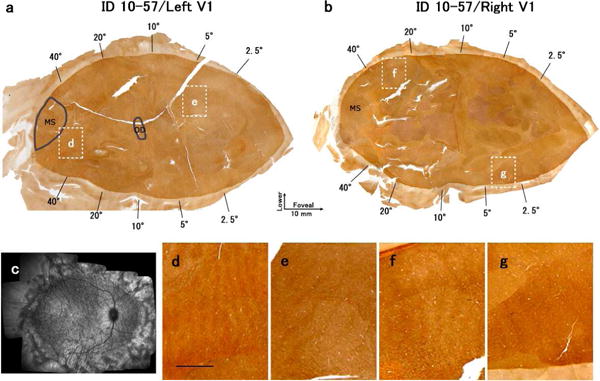
Changes in CO expression in V1 after lesions of the peripheral retina of the right eye in case ID10-57. There was no diffuser lens. (a), (b): Mosaic images of tangential sections in mainly layer 4 stained for CO activity. (a) is the left V1 and (b) is the right V1. White windows indicate the regions magnified in (d)-(g). Scale bar in (d) = 2 mm. (c): Retinal scan of the right eye by SD-OCT. Note that the existence of thinner dark and thicker light ODCs occurred without the presence of a diffuser lens.
ID10-56
This monkey had a large lesion in the peripheral retina of the right eye but did not wear a diffuser lens (Table 1). The retinal lesion was located outside the area corresponding to 61.4 × 53.1 degrees. Similar to other peripheral lesion cases above, CO histochemistry did not show conspicuous changes in either V1, except a subtle dark and thin stripe patterns throughout layer 4 of V1.
Comparison of CO histochemistry with other staining in V1
In order to solidify the interpretation of the data obtained with CO staining, we compared CO stained sections of V1 with three additional staining methods that reveal activity related changes (Fig. 10). VGLUT2 mRNA is strongly expressed in relay neurons of the LGN, but not in V1 neurons. Therefore, immunohistochemistry for VGLUT2 can be used to reveal the terminals of geniculo-cortical axons in V1 (Balaram et al., 2013). Since VGLUT2 mRNA expression was almost abolished in the LPZ of the LGN (See Figs. 2 and 3), VGLUT2-immunoreactivity must be strongly decreased in geniculo-cortical afferents in the LPZ of V1 as well. When compared with CO histochemistry, VGLUT2-immunoreactivity for Monkey ID10-54 (extreme defocus plus macular lesion) was almost identical to CO reactivity, showing similar shapes of ODCs and LPZ borders (Figs. 10a–d). As the VGLUT2 transporter is highly concentrated in the terminals of geniculo-cortical axons synapsing on the dendrites of layer 4 neurons in V1, and CO levels are highest in the dendrites that are depolarized by geniculo-cortical axon terminals (Takahata, 2016; Wong-Riley, 1989), a close correspondence between the CO and VGLUT2 patterns is expected.
Figure 10.

Examples of ODCs revealed by different stains in three cases with a macular lesion of the right eye and partial rearing with a diffusion lens in the right eye. (a) and (b) (Case ID10-54): Mosaic images of tangential sections through layer 4 of the left V1 that were stained for CO activity (a) and VGLUT2-immunoreactivity (b). Both stains revealed almost identical ODC patterns. (e)-(g) (Case ID10-55): A sequence of adjacent tangential sections of the right V1 stained for GFAP mRNA in lower layer 3 (e) and layer 4 (g), and for CO in layer 4 (f). Note the greater GFAP expression in lower layer 3. Circles surround the same radial blood vessels across sections so that ODCs can be aligned. I (Case ID10-48): Adjacent tangential sections through layer 4 that have been processed for CO expression (h) or mRNA of c-FOS (i). Circles mark matching blood vessels, open arrows indicate pale ODCs within the LPZ for the lesioned eye, and solid black arrows indicate the thinner dark CO ODCs that are outside the LPZ. The mRNA expression of c-FOS appeared to be down-regulated in both CO-pale columns inside the LPZ and thin CO-dense columns outside the LPZ in response to the retinal lesions (CO-pale columns) and the diffuser lens for the right eye. Scale bars = 1 mm.
We also examined the mRNA expression of GFAP in the LPZ of V1 to address how much gliosis occurred in the cortex. ODC-like stripes were observed in layer 3 of Monkey ID10-55 (extreme defocus plus macular lesion) (Fig. 10e). We found that GFAP mRNA levels were slightly higher in pale CO stripes than those in dark CO stripes, indicating that moderate gliosis occurred in the ODCs for the deprived eye. Note that mRNA signals of GFAP were sparse throughout layer 4.
Finally, we compared CO histochemistry with mRNA expression of an immediate-early gene, c-FOS, in order to correlate CO histochemistry data with neuronal activity of cortical neurons. Overall, c-FOS mRNA was scarce in the cortex, likely due to the long duration of anesthesia for retinal scans before sacrifice. Nonetheless, ODC-like stripe patterns were observed in some parts of V1. In the LPZ, c-FOS mRNA signals were scarce in pale CO columns, but they were relatively abundant in dark CO columns, indicating that neuronal activity was decreased in the ODCs for the lesioned eye (Fig. 10f). In the non-LPZ, however, c-FOS mRNA expression levels were lower in darker CO columns than those in paler CO columns, indicating that neuronal activity was lower in the ODCs that showed higher CO activity.
Discussion
The important findings of this study were: (1) the lesion projecting zone (LPZ) in the LGN exhibited predictable cellular changes including anterograde neuronal degeneration/atrophy and gliosis, (2) the widths of ODCs for the deprived eye in V1 were reduced within the LPZ, but this shrinkage was more pronounced in the center of the LPZ compared to that for the border of the LPZ, (3) the size of the LPZ in V1, predicted from the size of the retinal lesion, did not change, and (4) the widths of pale CO ODCs outside of the LPZ were wider than those of dark CO ODCs, resulting from early chronic defocus and/or anisometropia. For the monkeys with a peripheral lesion with or without defocus, the ODCs were visible in the parts of V1 that were not affected by laser lesions, and pale CO ODCs were consistently wider than dark CO ODCs.
LGN shows degenerative changes
The decrease of VGLUT2 mRNA signals and the increase of GFAP mRNA signals in the LPZ of the LGN suggest that neurons that originally received retinal signals degenerated or atrophied after small laser lesions and subsequently proliferated active astroglia, which is defined as astrogliosis. In Nissl stained sections, neurons in the LPZ of the deprived LGN layers largely atrophied or totally disappeared. Extensive neuron loss has been reported in the LGN of macaques after retinal lesions in infants but not in adults (Matthews et al., 1960; Polyak, 1957). Neurons may have degenerated because their driving signals were completely lost, and the degeneration was severe because deprivation of signals occurred during early infancy (Cowan et al., 1984; Oppenheim, 1991). Such anterograde transneuronal degeneration has often been used to investigate brain connectivity (Harting et al., 1973; Le Gros Clark and Penman, 1934; Matthews et al., 1960). Severe astrogliosis is known to occur following neuronal degeneration, and our data show that astrogliosis in the LGN persists even 5 years after the onset of retinal injuries. Similar changes in the LGN have been observed in macaque monkeys that experienced experimental glaucoma and subsequent retinal ganglion cell degeneration (Harwerth et al., 2002; Sasaoka et al., 2008). Although a previous study in adult cats showed a brief increase of synaptic contacts on LGN neurons after retinal lesions (Baekelandt et al., 1994), our results are more consistent with findings that sprouting of retinal projection axons from regions outside the lesion into the LPZ is very limited in the LGN (Darian-Smith and Gilbert, 1995; Eysel et al., 1980; Stelzner and Keating, 1977).
Even outside the LPZ, shrinkage of neurons was observed in the LGN layers for the treated eye. The type of cell shrinkage perhaps resulted from blurred vision during early development due to the diffuser lens, similar to the shrinkage of LGN neurons in lid-sutured animals (Casagrande et al., 1978; Sesma et al., 1984; Wiesel and Hubel, 1963a). Therefore, shrinkage of the LGN neurons outside of the LPZ in these monkeys appears to reflect abnormal developmental alterations in their V1 circuitry.
V1 shows plastic changes in ODC widths, but not LPZ size
Previously, monocular form deprivation by eyelid suture has been shown to result in a greater difference between deprived and non-deprived ODCs than those induced by complete monocular inactivation by enucleation or TTX injection. A study in mice suggested that spontaneous retinal activity from the deprived eye may play a crucial role in the rewiring of V1 circuitry (Frenkel and Bear, 2004).
For macular lesion cases, interocular suppression, resulting from wearing a diffuser lens (Smith et al., 1997; Tao et al., 2014; Wang et al., 2017), may have been responsible for the difference in ODC widths between the LPZ center and the LPZ border. Specifically, the ODC shrinkage at the center of the LPZ resulted from the total silencing of retinal signals in the lesioned region of the retina (hence there is no effect of wearing a diffuser and ‘weak’ ‘crude’ signals). However, because of long-range horizontal connections in V1 that extend several millimeters (Rockland and Lund, 1983; Stettler et al., 2002; Tychsen et al., 2004), there may have been anomalous binocular signal interactions between weak signals in deprived columns of the LPZ border zone and signals in nearby regions corresponding to the normal eye. This sort of binocular interaction is similar to the robust binocular suppression in V1 in monkeys reared with early strabismus (Adams et al., 2013; Horton and Hocking, 1998; Horton et al., 1999; Smith et al., 1997). A restricted monocular retinal lesion by itself causes anisometropia (differences in refractive error between the two eyes resulting from myopia or hyperopia), and early anisometropia leads to chronic monocular defocus and consequently, binocular suppression in V1 and V2 (Smith et al., 1997; Tao et al., 2014; Wang et al., 2017). The combination of deafferentation by retinal lesions and the top-down influence of binocular suppression could alter ODC widths in the LPZ border zone to a greater extent.
Overall, there was no significant statistical difference between the area of impaired visual field in V1 and the retina, suggesting that the LPZ in V1 did not consistently shrink or expand in these animals. This result is not particularly surprising and may be related to how the retinotopic map of the intact eye is organized. In this study, the restricted retinal lesion was confined to one eye. The retinotopic organization of V1 is based on retinotopically matched inputs from the two eyes, although the inputs are segregated into ODCs in layer 4 of V1 (Kaschube, 2014). Therefore, even for the restricted laser lesion cases, the retinotopic map, normally based on both eyes, would be maintained throughout V1 by the intact eye, and this may be the reason why the LPZ is not filled-in by ‘shifting’ the surviving geniculo-cortical projections. With visuotopically matched partial retinal lesions in both eyes, the size of the LPZ revealed by CO histochemistry might have become smaller. This does not mean that an acquisition of ectopic receptive fields for neurons near the LPZ border (Abe et al., 2015; Chino et al., 2001; Chino et al., 1995; Darian-Smith and Gilbert, 1995; Kaas et al., 1990; Matsuura et al., 2002) did not occur in monkeys of this study. The acquisition of an ectopic receptive field is thought to arise from novel extensions of cortico-cortical projection in layers 2/3 of V1 (Darian-Smith and Gilbert, 1995; Yamahachi et al., 2009), therefore, CO histochemistry, which is mainly sensitive to thalamo-cortical afferent activity in layer 4 of V1, does not reveal activity changes in the upper cortical layers. These previous results also explain why the area of loss of CO activity did not change even in cases where a part of one eye was lasered and the other eye was enucleated in adult monkeys (Horton and Hocking, 1998). Considered together, we do not rule out the possibility that the LPZ neurons may have acquired ectopic receptive fields in this study.
The ODCs revealed with CO activity in two peripheral lesion cases likely represent the presence of an early binocular imbalance resulting from a combination of changes in the optics of the lesioned eye and chronic monocular defocus due to diffuser lens rearing (Fig. 8), and possibly from abnormal optics caused by large peripheral retinal lesions alone (Fig. 9) (Smith et al., 2014). Importantly, the ODC size change was found even for the peripheral lesion case that did not wear a diffuser lens. As discussed for macular lesion cases above, this ODC change is likely due to anisometropia resulting from the large peripheral laser lesion in the corresponding eye (see Table 2). Anisometropia by restricted laser lesion (without the diffuser lens) may be enough to alter the widths of ODCs, and diffuser lens-induced defocus would accelerate such plastic changes.
CO columns outside the LPZ
In the cases with a macular lesion of one eye and a diffuser lens in that eye, CO columns were at least weakly apparent in parts of V1 outside the LPZ. The expected interpretation of these dark and pale CO columns is that impaired vision in the lesioned eye resulted in less activity in the pale columns (Horton et al., 1999; Huang et al., 2011; Wong-Riley, 1979; Wong-Riley and Carroll, 1984b). One might also expect dark CO columns to be wider than pale columns, but dark columns were narrower than pale columns. However, eyelid suture also produces wider pale columns for the deprived eye, as does lens removal and atropine treatment (Horton and Hocking, 1998). The proposed mechanism for this difference in dark and pale columns is that columns are composed of a monocular core, with binocular border strips on each side. After vision is impaired in one eye, neural activity in the binocular strips is reduced for the dark CO columns, adding them to the pale columns. This explanation seems most likely to account for the presence of thinner dark CO columns outside the LPZ in the present cases. Nevertheless, other observations challenge that interpretation. First, pale CO columns inside the LPZ sometimes appear to connect to dark CO columns outside the LPZ (Fig. 7d). This suggests that pale CO columns outside the LPZ represent the intact eye, and dark CO columns represent the lesioned eye. Also, evidence from c-FOS mRNA expression (Fig. 10) seemed to indicate that c-FOS expression was high in the CO pale columns outside the LPZ, suggesting higher neural activity in pale CO columns, consistent with their representation of the intact eye. In other words, either CO or c-FOS expression was higher in ODCs for the lesioned eye compared to ODCs for the intact eye. In fact, similar discrepancy was previously reported for both CO histochemistry (Adams et al., 2015) and immediate-early genes (Horton et al., 2000), where expressions of these “activity markers” were somehow higher in ODCs for the deprived eye on monocular enucleation or strabismus in layer 4 of V1. As authors of these papers mention, we cannot explain with current knowledge why this reversal happens. Yet, we insist that CO and c-FOS reveal different activity: Whereas c-FOS expression is largely dependent on acute calcium influx into cell soma of cortical neurons, CO histochemistry is rather coupled with chronic metabolic activity of thalamo-cortical afferent axons, and/or cortical dendrites that receive direct inputs from the thalamus (Takahata, 2016). The addition of transneuronal tracer injection in one eye would more clearly identify the eye activating each set of ODC’s in future studies and investigation about expression mechanisms of these markers may provide clues to this reversal discrepancy.
Conclusions
Although the effects of restricted retinal lesions have been extensively studied in adult mammals, this is the first developmental study in non-human primates where the combined effects of early restricted retinal lesions and chronic monocular defocus in one (the same) eye were investigated [but see (Chino et al., 2001; Matsuura et al., 2002)]. We expected to observe much greater plastic changes than previous restricted retinal lesion studies, since (1) the injury was made when animals were infants, (2) combined with wearing diffuser lens in the same eye, and (3) the animals survived for more than 5 years. Myopia or hyperopia of the lesioned eye due to unilateral partial retinal injury elicits binocular suppression in V1 on inputs from the remaining retina. Lens-induced diffusion accelerates this phenomenon. Even in this condition, plastic changes as a result of the retinal lesion were not obvious in the LGN, but significant ODC size changes were observed throughout V1. Our most interesting finding was the significantly greater ODC size change in the LPZ border compared to that in the LPZ center, which illustrates one of the principles of plasticity that abnormal binocular interaction accelerates plasticity whereas total silencing of the retinal activity elicits rather moderate changes.
Acknowledgments
We thank Dr. Earl L. Smith III for providing the monkeys reared with retinal lesions and monocular form deprivation. We also thank Drs. David J. Calkins and Troy A. Hackett, Vanderbilt University, for the use of their laboratory facilities. Laura E. Trice and Margaret Gondo provided technical assistance.
The research was supported by Japan Society for Promotion of Science to TT, NIH grant K23 EY021761 to NBP, R01 EY008128 to YMC, P30 EY007511 to University of Houston, College of Optometry, R01 EY002686 to JHK, P30 EY008126 to Graphic Lab of Vanderbilt University, and Key Construction Program of the National “985” Project, P. R. China, to TT.
Footnotes
Conflict of Interest
Authors declare no conflict of interest about this publication.
Roles of Authors
All authors had full access to all the data in the study and take responsibility for the integrity of the data and the accuracy of the data analysis. Study concept and design: TT, YMC and JHK. Acquisition of SD-OCT retinal data: NBP. Acquisition of histological data: TT (CO histochemistry, ISH) and PB (VGLUT2-immunohistochemistry). Analysis and interpretation of data: TT, YMC JHK. Drafting of the manuscript: TT, YMC and JHK.
References
- Abe H, McManus JN, Ramalingam N, Li W, Marik SA, Borgloh SM, Gilbert CD. Adult cortical plasticity studied with chronically implanted electrode arrays. J Neurosci. 2015;35(6):2778–2790. doi: 10.1523/JNEUROSCI.3579-14.2015. [DOI] [PMC free article] [PubMed] [Google Scholar]
- Adams DL, Economides JR, Horton JC. Contrasting effects of strabismic amblyopia on metabolic activity in superficial and deep layers of striate cortex. J Neurophysiol. 2015;113(9):3337–3344. doi: 10.1152/jn.00159.2015. [DOI] [PMC free article] [PubMed] [Google Scholar]
- Adams DL, Economides JR, Sincich LC, Horton JC. Cortical metabolic activity matches the pattern of visual suppression in strabismus. J Neurosci. 2013;33(9):3752–3759. doi: 10.1523/JNEUROSCI.3228-12.2013. [DOI] [PMC free article] [PubMed] [Google Scholar]
- Antonini A, Fagiolini M, Stryker MP. Anatomical correlates of functional plasticity in mouse visual cortex. J Neurosci. 1999;19(11):4388–4406. doi: 10.1523/JNEUROSCI.19-11-04388.1999. [DOI] [PMC free article] [PubMed] [Google Scholar]
- Baekelandt V, Arckens L, Annaert W, Eysel UT, Orban GA, Vandesande F. Alterations in GAP-43 and synapsin immunoreactivity provide evidence for synaptic reorganization in adult cat dorsal lateral geniculate nucleus following retinal lesions. Eur J Neurosci. 1994;6(5):754–765. doi: 10.1111/j.1460-9568.1994.tb00987.x. [DOI] [PubMed] [Google Scholar]
- Baker FH, Grigg P, von Noorden GK. Effects of visual deprivation and strabismus on the response of neurons in the visual cortex of the monkey, including studies on the striate and prestriate cortex in the normal animal. Brain Res. 1974;66(2):185–208. [Google Scholar]
- Balaram P, Hackett TA, Kaas JH. Differential expression of vesicular glutamate transporters 1 and 2 may identify distinct modes of glutamatergic transmission in the macaque visual system. J Chem Neuroanat. 2013;50–51:21–38. doi: 10.1016/j.jchemneu.2013.02.007. [DOI] [PMC free article] [PubMed] [Google Scholar]
- Balaram P, Isaamullah M, Petry HM, Bickford ME, Kaas JH. Distributions of vesicular glutamate transporters 1 and 2 in the visual system of tree shrews (Tupaia belangeri) J Comp Neurol. 2015;523(12):1792–1808. doi: 10.1002/cne.23727. [DOI] [PMC free article] [PubMed] [Google Scholar]
- Baldwin MK, Balaram P, Kaas JH. Projections of the superior colliculus to the pulvinar in prosimian galagos (Otolemur garnettii) and VGLUT2 staining of the visual pulvinar. J Comp Neurol. 2013;521(7):1664–1682. doi: 10.1002/cne.23252. [DOI] [PMC free article] [PubMed] [Google Scholar]
- Barroso-Chinea P, Castle M, Aymerich MS, Perez-Manso M, Erro E, Tunon T, Lanciego JL. Expression of the mRNAs encoding for the vesicular glutamate transporters 1 and 2 in the rat thalamus. J Comp Neurol. 2007;501(5):703–715. doi: 10.1002/cne.21265. [DOI] [PubMed] [Google Scholar]
- Blasdel G, Campbell D. Functional retinotopy of monkey visual cortex. J Neurosci. 2001;21(20):8286–8301. doi: 10.1523/JNEUROSCI.21-20-08286.2001. [DOI] [PMC free article] [PubMed] [Google Scholar]
- Casagrande VA, Guillery RW, Harting JK. Differential effects of monocular deprivation seen in different layers of the lateral geniculate nucleus. J Comp Neurol. 1978;179(3):469–485. doi: 10.1002/cne.901790302. [DOI] [PubMed] [Google Scholar]
- Chino Y, Smith EL, 3rd, Zhang B, Matsuura K, Mori T, Kaas JH. Recovery of binocular responses by cortical neurons after early monocular lesions. Nat Neurosci. 2001;4(7):689–690. doi: 10.1038/89469. [DOI] [PubMed] [Google Scholar]
- Chino YM, Kaas JH, Smith EL, 3rd, Langston AL, Cheng H. Rapid reorganization of cortical maps in adult cats following restricted deafferentation in retina. Vision Res. 1992;32(5):789–796. doi: 10.1016/0042-6989(92)90021-a. [DOI] [PubMed] [Google Scholar]
- Chino YM, Smith EL, 3rd, Kaas JH, Sasaki Y, Cheng H. Receptive-field properties of deafferentated visual cortical neurons after topographic map reorganization in adult cats. J Neurosci. 1995;15(3 Pt 2):2417–2433. doi: 10.1523/JNEUROSCI.15-03-02417.1995. [DOI] [PMC free article] [PubMed] [Google Scholar]
- Coleman JE, Nahmani M, Gavornik JP, Haslinger R, Heynen AJ, Erisir A, Bear MF. Rapid structural remodeling of thalamocortical synapses parallels experience-dependent functional plasticity in mouse primary visual cortex. J Neurosci. 2010;30(29):9670–9682. doi: 10.1523/JNEUROSCI.1248-10.2010. [DOI] [PMC free article] [PubMed] [Google Scholar]
- Connolly M, Van Essen D. The representation of the visual field in parvicellular and magnocellular layers of the lateral geniculate nucleus in the macaque monkey. J Comp Neurol. 1984;226(4):544–564. doi: 10.1002/cne.902260408. [DOI] [PubMed] [Google Scholar]
- Cowan WM, Fawcett JW, O’Leary DD, Stanfield BB. Regressive events in neurogenesis. Science. 1984;225(4668):1258–1265. doi: 10.1126/science.6474175. [DOI] [PubMed] [Google Scholar]
- Curcio CA, Allen KA. Topography of ganglion cells in human retina. J Comp Neurol. 1990;300(1):5–25. doi: 10.1002/cne.903000103. [DOI] [PubMed] [Google Scholar]
- Dacey DM. The mosaic of midget ganglion cells in the human retina. J Neurosci. 1993;13(12):5334–5355. doi: 10.1523/JNEUROSCI.13-12-05334.1993. [DOI] [PMC free article] [PubMed] [Google Scholar]
- Darian-Smith C, Gilbert CD. Topographic reorganization in the striate cortex of the adult cat and monkey is cortically mediated. J Neurosci. 1995;15(3 Pt 1):1631–1647. doi: 10.1523/JNEUROSCI.15-03-01631.1995. [DOI] [PMC free article] [PubMed] [Google Scholar]
- Dondzillo A, Satzler K, Horstmann H, Altrock WD, Gundelfinger ED, Kuner T. Targeted three-dimensional immunohistochemistry reveals localization of presynaptic proteins Bassoon and Piccolo in the rat calyx of Held before and after the onset of hearing. J Comp Neurol. 2010;518(7):1008–1029. doi: 10.1002/cne.22260. [DOI] [PubMed] [Google Scholar]
- Eysel UT, Gonzalez-Aguilar F, Mayer U. A functional sign of reorganization in the visual system of adult cats: lateral geniculate neurons with displaced receptive fields after lesions of the nasal retina. Brain Res. 1980;181(2):285–300. doi: 10.1016/0006-8993(80)90613-7. [DOI] [PubMed] [Google Scholar]
- Frenkel MY, Bear MF. How monocular deprivation shifts ocular dominance in visual cortex of young mice. Neuron. 2004;44(6):917–923. doi: 10.1016/j.neuron.2004.12.003. [DOI] [PubMed] [Google Scholar]
- Gilbert CD, Wiesel TN. Receptive field dynamics in adult primary visual cortex. Nature. 1992;356(6365):150–152. doi: 10.1038/356150a0. [DOI] [PubMed] [Google Scholar]
- Hadley SD, Goshgarian HG. Altered immunoreactivity for glial fibrillary acidic protein in astrocytes within 1 h after cervical spinal cord injury. Exp Neurol. 1997;146(2):380–387. doi: 10.1006/exnr.1997.6538. [DOI] [PubMed] [Google Scholar]
- Harting JK, Diamond IT, Hall WC. Anterograde degeneration study of the cortical projections of the lateral geniculate and pulvinar nuclei in the tree shrew (Tupaia glis) J Comp Neurol. 1973;150(4):393–440. doi: 10.1002/cne.901500403. [DOI] [PubMed] [Google Scholar]
- Harwerth RS, Crawford ML, Frishman LJ, Viswanathan S, Smith EL, 3rd, Carter-Dawson L. Visual field defects and neural losses from experimental glaucoma. Prog Retin Eye Res. 2002;21(1):91–125. doi: 10.1016/s1350-9462(01)00022-2. [DOI] [PubMed] [Google Scholar]
- Heinen SJ, Skavenski AA. Recovery of visual responses in foveal V1 neurons following bilateral foveal lesions in adult monkey. Exp Brain Res. 1991;83(3):670–674. doi: 10.1007/BF00229845. [DOI] [PubMed] [Google Scholar]
- Hensch TK. Critical period regulation. Annu Rev Neurosci. 2004;27:549–579. doi: 10.1146/annurev.neuro.27.070203.144327. [DOI] [PubMed] [Google Scholar]
- Horton JC, Hocking DR. Intrinsic variability of ocular dominance column periodicity in normal macaque monkeys. J Neurosci. 1996;16(22):7228–7239. doi: 10.1523/JNEUROSCI.16-22-07228.1996. [DOI] [PMC free article] [PubMed] [Google Scholar]
- Horton JC, Hocking DR. Timing of the critical period for plasticity of ocular dominance columns in macaque striate cortex. J Neurosci. 1997;17(10):3684–3709. doi: 10.1523/JNEUROSCI.17-10-03684.1997. [DOI] [PMC free article] [PubMed] [Google Scholar]
- Horton JC, Hocking DR. Monocular core zones and binocular border strips in primate striate cortex revealed by the contrasting effects of enucleation, eyelid suture, and retinal laser lesions on cytochrome oxidase activity. J Neurosci. 1998;18(14):5433–5455. doi: 10.1523/JNEUROSCI.18-14-05433.1998. [DOI] [PMC free article] [PubMed] [Google Scholar]
- Horton JC, Hocking DR, Adams DL. Metabolic mapping of suppression scotomas in striate cortex of macaques with experimental strabismus. J Neurosci. 1999;19(16):7111–7129. doi: 10.1523/JNEUROSCI.19-16-07111.1999. [DOI] [PMC free article] [PubMed] [Google Scholar]
- Horton JC, Hocking DR, Adams DL. Rapid identification of ocular dominance columns in macaques using cytochrome oxidase, Zif268, and dark-field microscopy. Vis Neurosci. 2000;17(4):495–508. doi: 10.1017/s0952523800174024. [DOI] [PubMed] [Google Scholar]
- Horton JC, Hubel DH. Regular patchy distribution of cytochrome oxidase staining in primary visual cortex of macaque monkey. Nature. 1981;292(5825):762–764. doi: 10.1038/292762a0. [DOI] [PubMed] [Google Scholar]
- Huang J, Hung LF, Smith EL., 3rd Effects of foveal ablation on the pattern of peripheral refractive errors in normal and form-deprived infant rhesus monkeys (Macaca mulatta) Invest Ophthalmol Vis Sci. 2011;52(9):6428–6434. doi: 10.1167/iovs.10-6757. [DOI] [PMC free article] [PubMed] [Google Scholar]
- Hubel DH, Wiesel TN, LeVay S. Plasticity of ocular dominance columns in monkey striate cortex. Philos Trans R Soc Lond B Biol Sci. 1977;278(961):377–409. doi: 10.1098/rstb.1977.0050. [DOI] [PubMed] [Google Scholar]
- Hung LF, Qiao-Grider Y, Kee C, Ramamirtham R, Coats DK, Smith EL., 3rd Contributions of the fovea and peripheral retina to the emmetropization process in monkeys. Invest Ophthalmol Vis Sci. 2005;46(13):2281. [Google Scholar]
- Jaepel J, Hubener M, Bonhoeffer T, Rose T. Lateral geniculate neurons projecting to primary visual cortex show ocular dominance plasticity in adult mice. Nat Neurosci. 2017;20(12):1708–1714. doi: 10.1038/s41593-017-0021-0. [DOI] [PubMed] [Google Scholar]
- Kaas JH, Krubitzer LA, Chino YM, Langston AL, Polley EH, Blair N. Reorganization of retinotopic cortical maps in adult mammals after lesions of the retina. Science. 1990;248(4952):229–231. doi: 10.1126/science.2326637. [DOI] [PubMed] [Google Scholar]
- Kaschube M. Neural maps versus salt-and-pepper organization in visual cortex. Curr Opin Neurobiol. 2014;24(1):95–102. doi: 10.1016/j.conb.2013.08.017. [DOI] [PubMed] [Google Scholar]
- Le Gros Clark WE, Penman GG. The projection of the retina in the lateral geniculate body. Proc Royal Soc London B. 1934;114(788):291–313. [Google Scholar]
- LeVay S, Stryker MP, Shatz CJ. Ocular dominance columns and their development in layer IV of the cat’s visual cortex: a quantitative study. J Comp Neurol. 1978;179(1):223–244. doi: 10.1002/cne.901790113. [DOI] [PubMed] [Google Scholar]
- LeVay S, Wiesel TN, Hubel DH. The development of ocular dominance columns in normal and visually deprived monkeys. J Comp Neurol. 1980;191(1):1–51. doi: 10.1002/cne.901910102. [DOI] [PubMed] [Google Scholar]
- Liu Y, Gu Q, Cynader MS. An improved staining technique for cytochrome C oxidase. J Neurosci Methods. 1993;49(3):181–184. doi: 10.1016/0165-0270(93)90122-8. [DOI] [PubMed] [Google Scholar]
- Matsuura K, Zhang B, Mori T, Smith EL, 3rd, Kaas JH, Chino Y. Topographic map reorganization in cat area 17 after early monocular retinal lesions. Vis Neurosci. 2002;19(1):85–96. doi: 10.1017/s095252380119108x. [DOI] [PubMed] [Google Scholar]
- Matthews MR, Cowan WM, Powell TP. Transneuronal cell degeneration in the lateral geniculate nucleus of the macaque monkey. J Anat. 1960;94(Pt 2):145–169. [PMC free article] [PubMed] [Google Scholar]
- Mitchell DE, MacNeill K, Crowder NA, Holman K, Duffy KR. Recovery of visual functions in amblyopic animals following brief exposure to total darkness. J Physiol. 2016;594(1):149–167. doi: 10.1113/JP270981. [DOI] [PMC free article] [PubMed] [Google Scholar]
- Oppenheim RW. Cell death during development of the nervous system. Annu Rev Neurosci. 1991;14:453–501. doi: 10.1146/annurev.ne.14.030191.002321. [DOI] [PubMed] [Google Scholar]
- Patel NB, Hung LF, Harwerth RS. Postnatal maturation of the fovea in Macaca mulatta using optical coherence tomography. Exp Eye Res. 2017;164:8–21. doi: 10.1016/j.exer.2017.07.018. [DOI] [PMC free article] [PubMed] [Google Scholar]
- Patel NB, Wheat JL, Rodriguez A, Tran V, Harwerth RS. Agreement between retinal nerve fiber layer measures from Spectralis and Cirrus spectral domain OCT. Optom Vis Sci. 2012;89(5):E652–666. doi: 10.1097/OPX.0b013e318238c34e. [DOI] [PMC free article] [PubMed] [Google Scholar]
- Polyak S. The Vertebrate Visual System. Chicago: University of Chicago Press; 1957. [Google Scholar]
- Rittenhouse CD, Shouval HZ, Paradiso MA, Bear MF. Monocular deprivation induces homosynaptic long-term depression in visual cortex. Nature. 1999;397(6717):347–350. doi: 10.1038/16922. [DOI] [PubMed] [Google Scholar]
- Rockland KS, Lund JS. Intrinsic laminar lattice connections in primate visual cortex. J Comp Neurol. 1983;216(3):303–318. doi: 10.1002/cne.902160307. [DOI] [PubMed] [Google Scholar]
- Sasaoka M, Nakamura K, Shimazawa M, Ito Y, Araie M, Hara H. Changes in visual fields and lateral geniculate nucleus in monkey laser-induced high intraocular pressure model. Exp Eye Res. 2008;86(5):770–782. doi: 10.1016/j.exer.2008.02.004. [DOI] [PubMed] [Google Scholar]
- Sawtell NB, Frenkel MY, Philpot BD, Nakazawa K, Tonegawa S, Bear MF. NMDA receptor-dependent ocular dominance plasticity in adult visual cortex. Neuron. 2003;38(6):977–985. doi: 10.1016/s0896-6273(03)00323-4. [DOI] [PubMed] [Google Scholar]
- Sawyer EK, Turner EC, Kaas JH. Somatosensory brainstem, thalamus, and cortex of the California sea lion (Zalophus californianus) J Comp Neurol. 2016;524(9):1957–1975. doi: 10.1002/cne.23984. [DOI] [PMC free article] [PubMed] [Google Scholar]
- Sesma MA, Irvin GE, Kuyk TK, Norton TT, Casagrande VA. Effects of monocular deprivation on the lateral geniculate nucleus in a primate. Proc Natl Acad Sci U S A. 1984;81(7):2255–2259. doi: 10.1073/pnas.81.7.2255. [DOI] [PMC free article] [PubMed] [Google Scholar]
- Shatz CJ, Stryker MP. Ocular dominance in layer IV of the cat’s visual cortex and the effects of monocular deprivation. J Physiol. 1978;281:267–283. doi: 10.1113/jphysiol.1978.sp012421. [DOI] [PMC free article] [PubMed] [Google Scholar]
- Smith EL, 3rd, Chino YM, Ni J, Cheng H, Crawford ML, Harwerth RS. Residual binocular interactions in the striate cortex of monkeys reared with abnormal binocular vision. J Neurophysiol. 1997;78(3):1353–1362. doi: 10.1152/jn.1997.78.3.1353. [DOI] [PubMed] [Google Scholar]
- Smith EL, 3rd, Hung LF. Form-deprivation myopia in monkeys is a graded phenomenon. Vision Res. 2000;40(4):371–381. doi: 10.1016/s0042-6989(99)00184-4. [DOI] [PubMed] [Google Scholar]
- Smith EL, 3rd, Hung LF, Arumugam B. Visual regulation of refractive development: insights from animal studies. Eye (Lond) 2014;28(2):180–188. doi: 10.1038/eye.2013.277. [DOI] [PMC free article] [PubMed] [Google Scholar]
- Stelzner DJ, Keating EG. Lack of intralaminar sprouting of retinal axons in monkey LGN. Brain Res. 1977;126(2):201–210. doi: 10.1016/0006-8993(77)90721-1. [DOI] [PubMed] [Google Scholar]
- Stettler DD, Das A, Bennett J, Gilbert CD. Lateral connectivity and contextual interactions in macaque primary visual cortex. Neuron. 2002;36(4):739–750. doi: 10.1016/s0896-6273(02)01029-2. [DOI] [PubMed] [Google Scholar]
- Takahata T. What Does Cytochrome Oxidase Histochemistry Represent in the Visual Cortex? Front Neuroanat. 2016;10:79. doi: 10.3389/fnana.2016.00079. [DOI] [PMC free article] [PubMed] [Google Scholar]
- Takahata T, Hashikawa T, Tochitani S, Yamamori T. Differential expression patterns of OCC1-related, extracellular matrix proteins in the lateral geniculate nucleus of macaque monkeys. J Chem Neuroanat. 2010;40(2):112–122. doi: 10.1016/j.jchemneu.2010.05.001. [DOI] [PubMed] [Google Scholar]
- Takahata T, Higo N, Kaas JH, Yamamori T. Expression of immediate-early genes reveals functional compartments within ocular dominance columns after brief monocular inactivation. Proc Natl Acad Sci U S A. 2009a;106(29):12151–12155. doi: 10.1073/pnas.0905092106. [DOI] [PMC free article] [PubMed] [Google Scholar]
- Takahata T, Komatsu Y, Watakabe A, Hashikawa T, Tochitani S, Yamamori T. Differential expression patterns of occ1-related genes in adult monkey visual cortex. Cereb Cortex. 2009b;19(8):1937–1951. doi: 10.1093/cercor/bhn220. [DOI] [PMC free article] [PubMed] [Google Scholar]
- Tao X, Zhang B, Shen G, Wensveen J, Smith EL, 3rd, Nishimoto S, Ohzawa I, Chino YM. Early monocular defocus disrupts the normal development of receptive-field structure in V2 neurons of macaque monkeys. J Neurosci. 2014;34(41):13840–13854. doi: 10.1523/JNEUROSCI.1992-14.2014. [DOI] [PMC free article] [PubMed] [Google Scholar]
- Tychsen L, Wong AM, Burkhalter A. Paucity of horizontal connections for binocular vision in V1 of naturally strabismic macaques: Cytochrome oxidase compartment specificity. J Comp Neurol. 2004;474(2):261–275. doi: 10.1002/cne.20113. [DOI] [PubMed] [Google Scholar]
- Van Essen DC, Newsome WT, Maunsell JH. The visual field representation in striate cortex of the macaque monkey: asymmetries, anisotropies, and individual variability. Vision Res. 1984;24(5):429–448. doi: 10.1016/0042-6989(84)90041-5. [DOI] [PubMed] [Google Scholar]
- Wang Y, Zhang B, Tao X, Wensveen JM, Smith ELR, Chino YM. Noisy Spiking in Visual Area V2 of Amblyopic Monkeys. J Neurosci. 2017;37(4):922–935. doi: 10.1523/JNEUROSCI.3178-16.2016. [DOI] [PMC free article] [PubMed] [Google Scholar]
- Wiesel TN, Hubel DH. Effects of visual deprivation on morphology and physiology of cells in the cats lateral geniculate body. J Neurophysiol. 1963a;26:978–993. doi: 10.1152/jn.1963.26.6.978. [DOI] [PubMed] [Google Scholar]
- Wiesel TN, Hubel DH. Single-Cell Responses in Striate Cortex of Kittens Deprived of Vision in One Eye. J Neurophysiol. 1963b;26:1003–1017. doi: 10.1152/jn.1963.26.6.1003. [DOI] [PubMed] [Google Scholar]
- Wong-Riley M. Changes in the visual system of monocularly sutured or enucleated cats demonstrable with cytochrome oxidase histochemistry. Brain Res. 1979;171(1):11–28. doi: 10.1016/0006-8993(79)90728-5. [DOI] [PubMed] [Google Scholar]
- Wong-Riley M, Carroll EW. Effect of impulse blockage on cytochrome oxidase activity in monkey visual system. Nature. 1984a;307(5948):262–264. doi: 10.1038/307262a0. [DOI] [PubMed] [Google Scholar]
- Wong-Riley MT. Cytochrome oxidase: an endogenous metabolic marker for neuronal activity. Trends Neurosci. 1989;12(3):94–101. doi: 10.1016/0166-2236(89)90165-3. [DOI] [PubMed] [Google Scholar]
- Wong-Riley MT, Carroll EW. Quantitative light and electron microscopic analysis of cytochrome oxidase-rich zones in V II prestriate cortex of the squirrel monkey. J Comp Neurol. 1984b;222(1):18–37. doi: 10.1002/cne.902220103. [DOI] [PubMed] [Google Scholar]
- Wong P, Kaas JH. Architectonic subdivisions of neocortex in the gray squirrel (Sciurus carolinensis) Anat Rec (Hoboken) 2008;291(10):1301–1333. doi: 10.1002/ar.20758. [DOI] [PMC free article] [PubMed] [Google Scholar]
- Yamahachi H, Marik SA, McManus JN, Denk W, Gilbert CD. Rapid axonal sprouting and pruning accompany functional reorganization in primary visual cortex. Neuron. 2009;64(5):719–729. doi: 10.1016/j.neuron.2009.11.026. [DOI] [PMC free article] [PubMed] [Google Scholar]
- Zhang B, Tao X, Wensveen JM, Harwerth RS, Smith EL, 3rd, Chino YM. Effects of brief daily periods of unrestricted vision during early monocular form deprivation on development of visual area 2. Invest Ophthalmol Vis Sci. 2011;52(10):7222–7231. doi: 10.1167/iovs.11-7856. [DOI] [PMC free article] [PubMed] [Google Scholar]