

Abstract
Top carnivores have suffered widespread global declines, with well-documented effects on mesopredators and herbivores. We know less about how carnivores affect ecosystems through scavenging. Tasmania's top carnivore, the Tasmanian devil (Sarcophilus harrisii), has suffered severe disease-induced population declines, providing a natural experiment on the role of scavenging in structuring communities. Using remote cameras and experimentally placed carcasses, we show that mesopredators consume more carrion in areas where devils have declined. Carcass consumption by the two native mesopredators was best predicted by competition for carrion, whereas consumption by the invasive mesopredator, the feral cat (Felis catus), was better predicted by the landscape-level abundance of devils, suggesting a relaxed landscape of fear where devils are suppressed. Reduced discovery of carcasses by devils was balanced by the increased discovery by mesopredators. Nonetheless, carcasses persisted approximately 2.6-fold longer where devils have declined, highlighting their importance for rapid carrion removal. The major beneficiary of increased carrion availability was the forest raven (Corvus tasmanicus). Population trends of ravens increased 2.2-fold from 1998 to 2017, the period of devil decline, but this increase occurred Tasmania-wide, making the cause unclear. This case study provides a little-studied potential mechanism for mesopredator release, with broad relevance to the vast areas of the world that have suffered carnivore declines.
Keywords: scavenging, apex predators, mesopredators, trophic cascade, carcass use, ecosystem function
1. Introduction
Scavenging is an important ecological function that stabilizes trophic dynamics in complex communities, affecting species assemblages and ecosystem function [1–3]. Carrion is abundant and ubiquitous, and in some ecosystems, most large animals die from causes other than predation [4–6]. Because of its high nutritional quality, there is intense competition for carrion among microbial decomposers, and invertebrate and vertebrate scavengers [7,8]. Almost all carnivores are facultative scavengers, although obligate scavengers such as vultures are few, and vertebrates consume the majority of carrion globally [5].
Top-carnivore populations have suffered widespread global declines, often causing cascading effects throughout food webs [9]. These cascades can affect herbivores and vegetation [9,10] and can trigger mesopredator release, sometimes resulting in the extinction of smaller prey species [11–13]. Some obligate scavengers, too, have declined severely, such as the staggering decline of vultures (Gyps spp.) across much of Africa and Asia [14,15]. Although some ecological effects of top predators are well established, we know less about how carnivores affect communities through scavenging, which can include facilitative or competitive relationships [16–18].
Scavengers provide very important, yet little-studied ecosystem services by removing carrion [19]. Accordingly, scavenger declines may have major ramifications for humans and ecosystems [20]. For example, severe vulture declines in India increased carrion availability, which was implicated in an increase of seven million feral dogs (Canis lupus familiaris) and an increase in human deaths from rabies [21]. Carcasses can act as pools and vectors of disease, such as the bacterium Clostridium botulinum, which has caused several mass avian mortality events totalling greater than 20 000 birds from over 50 species [22].
Large-scale (i.e. tens of thousands of square kilometres) manipulations of carnivore densities are rare. However, a natural experiment is currently unfolding in Tasmania, Australia. Tasmania's largest carnivore and dominant scavenger, the Tasmanian devil (Sarcophilus harrisii; hereafter ‘devil’), is a facultative but specialized scavenger with morphological adaptations, such as highly robust teeth and massive jaw musculature for processing the hard parts of carcasses [23]. Devils have declined severely under the impact of a transmissible cancer, devil facial tumour disease (DFTD) [24,25]. DFTD was first detected in 1996 in northeast Tasmania and has subsequently spread across approximately 80% of the devil's range [26]. Local populations of devils decline by as much as 95% once the disease has been present for more than 5 years [27]. The progressive spatial spread of DFTD over a 20-year period has created a gradient of local devil populations in different stages of decline, providing a unique opportunity to study the ecological role of a dominant scavenger.
Increased carrion consumption by mesopredators is a largely unstudied potential mechanism for mesopredator release, a major threat to smaller wildlife [13]. Tasmania has three widely distributed mesopredators: the native spotted-tailed quoll (Dasyurus maculatus; hereafter ‘quoll’), native forest raven (Corvus tasmanicus; hereafter ‘raven’) and the invasive feral cat (Felis catus). Scavenging by cats is of particular interest because cats are implicated in almost all of Australia's approximately 29 mammal extinctions, representing 35% of global mammal extinctions since 1500 [28]. However, cats have caused no confirmed extinctions in Tasmania. The forest raven is an abundant avian predator and scavenger that occurs in all landscape types in Tasmania. Corvids are significant nest predators and populations have increased worldwide in response to anthropogenic landscape change [14,29]. Ravens are a major consumer of carrion and are a ubiquitous sight feeding on road-kill in Tasmania.
Here, by integrating the foraging durations of the main scavenging species into a structural equation model, we report, to our knowledge, the most detailed evidence to date that the decline of a top carnivore and dominant specialized scavenger can have cascading effects on community-wide carrion consumption at a regional scale. We experimentally deployed 96 carcasses at sites spanning the disease-caused gradient of devil density and used camera traps to record the foraging durations of vertebrate scavengers. We investigate the effects of devil population declines on: (i) carcass discovery and persistence, (ii) carcass consumption by mesopredators, two native and one invasive, and (iii) long-term population trends in an abundant mesopredator, the forest raven.
2. Material and methods
(a). Study sites
We separated Tasmania into two regions based on the timing of DFTD arrival: a healthy region in the northwest, where DFTD had not caused population declines, and a diseased region, where DFTD arrived 3–19 years prior (figure 1). We selected 12 study sites (coordinates in electronic supplementary material, figure S1) across the two regions. To select sites with varying times since disease outbreak and because DFTD occupies approximately 80% of Tasmania [26], sites were unequally distributed between the two regions, with five in the healthy region and seven in the diseased region. Six sites were in wet eucalypt/rainforest habitat and six in dry eucalypt/coastal scrub habitat, encompassing Tasmania's major habitat types. We restricted sites to northern Tasmania to avoid the north–south temperature gradient and ensured environmental comparability by selecting sites within similar average annual rainfall (dry: 650–1100 mm, wet: 1200–2000 mm; Bureau of Meteorology GIS layer), elevation (dry: less than 400 m, wet: less than 800 m) and temperature (mean maximum temperature for August: 10–14°C) ranges. We only considered potential study sites larger than 25 km2 in Parks and Wildlife reserves or State Forests, the areas of Tasmania where human influence is minimal i.e. mostly unsealed roads with low traffic, and no hunting, grazing or recent logging. All sites had a Global Human Footprint Index value of less than 20%, demonstrating relatively low and similar anthropogenic influence [30].
Figure 1.

DFTD-induced population declines of Tasmanian devils. (a) Study site locations in northern Tasmania. Circles identify two disease regions: healthy (DFTD not yet arrived) and diseased (DFTD present for decreasing number of years from east to west). (b) Linear model of devil detections per 100 camera nights predicted by years since DFTD outbreak. (c) Devil detections per 100 camera nights, split into the two disease regions. Error bars represent the bootstrapped 95% confidence interval. (Online version in colour.)
(b). Devil activity
We conducted remote-camera surveys to estimate devil activity. At each site, we deployed 20 or 21 remote cameras, approximately 1 km apart, for greater than 21 nights in September–December 2015, totalling 5654 successful monitoring nights (electronic supplementary material, figure S1 details method). We treated devil detections as unique if greater than 30 min separated the next detection, unless individuals were distinguishable by unique pelage markings. Total camera effort varied slightly among sites, so we pooled devil detections for each study site and calculated devil activity as devil detections per 100 camera nights.
(c). Carcass use
(i). Scavenging experiment
We experimentally deployed eight whole Tasmanian pademelon carcasses (Thylogale billardierii; 1.5–8 kg) at each study site in August–September 2016, totalling 96 carcasses. Tasmanian pademelon are the most widely distributed medium-sized herbivore in Tasmania and the most common prey species for devils [31]. Carcasses were deployed in winter to minimize invertebrate consumption. Carcasses were simultaneously deployed within each study site at locations randomly selected from the camera locations used in the survey for devil activity (minimum distance between carcasses approximately 1 km; electronic supplementary material, figure S1 details method). Cameras were deployed for more than 21 days after which we expected the edible flesh of the carcasses would be fully consumed. We identified the start and end of all foraging events and calculated the foraging duration in minutes for each species at each carcass.
(ii). Analysis of carcass discovery and persistence
To investigate carcass discovery and persistence, we performed survival analyses, using a mixed-effects Cox proportional hazards model (library ‘coxme’ in R v. 3.3.0), on data for the time taken for carcass discovery (hours) and complete consumption (days). We ran four separate analyses investigating how long carcass discovery took for (i) any vertebrate, (ii) devils, (iii) quolls, and (iv) ravens, given a carcass was still available to be discovered. We did not analyse carcass discovery by cats because they discovered too few carcasses for survival analysis. We defined discovery as the first time a species of interest located and fed on a carcass. We defined a carcass as fully consumed when a final foraging event clearly consumed all of the remaining carcass, or as the 95th percentile foraging event when foraging activity dragged out for many days, given the carcass appeared to be more than 95% consumed. This removed short final foraging events that consumed very little, such as ravens pecking at a small amount of skin.
Survival analysis is well-suited to censored data [32]. Discovery data were right censored because not all carcasses were discovered by each species of interest before complete carcass consumption. Persistence data were right censored because some memory cards filled up before the carcass was fully consumed (n = 9), and some carcasses were prematurely removed from the view of the camera (n = 9). One carcass was excluded because the camera returned no images.
For the Cox models, we used all combinations of four predictor variables: (i) a continuous variable for years since DFTD onset (years diseased); (ii) habitat type (habitat); (iii) devil detections per 100 camera nights from the initial camera survey (devil activity); and (iv) initial carcass weight (carcass weight). We grouped the eight carcass replicates at each site as a random factor to account for their non-independence. All predictors had a Pearson's correlation coefficient r < 0.6. Models were selected based on Akaike's information criterion corrected for small sample size (AICc) weights. For visualization, we separated sites into the two disease regions (figure 1) and presented the Kaplan–Meier estimates of the survival function and the log-rank test comparing the two survival curves (libraries ‘survival’ and ‘survminer’ in R v. 3.3.0).
(iii). Analysis of carcass consumption
We used piecewise structural equation modelling (SEM) to investigate the cascading effects of DFTD on carcass consumption among the main scavengers. We sought to test the hypothesis that devil declines allow other species to consume more carrion, and to elucidate the mechanisms that cause differences in carrion consumption. In contrast to classical SEM, which estimates parameter values globally, piecewise SEM calculates local estimates for each response variable using individual regressions that correspond to a single causal network [33,34]. This enables the use of mixed models to accommodate nested data and allows fitting of a wide range of distributions [33].
We developed the a priori SEM based on our knowledge of the trophic relationships between devils and the three mesopredators: ravens, quolls and cats (electronic supplementary material, figure S2 for justification of the SEM structure). We modelled five response variables: (i) devil activity (from the initial camera survey), (ii) devil foraging duration, (iii) raven foraging duration, (iv) quoll foraging duration, and (v) cat foraging as a binary variable. We additionally included habitat type, years diseased and initial carcass weight as covariates (electronic supplementary material, table S1 for variable descriptions). The ratio of total samples to the number of variables was 11.25, above the recommended five [35]. Six carcasses were omitted, leaving 90 for the analysis of carcass consumption; three because they were removed from the view of the camera with more than 50% remaining, two because the camera failed to pick up foraging events reliably, and one because the camera failed. Although black rats (Rattus rattus) were observed at 12 carcasses, and they might be frequent consumers of carrion, we excluded them from the analysis because the cameras were unreliable in detecting their movements.
To construct the SEM, we first separately fitted the individual regressions that comprise the SEM (electronic supplementary material, table S2 for model structures). We used generalized linear mixed-effects models (GLMM) to model each species' carcass use and included ‘site’ as a random factor because carcasses were nested within site. Foraging data for all species followed a gamma distribution and were zero-inflated, suggesting a two-process mechanism for data generation: first, a binary process of carcass discovery by a species, and second, how much a species consumed if it located a carcass. To mirror these two processes, we used hurdle models, which first modelled whether a species fed at a carcass (GLMM with binomial distribution), and then modelled how long a species fed for the non-zero data (GLMM with gamma distribution). This follows recommendations that zero-inflated data may suggest a two-process mechanism involved in generating the data, in which case one may wish to use local specifications within an SEM framework to match the situation [34]. Sparse data precluded the second stage of modelling for cats. Models were fitted using the ‘lme4’ package in R. We visually assessed model predicted values versus residuals to verify that the individual models met their necessary assumptions.
We used the ‘piecewiseSEM’ R package [33] to derive the claims of conditional independence, from which we calculated the overall fit of the SEM using Shipley's test of d-separation [36]. This tests the assumption that all variables are conditionally independent, which implies there are no missing relationships among unconnected variables [33]. The hypothesized relationships were considered consistent with the data when Fisher's C had p > 0.05, meaning the SEM represents the data well and there are no missing relationships.
We calculated standardized path coefficients using the ‘relevant range’ method [37]. This involved varying a predictor from its minimum to maximum, while holding all other predictors at their mean, and calculating the change in the response variable as a proportion of its range. We presented parameters that were statistically significant at α = 0.05, and calculated the marginal R2 for each response variable ([38]; ‘MuMIn’ package in R).
(d). Forest raven population trends
To investigate changes in raven populations over the last two decades, we analysed forest raven (Corvus tasmanicus) presence–absence records from the BirdLife Australia database. We used data from 20 min 2 ha standardized surveys that record all species sighted ([39] for the survey method). We used surveys from 1998 to 2017 (data extracted 14 November 2017), and only used sites in northern Tasmania to align with our study sites. We excluded records within 2 km of towns, resulting in a final dataset of 1932 surveys.
We fitted GLMMs (binomial distribution) to investigate whether the reporting rate of ravens was associated with devil declines. Some sites were surveyed numerous times while most were surveyed once in an ad-hoc fashion. We first accounted for environmental conditions that differed among sites and years because preliminary analysis and previous research [40] showed environmental associations with raven presence–absence. Therefore, we held a suite of environmental covariates constant in all models (details in the electronic supplementary material, table S3) and then tested the additional predictive ability of adding temporal variables: ‘years diseased’; ‘survey year’ to investigate temporal changes that are unrelated to devil declines; and an interaction between ‘DFTD region’ and ‘survey year’ to test whether temporal changes in raven detections differed regionally.
Preliminary analysis indicated spatial autocorrelation in the residuals, which we accounted for by grouping sites into grid cells (0.3° × 0.3°; electronic supplementary material, figure S3) that were included as a random effect. To aid model convergence, all continuous variables were scaled by subtracting the mean and dividing by the standard deviation. We ran seven models (electronic supplementary material, table S7), which were ranked based on AICc weights. We visually assessed plots of binned model residuals against predicted values to verify the final model met the necessary assumptions.
3. Results
(a). Disease-induced devil population declines
DFTD has caused substantial population declines at most diseased study sites. The survey for devil activity detected 439 unique devil visitations in 5654 camera nights, and the number of detections was negatively associated with the time since DFTD arrival at a site (figure 1; βYearsDFTD = −0.42, p = 0.039, R2 = 0.36). Devil activity appeared to decline rapidly after a disease outbreak, and then level out, confirming patterns already extensively documented [24,25,27]. On average, healthy sites had 3.3-fold more devil detections than diseased sites (figure 1).
(b). Carcass discovery and persistence
Devil declines had significant cascading effects on rates of carcass discovery and persistence. Carcasses persisted approximately 2.6-fold longer in the diseased region (figure 2), and ‘years diseased’ had a relative parameter importance of 96% (electronic supplementary material, table S4). The best model estimated a 3.1-fold increase in the odds of a carcass persisting in the environment when comparing the longest-diseased sites with those that are disease-free, holding all other predictors constant.
Figure 2.
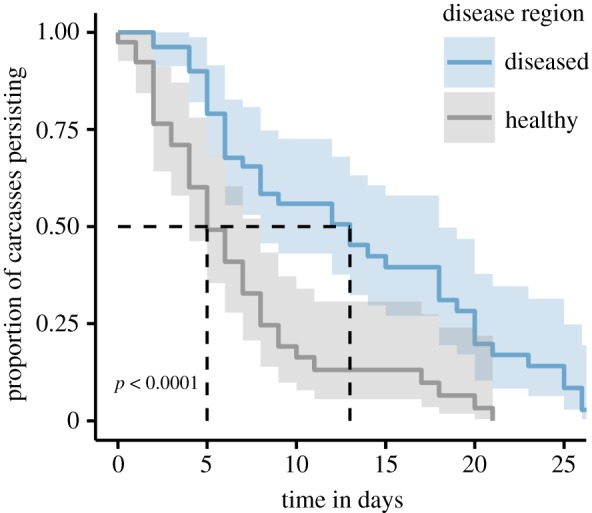
Carcass persistence. Kaplan–Meir estimate of the survival function for the proportion of carcasses persisting in the environment, divided into the two disease regions. Light shading shows the 95% confidence interval. The dotted line shows that median carcass persistence time is approximately 2.6-fold longer in the diseased region. The p-value is from the log-rank test comparing the survival curves. (Online version in colour.)
Devils found carcasses much more slowly at diseased study sites (figure 3), with ‘devil activity’ significantly and positively associated with carcass discovery (relative importance of parameter 79%; electronic supplementary material, table S4). The inverse was apparent for ravens and quolls, which found carcasses sooner at diseased sites (figure 3) and had a significant negative association with ‘devil activity’ (relative importance of parameter 73% and 72% respectively; electronic supplementary material, table S4). When all vertebrates were pooled, there was no difference in discovery rates between the disease regions (figure 3), and ‘devil activity’ and ‘years diseased’ were not important predictors of carcass discovery (electronic supplementary material, table S4).
Figure 3.

Carcass discovery. Kaplan–Meir estimates of the survival function for the proportion of carcasses not discovered by (a) any vertebrate species, (b) Tasmanian devils, (c) forest ravens and (d) spotted-tailed quolls, divided into the two disease regions; light shading shows the 95% confidence intervals. The p-value is from the log-rank test comparing the survival curves. (Online version in colour.)
(c). Carcass consumption
Camera traps recorded 13 species (electronic supplementary material, table S5) feeding on the experimentally placed carcasses from 492 463 photos, totalling 651 h of foraging. Shipley's [36] test of d-separation indicated the SEM had no missing paths and the model is a good fit to the data (Fisher's C = 4.50, p = 0.81).
DFTD had cascading effects on carrion consumption by the four most common scavengers. Devils were the major scavenger in the healthy region, averaging approximately 80% of total foraging time, compared to less than 30% in the diseased region (figure 4). The inverse relationship was apparent for the next three most common scavengers: ravens, quolls and cats, which all foraged more in the diseased region (figure 4). The final SEM (figure 5) demonstrated that disease duration had a negative effect on devil activity (β = −0.39, all coefficients are standardized), and devil activity (a proxy for abundance) had a positive effect on the odds of a devil feeding at a carcass (β = 0.5) and devil foraging duration (β = 0.13). All raw model outputs are shown in the electronic supplementary material, table S6.
Figure 4.

Carcass consumption. The proportion of total foraging duration was calculated as a species' foraging duration divided by the total foraging time of all species at a carcass. The dots represent the mean values for the 12 study sites; error bars represent the bootstrapped 95% confidence interval. Owing to sparse data for feral cats, we show the proportion of carcasses at which cats fed. (Online version in colour.)
Figure 5.

Final piecewise structural equation model investigating the cascading effects of DFTD on the consumption of experimentally placed carcasses. ‘Devil activity’ is an index of Tasmanian devil activity and is a proxy for population density across a gradient of devil decline. Coefficients have been standardized using the ‘relevant range’ method. We used hurdle models for devils, ravens and quolls; (1) represents the binomial stage of the hurdle model and (2) represents modelling on non-zero data. Carcass weight is included in the statistical models as a covariate but is not displayed here for visual clarity (see the electronic supplementary material, table S6 for unstandardized coefficients). Bold lines indicate significant paths at α = 0.05 (*p < 0.05, **p < 0.01, ***p < 0.001) and dashed lines indicate non-significant paths. Red lines indicate negative relationships, black lines indicate positive relationships and double-headed arrows represent relationships that we did not assign a directionality to. (Online version in colour.)
As a proportion of total foraging time, ravens fed about four-fold longer on average in the diseased region, the greatest increase of all species (figure 4). The hurdle model revealed that carcass consumption by devils had a strong negative effect on the odds of a raven feeding at a carcass (β = −0.84) and the duration that ravens fed following carcass discovery (β = −0.31; figure 5). The odds of a raven feeding at a carcass were 6.3-fold greater in dry habitat, where they are thought to be at higher densities, than in wet habitat.
Quolls fed about four-fold longer in the diseased region than in the healthy region (figure 4), as a proportion of total foraging time. Carcass consumption by devils had a negative effect on the odds of a quoll feeding at a carcass (β = −0.57); however, once a quoll started to feed on a carcass (i.e. for the non-zero foraging times), there was no statistically significant relationship with devil carcass consumption (figure 5). Instead, years since DFTD onset was a better predictor of how long quolls fed if they located and commenced feeding on a carcass (β = 0.56).
Cats showed a different type of negative relationship with devils. In contrast to the native mesopredators, devil activity—a proxy for devil population density—was the only significant predictor of whether a cat fed on a carcass (β = −0.29; figure 5). This was largely because cats foraged most frequently on carcasses (50% of carcasses) at the study site with the smallest devil population, suggesting that cats avoid feeding on carcasses when they are likely to encounter a devil.
(d). Forest raven population trends
Ravens were reported in 48% of 1932 long-term bird surveys, the highest reporting rate of any species, reflecting their broad distribution [41]. The best-supported GLMM estimated a 2.2-fold state-wide increase in the odds of sighting a raven for the period 1998–2017 (the model containing ‘survey year’ carried 79% of model weights; electronic supplementary material, table S7). There was no evidence, however, that this increasing trend differed with DFTD region; models 3 and 4 allowed the effect of ‘survey year’ to vary by ‘DFTD region’, and each model carried only 6% weight (electronic supplementary material, table S7).
4. Discussion
We exploit a rare natural experiment involving the severe, almost range-wide population decline of a top predator and specialized scavenger. This revealed regional-scale, community-level changes in carrion consumption and decelerated carrion cycling. Our novel approach to model the scavenger community as a network of competing species, represented by a structural equation model, shows that top-down control by devils occurs through different pathways for the native species (quolls and ravens), which have a long co-evolutionary history, compared with the invasive species (cats). The increase in scavenging by cats—which pose a key extinction threat for small mammals [28]—presents a previously undemonstrated mechanism for competitive release of cats. Restoring the population density of devils could therefore be a potential tool for managing the impacts of feral cats on native prey.
(a). Carcass use and carrion cycling
Although the generalist mesopredators increased their consumption and discovery of carcasses, they were unable to match the devil's ability to rapidly consume carrion, with carcasses persisting approximately 2.6-fold longer in the diseased region. This is unsurprising because devils are highly adapted scavengers [23,42] that are competitively and ecologically dominant in the Tasmanian carnivore community [43]. In other systems, facultative scavengers are also unable to functionally replace a dominant scavenger species that has declined or been experimentally excluded. In Kenya, although mammal species richness nearly tripled at carcasses without vultures, carcasses persisted nearly three times longer [44]. Exclusion of vultures from carcasses in South Carolina, USA, resulted in a 10-fold increase in carcasses not fully scavenged [45], and full consumption of ungulate carcasses took two to four times longer in an area of Spain without vultures, compared with a neighbouring area with vultures [46]. On sandy beaches, increased scavenging by corvids, dogs and foxes did not functionally replace the dominant scavenger group, raptors [47]. The experimental removal of racoons from an agricultural landscape in Indiana, USA, at a local scale of about 7 ha (range 2.46–16.32 ha) caused an increase in scavenging by opossums, but this did not compensate for the removal of racoons [48].
Some previous studies of the community-wide effects of dominant scavengers used experimental exclusion from carcasses at relatively small spatial and temporal scales [44,45,48]. However, experimental exclusion may not reflect actual population declines, because the short temporal scale does not allow mesopredator abundance to increase in response and therefore may obscure the potential for functional replacement by mesopredators. Our study, however, was conducted over large spatial scales (65 000 km2 island of Tasmania) and investigated devil populations that have been suppressed for approximately 20 years, allowing ample time for mesopredator populations to fill the scavenging void should they have the capacity to do so. Nevertheless, we arrive at the same conclusion as smaller-scale studies: sub-dominant scavengers seem unable to functionally replace dominant scavengers. Globally, there is a trend towards generalist species replacing specialist species—a ‘functional homogenization’ of biodiversity—and our work supports the broader assertion that declines of specialized species can severely reduce ecosystem functioning [49,50].
Vertebrates are the most rapid consumers of carrion [2,3,5] and global declines of large carnivores and dominant scavengers implies a widespread reduced capacity for carrion cycling [9]. Carcasses can act as pools and vectors for disease agents that affect humans, livestock and wildlife [14]. Prolonged carcass persistence may increase the risk of colonization by disease-causing bacteria and facilitate transmission to wildlife and would probably increase consumption by microbes and invertebrates, potentially leading to localized terrestrial eutrophication [14].
The native and introduced carnivores had contrasting pathways in the SEM, potentially a result of their different evolutionary histories. Carcass consumption by devils best predicted carcass consumption by ravens and quolls, implying that direct competition for carrion is the major mechanism leading to the observed differences. Competition with quolls could involve both interference competition from the presence of a devil at a carcass and exploitation competition arising from a greater quantity of consumption by devils [43,51]. Ravens and devils, however, compete solely through access to food (i.e. exploitation competition), because devils are almost always nocturnal, and ravens are strictly diurnal.
The increase in carcass consumption by quolls accords with a state-wide analysis of quoll diet. In eastern Tasmania, where devil decline was most severe, quoll scats contained a greater proportion of large mammals and fewer small mammals and invertebrates than elsewhere in the state, suggesting that a competitive release may have allowed quolls to increase their scavenging of large animals [31]. Our results here provide compelling evidence that quolls have increased their consumption of carrion, a likely explanation for the greater presence of large mammals in quoll diet in the long-diseased northeast.
In contrast to the native mesopredators, carrion consumption by the invasive feral cat was better predicted by devil activity, a proxy for devil abundance at the landscape-scale. This suggests that devils at high densities create a landscape of fear, possibly causing avoidance or risk-averse behaviour by cats. Avoidance of devils or cryptic behaviour could have a fitness cost for cats by reducing access to resources, such as carrion. Avoidance behaviour is supported by two previous studies, which showed devils alter the detectability of cats, which were detected less frequently at individual camera stations visited by devils, even in areas where devils are at naturally low densities [52] and where devils have been at disease-induced low density for a decade [53]. The increase in scavenging by cats in areas where devil decline is most severe potentially reflects a relaxation of risk-sensitive behaviour, similar to the relaxation of risk-sensitive behaviour in the brushtail possum (Trichosurus vulpecula), a major prey species for devils [54]. Elsewhere, the attraction of predators to carcasses can create islands of perceived risk for prey by increasing the likelihood of predator–prey encounters [55,56], and this may be the case for mesopredators too.
(b). Population trends in the forest raven
Ravens are the major beneficiary of increased carrion availability (based on the greatest increase in foraging duration), and analysis of long-term bird surveys revealed a 2.2-fold increase in the odds of detecting a raven from 1998 to 2017. This population trend, however, also occurred in the disease-free region, suggesting that drivers other than devil declines may have a stronger influence. Although we were unable to directly link trends in the raven population to devil declines, we caution against conclusively interpreting this to mean that devil declines have not influenced raven abundance. Multiple factors may concurrently drive the increasing trend in ravens. Ravens form large non-breeding flocks outside of territorial pairs and breeding season [57], and it is also possible that movements/dispersal have prevented a clear signal relating to changes in the devil population. The relatively small amount of pre-DFTD data (early region = approximately 1 year, mid region = 2–6 years, late region = 6–9 years), and the presence–absence rather than abundance data, may make detecting a subtle response unlikely. Monitoring how raven populations in the disease-free region respond to the impending arrival of DFTD would help resolve this.
(c). Ecological implications of scavenging by mesopredators
Multiple lines of evidence suggest that feral cat populations have increased in Tasmania following devil declines [27,58], and the increased carrion use that we report is one potential mechanism. Similarly, higher fox abundance was found in a region of Spain without vultures, where carcasses persisted longer, suggesting a scavenging-mediated mesopredator release, although this mechanism was not confirmed [46]. Cats are generally thought to prefer feeding on live prey but may resort to scavenging during lean periods [59,60]. If scavenging is important for cats during periods of prey scarcity, increased scavenging may stabilize populations by preventing crashes, which in turn may impede the recovery of prey and competitors of cats. In recent years, some Tasmanian small mammals, such as the smaller eastern quoll (Dasyurus viverrinus), have become increasingly rare; cats may have contributed to this decline [27], and high density cat populations may be preventing recovery via a ‘predator pit’ [61].
Despite the increase in scavenging by spotted-tailed quolls that we demonstrate and that others have inferred [31], no study has yet demonstrated a population-level release of quolls. This potentially reflects a complex trophic relationship between cats and quolls. High dietary overlap, similar space use and similar body size of quolls and cats imply strong interspecific competition [62]. Increased cat populations [27,58] may be preventing the competitive release of quolls from translating to a population increase. Cats are able to breed twice a year, compared to once for quolls, potentially allowing cats to increase more rapidly and outcompete quolls [58]. The lower fecundity of quolls may also result in a slower population increase, such that observable differences may not have occurred by the time of the previous studies. It is unclear how increased scavenging by quolls will affect prey species. Either, quolls may rely more on scavenged food, alleviating pressure on prey, or alternatively increased scavenging may eventually increase quoll densities, causing predation pressure to increase.
Seasonality has well-documented effects on carrion cycling [46,63], with more rapid carcass decomposition by microbes and invertebrates during warmer periods. Our results would probably differ during warmer months when competition between vertebrates and invertebrates/decomposers is higher. Our study was conducted in reserves to limit anthropogenic influence, and results would probably differ in more agricultural or urban landscapes. We were unable to investigate scavenging by black rats because cameras were unreliable in detecting their movements. Scavenging by invasive rodents could contribute to an increased abundance of invasive rodents, with cascading predatory impacts on smaller biodiversity [64]. Invasive rodents are more abundant in northeast Tasmania [58], where devils have been suppressed the longest, and carrion-mediated release is one potential mechanism that warrants future investigation.
Despite the staggering global declines of some specialized scavengers and large carnivores, little research has investigated the cascading effects of scavenging on food webs. To our knowledge, we report the most detailed evidence to date that declines of specialized scavengers can have cascading effects on carrion acquisition by mesopredators, representing a little-studied mechanism for mesopredator release. Devils limit carrion acquisition by cats, a previously unexplored mechanism for mesopredator release in cats. This potentially represents a mechanism by which devils could suppress cat populations and indirectly protect small native vertebrate species, one of Australia's most pressing conservation issues [28]. Increased carcass persistence increases the risk of carcass colonization by disease-causing bacteria, which may increase the risk of infection in wildlife and livestock. Some questions remain unanswered, such as whether carrion consumption by mesopredators has cascading effects on prey species, and the implications of top carnivore decline on invertebrate scavengers, decomposition cycles and the spread of disease. In the context of a global trend of generalists replacing specialists [49], our study further emphasizes the importance of managing specialized species that serve key ecological functions.
Supplementary Material
Acknowledgements
Mike Newman, BirdLife Tasmania and BirdLife Australia facilitated access to bird survey data. Parks and Wildlife staff assisted with field accommodation. For their assistance with fieldwork, we thank Angus McNab, Beccy Abbott, Alex Ford, Rhiannon Mundana, Tiana Pirtle, Cassandra Holt and Hanna Zoldi. Tristan Derham and Mike Newman provided comments on a draft.
Ethics
This study was conducted in accordance with the University of Tasmania Animal Ethics Committee Permit A15274 and DPIPWE scientific permits TFA15245 and TFA 16161.
Data accessibility
Scavenging data are available from the Dryad Digital Repository at: https://doi.org/10.5061/dryad.6d5046c [65]. Bird survey data were used under licence and are available from BirdLife Australia.
Authors' contributions
C.X.C., M.E.J. and C.N.J. conceived the ideas and designed the study. C.X.C. conducted the field work, led the writing and analysis. L.A.B. and T.H. provided statistical assistance. E.W. contributed expert guidance regarding the bird surveys. All authors contributed to writing.
Competing interests
We declare no competing interests.
Funding
Funding was provided by the Australian Research Council (ARC) (DP110103069) and Holsworth Wildlife Research Endowment. C.X.C. is supported by a top-up scholarship from the Save the Tasmanian Devil Appeal, M.J. on an ARC Future Fellowship (FT100100250), C.J. on an ARC Professorial Fellowship (DP110103069), E.W. by BirdLife Tasmania, and T.H. by CEBRA and Arthur Rylah Institute.
References
- 1.Rooney N, McCann K, Gellner G, Moore JC. 2006. Structural asymmetry and the stability of diverse food webs. Nature 442, 265–269. ( 10.1038/nature04887) [DOI] [PubMed] [Google Scholar]
- 2.Wilson EE, Wolkovich EM. 2011. Scavenging: how carnivores and carrion structure communities. Trends Ecol. Evol. 26, 129–135. ( 10.1016/j.tree.2010.12.011) [DOI] [PubMed] [Google Scholar]
- 3.Barton PS, Cunningham SA, Lindenmayer DB, Manning AD. 2013. The role of carrion in maintaining biodiversity and ecological processes in terrestrial ecosystems. Oecologia 171, 761–772. ( 10.1007/s00442-012-2460-3) [DOI] [PubMed] [Google Scholar]
- 4.Houston DC. 1979. The adaptations of scavengers. In Serengeti: dynamics of an ecosystem (eds Sinclair ARE, Griffiths MN), pp. 263–286. Chicago, IL: University of Chicago Press. [Google Scholar]
- 5.DeVault TL, Rhodes JOE, Shivik JA. 2003. Scavenging by vertebrates: behavioral, ecological, and evolutionary perspectives on an important energy transfer pathway in terrestrial ecosystems. Oikos 102, 225–234. ( 10.1034/j.1600-0706.2003.12378.x) [DOI] [Google Scholar]
- 6.Mduma SAR, Sinclair ARE, Hilborn R. 1999. Food regulates the Serengeti wildebeest: a 40-year record. J. Anim. Ecol. 68, 1101–1122. ( 10.1046/j.1365-2656.1999.00352.x) [DOI] [Google Scholar]
- 7.Burkepile DE, Parker JD, Woodson CB, Mills HJ, Kubanek J, Sobecky PA, Hay ME. 2006. Chemically mediated competition between microbes and animals: microbes as consumers in food webs. Ecology 87, 2821–2831. ( 10.1890/0012-9658(2006)872821:CMCBMA%5D2.0.CO;2) [DOI] [PubMed] [Google Scholar]
- 8.Hunter JS, Durant SM, Caro TM. 2007. To flee or not to flee: predator avoidance by cheetahs at kills. Behav. Ecol. Sociobiol. 61, 1033–1042. ( 10.1007/s00265-006-0336-4) [DOI] [Google Scholar]
- 9.Ripple WJ, et al. 2014. Status and ecological effects of the world's largest carnivores. Science 343, 1241484 ( 10.1126/science.1241484) [DOI] [PubMed] [Google Scholar]
- 10.Terborgh J, et al. 2001. Ecological meltdown in predator-free forest fragments. Science 294, 1923–1926. ( 10.1126/science.1064397) [DOI] [PubMed] [Google Scholar]
- 11.Johnson CN, Isaac JL, Fisher DO. 2007. Rarity of a top predator triggers continent-wide collapse of mammal prey: dingoes and marsupials in Australia. Proc. R. Soc. B 274, 341–346. ( 10.1098/rspb.2006.3711) [DOI] [PMC free article] [PubMed] [Google Scholar]
- 12.Crooks KR, Soulé ME. 1999. Mesopredator release and avifaunal extinctions in a fragmented system. Nature 400, 563–566. ( 10.1038/23028) [DOI] [Google Scholar]
- 13.Ritchie EG, Johnson CN. 2009. Predator interactions, mesopredator release and biodiversity conservation. Ecol. Lett. 12, 982–998. ( 10.1111/j.1461-0248.2009.01347.x) [DOI] [PubMed] [Google Scholar]
- 14.Buechley ER, Şekercioğlu ÇH. 2016. The avian scavenger crisis: looming extinctions, trophic cascades, and loss of critical ecosystem functions. Biol. Conserv. 198, 220–228. ( 10.1016/j.biocon.2016.04.001) [DOI] [Google Scholar]
- 15.Ogada D, et al. 2015. Another continental vulture crisis: Africa's vultures collapsing toward extinction. Conserv. Lett. 9, 89–97. ( 10.1111/conl.12182) [DOI] [Google Scholar]
- 16.Allen ML, Elbroch LM, Wilmers CC, Wittmer HU. 2015. The comparative effects of large carnivores on the acquisition of carrion by scavengers. Am. Nat. 185, 822–833. ( 10.1086/681004) [DOI] [PubMed] [Google Scholar]
- 17.Moleón M, Sánchez-Zapata JA, Selva N, Donázar JA, Owen-Smith N. 2014. Inter-specific interactions linking predation and scavenging in terrestrial vertebrate assemblages. Biol. Rev. 89, 1042–1054. ( 10.1111/brv.12097) [DOI] [PubMed] [Google Scholar]
- 18.Allen ML, Elbroch LM, Wilmers CC, Wittmer HU. 2014. Trophic facilitation or limitation? Comparative effects of pumas and black bears on the scavenger community. PLoS ONE 9, e102257 ( 10.1371/journal.pone.0102257) [DOI] [PMC free article] [PubMed] [Google Scholar]
- 19.Sekercioglu CH. 2006. Increasing awareness of avian ecological function. Trends Ecol. Evol. 21, 464–471. ( 10.1016/j.tree.2006.05.007) [DOI] [PubMed] [Google Scholar]
- 20.O'Bryan CJ, Braczkowski AR, Beyer HL, Carter NH, Watson JE.M, McDonald-Madden E. 2018. The contribution of predators and scavengers to human well-being. Nat. Ecol. Evol. 2, 229–236. ( 10.1038/s41559-017-0421-2) [DOI] [PubMed] [Google Scholar]
- 21.Markandya A, Taylor T, Longo A, Murty MN, Murty S, Dhavala K. 2008. Counting the cost of vulture decline: an appraisal of the human health and other benefits of vultures in India. Ecol. Econ. 67, 194–204. ( 10.1016/j.ecolecon.2008.04.020) [DOI] [Google Scholar]
- 22.Vidal D, Anza I, Taggart MA, Pérez-Ramírez E, Crespo E, Hofle U, Mateo R. 2013. Environmental factors influencing the prevalence of a Clostridium botulinum type C/D mosaic strain in nonpermanent Mediterranean wetlands. Appl. Environ. Microbiol. 79, 4264–4271. ( 10.1128/aem.01191-13) [DOI] [PMC free article] [PubMed] [Google Scholar]
- 23.Jones ME. 2003. Convergence in ecomorphology and guild structure among marsupial and placental carnivores. In Predators with pouches: the biology of carnivorous marsupials (eds Jones ME, Dickman CR, Archer M), pp. 281–292. Melbourne, Australia: CSIRO Publishing. [Google Scholar]
- 24.Hawkins CE, et al. 2006. Emerging disease and population decline of an island endemic, the Tasmanian devil Sarcophilus harrisii. Biol. Conserv. 131, 307–324. ( 10.1016/j.biocon.2006.04.010) [DOI] [Google Scholar]
- 25.McCallum H, Tompkins DM, Jones M, Lachish S, Marvanek S, Lazenby B, Hocking G, Wiersma J, Hawkins CE. 2007. Distribution and impacts of Tasmanian devil facial tumor disease. EcoHealth 4, 318–325. ( 10.1007/s10393-007-0118-0) [DOI] [Google Scholar]
- 26.Lazenby BT, et al. 2018. Density trends and demographic signals uncover the long-term impact of transmissible cancer in Tasmanian devils. J. Appl. Ecol. 55, 1368–1379. ( 10.1111/1365-2664.13088) [DOI] [PMC free article] [PubMed] [Google Scholar]
- 27.Hollings T, Jones M, Mooney N, McCallum H. 2014. Trophic cascades following the disease-induced decline of an apex predator, the Tasmanian devil. Conserv. Biol. 28, 63–75. ( 10.1111/cobi.12152) [DOI] [PubMed] [Google Scholar]
- 28.Woinarski JCZ, Burbidge AA, Harrison PL. 2015. Ongoing unraveling of a continental fauna: decline and extinction of Australian mammals since European settlement. Proc. Natl Acad. Sci. USA 112, 4531–4540. ( 10.1073/pnas.1417301112) [DOI] [PMC free article] [PubMed] [Google Scholar]
- 29.O'Neil ST, Coates PS, Brussee BE, Jackson PJ, Howe KB, Moser AM, Foster LJ, Delehanty DJ. 2018. Broad-scale occurrence of a subsidized avian predator: reducing impacts of ravens on sage-grouse and other sensitive prey. J. Appl. Ecol. 55, 2641–2652. ( 10.1111/1365-2664.13249) [DOI] [Google Scholar]
- 30.Wildlife Conservation Society and Centre for International Earth Science Information Network. 2005. Last of the wild project, version 2, 2005: global human footprint dataset NASA Socioeconomic Data and Applications Center, New York. [Google Scholar]
- 31.Andersen GE, Johnson CN, Barmuta LA, Jones ME. 2017. Dietary partitioning of Australia's two marsupial hypercarnivores, the Tasmanian devil and the spotted-tailed quoll, across their shared distributional range. PLoS ONE 12, e0188529 ( 10.1371/journal.pone.0188529) [DOI] [PMC free article] [PubMed] [Google Scholar]
- 32.Hosmer D, Lemeshow S, May S. 2008. Applied survival analysis: regression modeling of time-to-event data, 2nd edn Hoboken, NJ: Wiley. [Google Scholar]
- 33.Lefcheck JS. 2016. piecewiseSEM: piecewise structural equation modelling in R for ecology, evolution, and systematics. Methods Ecol. Evol. 7, 573–579. ( 10.1111/2041-210X.12512) [DOI] [Google Scholar]
- 34.Grace JB, Schoolmaster DR, Guntenspergen GR, Little AM, Mitchell BR, Miller KM, Schweiger EW. 2012. Guidelines for a graph-theoretic implementation of structural equation modeling. Ecosphere 3, 1–44. ( 10.1890/ES12-00048.1) [DOI] [Google Scholar]
- 35.Grace JB, Scheiner SM, Schoolmaster DR. 2015. Structural equation modeling: building and evaluating causal models. In Ecological statistics: contemporary theory and application (eds Fox GA, Negrete-Yanlelevich S, Sosa VJ), pp. 168–199. New York, NY: Oxford University Press. [Google Scholar]
- 36.Shipley B. 2009. Confirmatory path analysis in a generalized multilevel context. Ecology 90, 363–368. ( 10.1890/08-1034.1) [DOI] [PubMed] [Google Scholar]
- 37.Grace JB, Bollen KA. 2005. Interpreting the results from multiple regression and structural equation models. Bull. Ecol. Soc. Am. 86, 283–295. ( 10.1890/0012-9623(2005)86%5B283:ITRFMR%5D2.0.CO;2) [DOI] [Google Scholar]
- 38.Nakagawa S, Schielzeth H. 2013. A general and simple method for obtaining R2 from generalized linear mixed-effects models. Methods Ecol. Evol. 4, 133–142. ( 10.1111/j.2041-210x.2012.00261.x) [DOI] [Google Scholar]
- 39.BirdLife Australia. 2018. Bird data survey techniques. See https://birdata.birdlife.org.au/survey-techniques
- 40.Fielding M. 2017. Response of opportunistic predatory birds to land-use change with implications for avian prey species. Hobart, Tasmania: University of Tasmania. [Google Scholar]
- 41.Thomas D. 1979. Tasmanian bird atlas. Hobart, Tasmania: University of Tasmania. [Google Scholar]
- 42.Jones ME, Barmuta LA. 2000. Niche differentiation among sympatric Australian dasyurid carnivores. J. Mammal. 81, 434–447. ( 10.1644/1545-1542(2000)081%3C0434:NDASAD%3E2.0.CO;2) [DOI] [Google Scholar]
- 43.Jones ME, Barmuta LA. 1998. Diet overlap and relative abundance of sympatric dasyurid carnivores: a hypothesis of competition. J. Anim. Ecol. 67, 410–421. ( 10.1046/j.1365-2656.1998.00203.x) [DOI] [Google Scholar]
- 44.Ogada DL, Torchin ME, Kinnaird MF, Ezenwa VO. 2012. Effects of vulture declines on facultative scavengers and potential implications for mammalian disease transmission. Conserv. Biol. 26, 453–460. ( 10.1111/j.1523-1739.2012.01827.x) [DOI] [PubMed] [Google Scholar]
- 45.Hill JE, DeVault TL, Beasley JC, Rhodes OE, Belant JL. 2018. Effects of vulture exclusion on carrion consumption by facultative scavengers. Ecol. Evol. 8, 2518–2526. ( 10.1002/ece3.3840) [DOI] [PMC free article] [PubMed] [Google Scholar]
- 46.Morales-Reyes Z, Sánchez-Zapata JA, Sebastián-González E, Botella F, Carrete M, Moleón M. 2017. Scavenging efficiency and red fox abundance in Mediterranean mountains with and without vultures. Acta Oecol. 79, 81–88. ( 10.1016/j.actao.2016.12.012) [DOI] [Google Scholar]
- 47.Huijbers CM, Schlacher TA, Schoeman DS, Olds AD, Weston MA, Connolly RM. 2015. Limited functional redundancy in vertebrate scavenger guilds fails to compensate for the loss of raptors from urbanized sandy beaches. Divers. Distrib. 21, 55–63. ( 10.1111/ddi.12282) [DOI] [Google Scholar]
- 48.Olson ZH, Beasley JC, DeVault TL, Rhodes OE. 2012. Scavenger community response to the removal of a dominant scavenger. Oikos 121, 77–84. ( 10.1111/j.1600-0706.2011.19771.x) [DOI] [Google Scholar]
- 49.Clavel J, Julliard R, Devictor V. 2011. Worldwide decline of specialist species: toward a global functional homogenization? Front. Ecol. Environ. 9, 222–228. ( 10.1890/080216) [DOI] [Google Scholar]
- 50.Mateo-Tomás P, Olea PP, Moleón M, Selva N, Sánchez-Zapata JA. 2017. Both rare and common species support ecosystem services in scavenger communities. Global Ecol. Biogeogr. 26, 1459–1470. ( 10.1111/geb.12673) [DOI] [Google Scholar]
- 51.Prior KA, Weatherhead PJ. 1991. Competition at the carcass: opportunities for social foraging by turkey vultures in southern Ontario. Can. J. Zool. 69, 1550–1556. ( 10.1139/z91-218) [DOI] [Google Scholar]
- 52.Lazenby BT, Dickman CR. 2013. Patterns of detection and capture are associated with cohabiting predators and prey. PLoS ONE 8, e0059846 ( 10.1371/journal.pone.0059846) [DOI] [PMC free article] [PubMed] [Google Scholar]
- 53.Fancourt BA. 2016. Avoiding the subject: the implications of avoidance behaviour for detecting predators. Behav. Ecol. Sociobiol. 70, 1535–1546. ( 10.1007/s00265-016-2162-7) [DOI] [Google Scholar]
- 54.Hollings T, McCallum H, Kreger K, Mooney N, Jones M. 2015. Relaxation of risk-sensitive behaviour of prey following disease-induced decline of an apex predator, the Tasmanian devil. Proc. R. Soc. B 282, 20150124 ( 10.1098/rspb.2015.0124) [DOI] [PMC free article] [PubMed] [Google Scholar]
- 55.Cortés-Avizanda A, Selva N, Carrete M, Donázar JA. 2009. Effects of carrion resources on herbivore spatial distribution are mediated by facultative scavengers. Basic Appl. Ecol. 10, 265–272. ( 10.1016/j.baae.2008.03.009) [DOI] [Google Scholar]
- 56.Cortés-Avizanda A, Carrete M, Serrano D, Donázar JA. 2009. Carcasses increase the probability of predation of ground-nesting birds: a caveat regarding the conservation value of vulture restaurants. Anim. Conserv. 12, 85–88. ( 10.1111/j.1469-1795.2008.00231.x) [DOI] [Google Scholar]
- 57.Higgins PJ, Peter JM, Cowling SJ. 2006. Handbook of Australian, New Zealand & Antarctic birds: boatbill to starlings. Melbourne, Australia: Oxford University Press. [Google Scholar]
- 58.Hollings T, Jones M, Mooney N, McCallum HI. 2016. Disease-induced decline of an apex predator drives invasive dominated states and threatens biodiversity. Ecology 97, 394–405. ( 10.1890/15-0204.1) [DOI] [PubMed] [Google Scholar]
- 59.Jones E. 1977. Ecology of the feral cat, Felis catus (L.), (Carnivora:Felidae) on Macquarie Island. Wildl. Res. 4, 249–262. ( 10.1071/WR9770249) [DOI] [Google Scholar]
- 60.Catling PC. 1988. Similarities and contrasts in the diets of foxes, Vulpes vulpes, and cats, Felis catus, relative to fluctuating prey populations and drought. Wildl. Res. 15, 307–317. ( 10.1071/WR9880307) [DOI] [Google Scholar]
- 61.Fancourt BA, Hawkins CE, Cameron EZ, Jones ME, Nicol SC. 2015. Devil declines and catastrophic cascades: is mesopredator release of feral cats inhibiting recovery of the eastern quoll? PLoS ONE 10, e0119303 ( 10.1371/journal.pone.0119303) [DOI] [PMC free article] [PubMed] [Google Scholar]
- 62.Glen AS, Dickman CR. 2008. Niche overlap between marsupial and eutherian carnivores: does competition threaten the endangered spotted-tailed quoll? J. Appl. Ecol. 45, 700–707. ( 10.1111/j.1365-2664.2007.01449.x) [DOI] [Google Scholar]
- 63.Turner KL, Abernethy EF, Mike Conner L, Rhodes OE, Beasley JC. 2017. Abiotic and biotic factors modulate carrion fate and vertebrate scavenging communities. Ecology 98, 2413–2424. ( 10.1002/ecy.1930) [DOI] [PubMed] [Google Scholar]
- 64.Imber M, Harrison M, Harrison J. 2000. Interactions between petrels, rats and rabbits on Whale Island, and effects of rat and rabbit eradication. N. Z. J. Ecol. 24, 153–160. [Google Scholar]
- 65.Cunningham CX, Johnson CN, Barmuta LA, Hollings T, Woehler E, Jones M. 2018. Data from: Top carnivore decline has cascading effects on scavengers and carrion persistence Dryad Digital Repository. ( 10.5061/dryad.6d5046c) [DOI] [PMC free article] [PubMed]
Associated Data
This section collects any data citations, data availability statements, or supplementary materials included in this article.
Data Citations
- Cunningham CX, Johnson CN, Barmuta LA, Hollings T, Woehler E, Jones M. 2018. Data from: Top carnivore decline has cascading effects on scavengers and carrion persistence Dryad Digital Repository. ( 10.5061/dryad.6d5046c) [DOI] [PMC free article] [PubMed]
Supplementary Materials
Data Availability Statement
Scavenging data are available from the Dryad Digital Repository at: https://doi.org/10.5061/dryad.6d5046c [65]. Bird survey data were used under licence and are available from BirdLife Australia.