Correction to: Arthritis Res Ther (2017) 19:278
https://doi.org/10.1186/s13075-017-1479-6
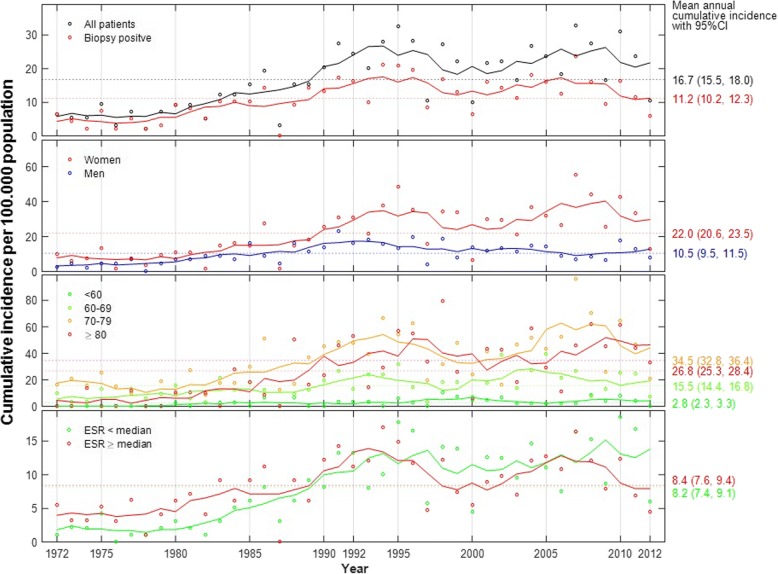
Following publication of the original article [1], the authors reported an error. The incorrect sex-specific incidences of GCA were published. The correct mean annual cumulative incidence was 22.0 (95% CI 20.6–23.5) for women and 10.5 (95% CI 9.5–11.5) for men; p-value < 0.001 unaffected by the error. Revised versions of Fig. 2 and Table 2 are provided in this correction. Additionally, in the results section (page 4, first section) we report results of a sub-analysis of an extended cohort (n = 881). The correct annual cumulative incidence for women in this group was 24.1 and for men 11.6.
Fig. 2.
Annual cumulative incidence of giant cell arteritis (American College of Rheumatology (ACR) criteria fulfilled) in Bergen health area 1972–2012. Overall and ESR-specific cumulative incidence calculated as cases per 100,000 general population over the age of 50 years. Incidence by sex was calculated per 100,000 women or men, respectively, and incidence by the different age categories was calculated per 100,000 population of the same age categories (< 60 years, 60–69 years, 70–79 years and 80+ years). Points plotted represent raw incidence. Solid lines were estimated using the smoothing technique of a moving average of 5 years. ESR, erythrocyte sedimentation rate
Table 2.
The incidence of giant cell arteritis (GCA) in Bergen health area 1972–2012
| a Mean annual cumulative incidence | ||||||
| All time | 1972–1992 | 1993–2012 | ||||
| Cumulative incidence | 95% CI | Cumulative incidence | 95% CI | Cumulative incidence | 95% CI | |
| All patients | 16.7 | (15.5, 18.0) | 11.2 | (9.8, 12.7) | 22.5 | (20.5, 24.7) |
| Sex | ||||||
| Female | 22.0 | (20.6, 23.5) | 13.3 | (11.8, 14.9) | 31.2 | (28.8, 33.7) |
| Male | 10.5 | (9.5, 11.5) | 8.6 | (7.4, 9.9) | 12.4 | (10.9, 14.0) |
| Age, years | ||||||
| < 60 | 2.8 | (2.3, 3.3) | 1.5 | (1.0, 2.1) | 4.1 | (3.3, 5.0) |
| 60–69 | 15.5 | (14.4, 16.8) | 10.9 | (9.6, 12.4) | 20.3 | (18.4, 22.4) |
| 70–79 | 34.5 | (32.8, 36.4) | 23.4 | (21.4, 25.6) | 46.2 | (43.3, 49.2) |
| 80+ | 26.8 | (25.3, 28.4) | 14.3 | (12.8, 16.0) | 39.9 | (37.2, 42.7) |
| ESR, mm/hr | ||||||
| ESR < 85 | 8.2 | (7.3, 9.1) | 4.5 | (3.7, 5.5) | 12.0 | (10.6, 13.6) |
| ESR > 85 | 8.4 | (7.6, 9.3) | 6.6 | (5.5, 7.7) | 10.4 | (9.0, 11.8) |
| b Relative risk (RR) according to time, sex, age and ESR | ||||||
| 1972–1992 | 1993–2012 | |||||
| RR | 95% CI | p-value | RR | 95% CI | p-value | |
| Unadjusted | ||||||
| Time (years) | 1.1 | (1.1, 1.1) | < 0.001 | 1.0 | (1.0, 1.0) | 0.543 |
| Sex | ||||||
| Time (years) | 1.1 | (1.1, 1.1) | < 0.001 | 1.0 | (1.0, 1.0) | 0.462 |
| Sex (Male vs. Female) | 0.6 | (0.5, 0.8) | < 0.001 | 0.4 | (0.3, 0.5) | < 0.001 |
| Age | ||||||
| Time (years) | 1.1 | (1.1, 1.1) | < 0.001 | 1.0 | (1.0, 1.0) | 0.135 |
| 60–69 vs. < 60 | 7.2 | (5.1, 10.6) | < 0.001 | 5.0 | (3.9, 6.4) | < 0.001 |
| 70–79 vs. < 60 | 15.4 | (11.0, 22.5) | < 0.001 | 11.3 | (9.1, 14.3) | < 0.001 |
| 80+ vs. < 60 | 9.5 | (6.7, 13.9) | < 0.001 | 9.8 | (7.8, 12.4) | < 0.001 |
| ESR | ||||||
| Time (years) | 1.1 | (1.1, 1.1) | < 0.001 | 1.0 | (1.0, 1.0) | 0.632 |
| ESR (>median vs. <median) | 1.4 | (1.1, 1.9) | 0.006 | 0.9 | (0.7, 1.0) | 0.116 |
Overall and ESR-specific cumulative incidence reported as cases per 100,000 background population over the age of 50 years. Incidence for sex reported per 100,000 women or men respectively, and incidence for the different age categories reported per 100,000 population of the same age categories (< 60 years, 60–69 years, 70–79 years and 80+ years). Relative risk calculated according to Poisson regression models for the two timeperiods 1972–1992 and 1993–2012
ESR Erythrocyte sedimentation rate
CI Confidence interval
Reference
- 1.Brekke LK, et al. Incidence of giant cell arteritis in Western Norway 1972–2012: a retrospective cohort study. Arthritis Res Ther. 2017;19:278. doi: 10.1186/s13075-017-1479-6. [DOI] [PMC free article] [PubMed] [Google Scholar]


