

Abstract
Magnetic particles can enrich desired cell populations to aid in understanding cell-type functions and mechanisms, diagnosis, and therapy. As cells are heterogeneous in ligand type, location, expression, and density, careful consideration of magnetic particle design for positive isolation is necessary. Antigen-specific immune cells have low frequencies, which has made studying, identifying, and utilizing these cells for therapy a challenge. Here we demonstrate the importance of magnetic particle design based on the biology of T cells. We create magnetic particles which recognize rare antigen-specific T cells and quantitatively investigate important particle properties including size, concentration, ligand density, and ligand choice in enriching these rare cells. We observe competing optima among particle parameters, with 300 nm particles functionalized with a high density of antigen-specific ligand achieving the highest enrichment and recovery of target cells. In enriching and then activating an endogenous response, 300 nm aAPCs generate nearly 65% antigen-specific T cells with at least 450-fold expansion from endogenous precursors and a 5-fold increase in numbers of antigen-specific cells after only seven days. This systematic study of particle properties in magnetic enrichment provides a case study for the engineering design principles of particles for the isolation of rare cells through biological ligands.
Keywords: Nanoparticles, Magnetic enrichment, Artificial antigen-presenting cells, T cells, Immunotherapy, Size
Graphical Abstract
1. INTRODUCTION
The clinical success of recent advances in immunotherapies such as checkpoint blockade, chimeric antigen receptor T cell therapy, and adoptive cell transfer (ACT) shows the critical importance of using the immune system to fight disease. Particularly, finding and eliciting antigen-specific responses has gained significance as this minimizes off-target side-effects including autoimmunity while creating durable memory [1–3]. However, understanding, diagnosing, and predicting antigen-specific immune cell responses has been limited due to the exceptionally low frequency of these cells. For example, antigen-specific CD8+ T cells are between 1-in-104 to 1-in-106 CD8+ T cells [4,5]. Thus, there is a need for techniques to isolate and characterize antigen-specific immune responses for cancer, autoimmune, and pathogen responses.
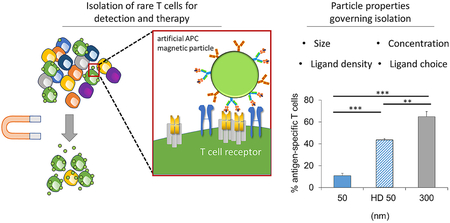
We have previously developed an approach to magnetically enrich and expand these rare antigen-specific CD8+ T cells to detectable levels for immunotherapy [6]. We created artificial antigen-presenting cells (aAPCs) by chemically attaching dimeric major histocompatibility complex (MHC-Ig), that can be loaded with antigenic peptide sequences, and anti-CD28 monoclonal antibody to the surface of a magnetic nanoparticle (Fig. 1A). The peptide-MHC complex (pMHC) confers antigen-specificity and binds the T cell receptor (TCR) while the anti-CD28 promotes stimulation through the co-stimulatory receptor CD28 on the surface of the T cell.
Figure 1:

Particle aAPC size influences antigen-specific cell enrichment. (A) Artificial antigen-presenting cells (aAPCs) are formed by conjugating Signal 1, which is antigen-loaded dimeric MHC-Ig, and Signal 2, which is co-stimulatory antibody towards CD28. Together they provide antigen-specific recognition and signaling to activate antigen-specific T cells and proliferate. (B) Experimental set up to identify key particle parameters influencing antigen-specific T cell enrichment. Fluorescently labeled transgenic 2C T cells were doped in at a 1 to 1000 ratio with wildtype non-specific B6 T cells. Schematic not drawn to scale in order to visualize aAPC binding to cells. (C) An example flow plot of fold enrichment that is characterized by analyzing pre-enrichment and post-enrichment populations by flow cytometry. (D) Fold enrichment is significantly lower in 50 nm aAPCs compared to other sized aAPCs at an amount of particles controlled for 115 fmol of pMHC-conjugated to the surface per 106 CD8+ T cells (error bars show s.e.m.; ***p < 0.001, **p < 0.001, *p < 0.05, n = 3, one-way ANOVA with Tukey’s post test). (E) Binding avidity changes based on particle size, where aAPC dose was varied and the percent of transgenic CD8+ T cells bound by particles was quantified by flow cytometry.
The initial design was based on a 50 nm particle to mimic other current antibody cell-based particle isolations. However, this “one size fits all” approach may not be optimal for antigen-specific T cell enrichment which depend on lower affinity pMHC-TCR interactions. Recently, we and others have studied how aAPC nanoparticle size and ligand density affect the stimulation and expansion of antigen-specific T cells [7,8], and have found that T cells are sensitive to both size and ligand density due to the necessity for local TCR clustering and sustained signaling. Particles larger than 300 nm were able to efficiently cluster multiple TCRs presumably through multivalent interaction with TCR-rich nano-islands [9,10]. Consequently, we hypothesized that aAPC nanoparticle size and ligand density would also affect the enrichment of antigen-specific T cells due to differential particle-T cell interactions such as multivalent binding.
Here we systematically studied particle properties, which provide the most effective enrichment of antigen-specific target cells, with outputs of both cell recovery and fold enrichment. We compared different aAPC particle sizes and their abilities to enrich antigen-specific T cells and correlated this back to their binding activity. We varied the ligand choice and density to determine optimal configurations and examined how the concentration of particles affects the recovery and purity of antigen-specific cells. With multiple engineering inputs and outputs we revealed that there are competing optima, where enhancing one property may increase one output but decrease another. Study of the parameter landscape allowed us to optimize to balance these competing optima to achieve higher percentages and numbers of antigen-specific T cells for both detection and therapeutic applications.
2. MATERIALS AND METHODS
Mice.
Mice were maintained per guidelines approved by the Johns Hopkins University’s Institutional Review Board. C57BL/6J mice were purchased from Jackson Laboratories (Bar Harbor, ME). 2C T cell receptor transgenic mice were kept as heterozygotes by breeding on a C57BL/6 background. Mice were used between 8–10 weeks of age.
Peptide-MHC Dimer Production.
Dimeric peptide-loaded MHC-Ig was produced as previously described[11]. Briefly, Kb-Ig was produced using hybridoma cell lines in serum free media and captured on a NP sepharose column. Kb-Ig was loaded with the SIYRYYGL peptide (GenScript, Piscataway, NJ) using active protein folding via buffer exchange and washed using membrane ultrafiltration with a Vivaspin 20 50 kDa MWCO (GE Healthcare). Non-cognate TRP2 peptide (SVYDFFVWL), (GenScript), was loaded in the same way. Fluorescent KbSIY was produced by labeling with Fluorescein-5-Isothiocyanate (FITC 'Isomer I') (Sigma Aldrich, St. Louis, MO) per manufacturer’s recommendations. Briefly, a 1 M carbonate-bicarbonate buffer at a pH of 9.0 was added at a 1:10 ratio to the KbSIY. FITC-isothiocyanate was dissolved in DMSO (Sigma Aldrich) at a concentration of 1 mg/mL and added to the KbSIY at a 5:1 molar ratio and allowed to react for 2 hours at room temperature. FITC-KbSIY was washed using membrane ultrafiltration at a 50 kDa MWCO (GE Healthcare). To make staining MHC-Ig, loaded dimeric MHC-Ig was biotinylated by reacting a 20-molar excess of EZ-Link™ Sulfo-NHS-Biotin (ThermoFisher) for 30 minutes at room temperature and then washing the protein using membrane ultrafiltration.
Artificial Antigen Presenting Cell Production.
Artificial antigen-presenting cells were produced as previously described [7]. Briefly, magnetic particles functionalized with NHS surface groups of various sizes were purchased from OceanNanotech (Springdale, AR, USA). Loaded antigen-specific dimeric MHC-Ig KbSIY and equimolar anti-CD28, clone 37.51 (purchased from BioXCell (West Lebanon, NH)) were conjugated to the surface of the particles per manufacturer’s recommendations.
For higher density aAPCs, magnetic particles with amine surface groups of various sizes were purchased from Micromod (Rostock, Germany). Particles were functionalized with Sulfo-SMCC (Proteochem, Hurricane, UT) and antigen-specific dimeric MHC-Ig KbSIY and equimolar anti-CD28 were thiolated with Traut’s reagent (2-iminothiolane) (Sigma Aldrich) and then mixed with the functionalized particles per manufacturer’s recommendations. Signal-1 only particles were produced accordingly; however, no anti-CD28 was included in the reaction with the magnetic particles. Similarly fluorescent particle aAPCs were produced by a similar process except that the MHC-Ig KbSIY attached was labeled with FITC. 4500 nm Dynal Particles were purchased from ThermoFisher (Halethorpe, MD) and dimeric MHC-Ig KbSIY and equimolar anti-CD28 were conjugated to the epoxy-coated surface as established previously [12].
To achieve closely equivalent densities of dimeric MHC-Ig and anti-CD28 on the surface of different sized particles, the ratio of protein added to the total particle surface area was kept constant. For example, 0.5 mg of 50 nm particles have the same total surface area as 4.6 mg of the 300 nm particles. Thus, 0.5 mg of total protein was added to react with each of these particle batches respectively. For co-conjugation of Signals 1 and 2, 0.5 mg of Signals 1 or 2 represents a supersaturating amount for both proteins, i.e. it is 10-fold higher than the theoretical maximum amount of protein needed for conjugating to the particle surface. The amount of protein to add was determined by increasing the total protein added to the conjugation reaction, and choosing the value where the final protein density on the particle plateaued.
Particle Characterization.
The amount of protein conjugated successfully to the surface of the particles was quantified through fluorescent staining. The amount of MHC-Ig was quantified by staining with FITC-conjugated rat anti-mouse Ig λ1, λ2, λ3 light chain, clone R26-46, and the amount of anti-CD28 was quantified by staining with FITC-conjugated mouse anti-Armenian/Syrian hamster IgG, clone G192-1 (BD Pharmingen, Franklin Lakes, New Jersey). Particles were stained with 1 μL of the antibody for 1 hour at 4 °C, then washed three times, and fluorescence was read on Synergy HTX Multi-mode florescent plate reader (BioTek, Winooski, VT, USA). Protein was quantified by comparison to fluorescent standard curve of staining antibodies, and particle number was quantified by absorbance using a spectrophotometer at a 405 nm reference.
Doped Enrichment.
2C or C57BL/6J CD8+ T cells were obtained by using a mouse CD8+ T cell negative isolation kit from Miltenyi Biotec (Cologne, Germany) and following manufacturer’s instructions. 2C transgenic mice have CD8+ T cells with the same T cell receptor that recognizes the mouse MHC Kb loaded with the SIY peptide. These 2C CD8+ T cells were labeled with CellTrace™ CFSE Cell Dye per manufacturer’s recommendations (ThermoFisher). Briefly, CD8+ T cells were suspended in 1 mL of PBS and 1 μL of CFSE to make a final concentration of 5 μM. This was incubated at 37 °C for 20 minutes and then incubated for 5 more minutes with 5 mL of complete RPMI-1640 medium (ThermoFisher) supplemented with 10% fetal bovine serum (Atlanta Biologicals, Flowery Branch, GA). Labeled cells were then washed twice more in RPMI-1640 medium supplemented with 10% fetal bovine serum.
These CFSE-labeled 2C CD8+ T cells were then counted with a hemocytometer and added at a 1:1000 ratio to C57BL/6J CD8+ T cells and mixed thoroughly in a PBS buffer with 2 mM EDTA and 0.5% Bovine Serum Albumin (Gemini, Sacramento, CA). Particle aAPCs were then added to this mixture at the indicated amounts per 1×10⁶ total CD8+ T cells and allowed to bind at 4 °C for 1 hour. Binding was done at 4 °C to minimize cell uptake of the aAPCs. This particle cell-mixture was then washed magnetically. For smaller 50 nm particle aAPCs, the cell-particle mixture was washed three times with PBS using a Miltenyi MS column which amplifies the magnetic field needed for smaller particles. The larger particles larger than 50 nm were washed using a STEM-cell magnetic column (Vancouver, Canada) with PBS three times. All particle cell mixtures were eluted in 500 μL of PBS and counted via a hemocytometer. This eluted product was then stained with the APC-conjugated rat anti-mouse CD8a, clone 53-6.7, antibody (BD Pharmingen) for 15 minutes at 4 °C, washed, and read on a BD FACSCalibur.
Fold enrichment was determined by dividing the percent of 2C positive cells in the eluted particle-cell mixture by the percent of 2C positive the native 1:1000 doped mixture. Percent cell recovery was calculated by dividing the number of 2C positive cells in the eluted particle-cell mixture by the number of 2C positive the native 1:1000 doped mixture. The 2C cell counts were calculated by multiplying the number of cells in each mixture by the measured percentages from flow cytometry.
Particle Binding.
Particle aAPCs were allowed to bind with 2C CD8+ T cells at 4 °C for 1 hour at various ratios of particle aAPCs to T cells. This mixture was washed and then stained with a 1:350 ratio of PE labeled rat-anti-mouse IgG for 15 minutes at 4 °C. PE labeled polyclonal goat-anti-mouse IgG1 (ThermoFisher) recognizes the mouse IgG of the dimeric Kb-Ig on the particles to discriminate and quantitate particles on the surface. Excess antibody was washed away from the particle-cell mixture and then the cells were read on a BD FACSCalibur to determine the percent of cells bound with respect to the non-particle-bound 2C CD8+ T cells of background staining.
Particle Off-rate.
Fluorescent aAPCs were allowed to bind with 2C CD8+ T cells in FACS wash buffer at 4 °C for 1 hour at a saturating dose particle aAPCs to T cells as determined by particle binding experiments. Samples were washed with FACS wash buffer and a 0 time point was read on a BD FACSCalibur. Then a super-saturating amount (greater than 50 molar excess) of 1B2 anticlonotypic mAb was added to the T cell-particle mixture. The 1B2 antibody recognizes the 2C TCR and competes for binding with particle KbSIY. Samples of the mixture were taken periodically and read via flow cytometry to quantify the number of particles still attached.
Particle Endocytosis.
Fluorescent aAPCs were allowed to bind with 2C CD8+ T cells at 4 °C for 1 hour at a saturating dose of particle aAPCs to T cells as determined by particle binding experiments. A third of cell-aAPC mixture was taken and stained with a 1:350 ratio of APC-labeled polyclonal goat-anti-mouse IgG1 for 15 minutes. Stained cells were then washed and stained with a 1:100 ratio of PerCP-conjugated rat anti-mouse CD8a, clone 53–6.7, antibody (BD Pharmingen) for 15 minutes at 4 °C, washed, and read on a BD FACSCalibur. The other two-thirds of the cell-aAPC mixture was added to a 96 U-bottomed plate in complete RPMI media supplemented with 10% FBS. The cell-aAPC mixture was then incubated for either 3 or 18 hours at 37 °C in a cell incubator. At the indicated time points, another third of the cell-aAPC mixture was harvested and stained as indicated above and read on a BD FACSCalibur.
Confocal Microscopy of aAPCs and 2C CD8+ T Cells.
The same experimental set-up was utilized for confocal microscopy as described in the particle endocytosis experiments. However, following incubation cells were stained with a 1:100 ratio of APC-conjugated rat anti-mouse CD8a, clone 53-6.7, antibody (BD Pharmingen) for 15 minutes at 4 °C. Then cells were fixed with a solution of 4% paraformaldehyde in PBS for 20 minutes at room temperature. Cells were then washed and stained with DAPI (ThermoFisher) according to manufacturer’s instructions for 10 minutes at room temperature. Cells were washed and then imaged on a Zeiss LSM780-FCS confocal microscope.
Development of Particle Binding Model.
We attempted to model aAPC-T cell binding with a multivalent kinetic model, as described by Stone and group [13]. In their paper, they developed a kinetic model for a multivalent pMHC complex dissociating from T cells. We expanded this model for nanoparticles with given numbers of TCR-pMHC contacts, n:
We follow their assumption that the off-rates of TCR-pMHCs (koff) and multivalent on-rates (μ) are independent of the binding of neighboring MHC with TCR, allowing use of stoichiometric coefficients alone to account for avidity effects. These assumptions lead to the following differential equations:
Utilizing this model we derived the equation that was used within this manuscript to model T cell-aAPC binding, based on the following assumptions:
The concentration of nanoparticles bound to TCRs equals:
| (1) |
Also, particle unbinding occurs when singly bound particles fall off:
| (2) |
Finally, to determine what [LT] equals, we assume mass equilibrium of bound forms, based on the exponential decay behavior of our particles and μ being at least ten times larger than koff to get:
| (3) |
Substituting equation (3) into equation (1):
| (4) |
Solving for [LB(t)] in equation (2) and substituting in equation (4) for [LB] in terms of [LT]:
| (5) |
Enrichment and Expansion of Endogenous Antigen-specific T cells.
CD8+ T cells from C57BL/6J mice were obtained with a mouse CD8+ T cell negative isolation kit from Miltenyi Biotec (Cologne, Germany) following manufacturer’s instructions. aAPCs were then added to the CD8+ T cells to incubate at 4 °C for 1 hour with mixing. The ratio of aAPCs to T cells was controlled based on the total T cell signaling molecules conjugated to the surface of the particles—230 fmol of signaling molecules (or 115 fmol of peptide-loaded MHC) per every 1×10⁶ CD8+ T cells. This ratio was determined from early experiments by comparing different sized aAPCs in doped enrichment studies (Fig. 6A), and from our previous experience using 50 nm aAPCs for enrichment and expansion of rare endogenous antigen-specific T cells [6].
Figure 6:

Particle aAPC size and ligand density influence the isolation and expansion antigen-specific CD8+ T cells from wildtype B6 mice. (A) Data replotted from Figures 2E and 3D to demonstrate three levels of fold enrichment over similar percentage antigen-specific recovery at an amount of particles controlled for 115 fmol of pMHC-conjugated to the surface per 106 CD8+ T cells (no statistical difference, error bars show s.e.m, n = 3, one-way ANOVA). (B) After 7 days of culture, cells were stained with a viability dye, anti-CD8+, and pMHC KbSIY (cognate) or pMHC KbSINF (non-cognate) to determine total percent and number of antigen-specific CD8+ T cells. (C) Number of SIY-specific T cells after enrichment and 7 days of culture differed (error bars show s.e.m.; *p < 0.05, n = 3–6, one-way ANOVA with Tukey’s post test). (D) Percent SIY-specific T cells after enrichment and 7 days of culture differed (error bars show s.e.m.; ***p < 0.001, **p < 0.01, n = 3–6, one-way ANOVA with Tukey’s post test). (EߝF) After 7 days of culture, cells were stained with a viability dye, anti-CD8+, and pMHC KbTRP2 (cognate) or pMHC KbSIY (non-cognate) to determine total (E) number and (F) of antigen-specific CD8+ T cells (error bars show s.e.m.; *p < 0.05, **p < 0.01, n = 4, Student’s t test).
After incubation with the particles, the mixture was magnetically washed three times. For smaller 50 nm particle aAPCs, the cell-particle mixture was washed using a Miltenyi MS column, while the 300 nm aAPCs mixtures were washed using a STEM-cell magnetic column. The first wash was with a PBS buffer with 2 mM EDTA and 0.5% Bovine Serum Albumin. The second wash was with complete RPMI-1640 medium supplemented with 10% fetal bovine serum. The third was with complete RPMI-1640 medium supplemented with 10% fetal bovine serum and T cell growth factor, a cytokine cocktail derived from condition media produced from stimulated human PBMC as previously described [14]. The resulting washed cells were eluted in 0.5 mL of RPMI-1640 medium supplemented with 10% fetal bovine serum and T cell growth factor. The cells were then counted on a hemocytometer, resuspended at a concentration of 250,000 cells/mL, and plated in 96 u-bottomed plates. On day 3, cells were refed using media (50% of the initial plating volume) with a doubled concentration of T cell growth factor.
On day 7 cells were harvested and stained with Trypan Blue, and viable cells were counted via hemocytometry. Samples were divided and stained for antigen-specific CD8+ T cells. The first portion of cells was stained with 1 μg of biotinylated-cognate KbSIY and a 1:100 ratio of APC-conjugated rat anti-mouse CD8a, clone 53-6.7 (BD Pharmingen) in FACS wash buffer for 1 hour at 4 °C. The second subset of the sample was stained with 1 μg of biotinylated-noncognate KbTRP2 and a 1:100 ratio of APC-conjugated rat anti-mouse CD8a, clone 53-6.7 (BD Pharmingen) in FACS wash buffer for 1 hour at 4 °C. All samples were then washed with PBS and then stained with a 1:350 ratio of PE-labeled streptavidin (BD Pharmingen) and a 1:1000 ratio of LIVE/DEAD™ Fixable Green Dead Cell Stain (ThermoFisher) in PBS for 15 minutes at 4 °C. Cells were then washed and read on a BD FACSCalibur. Percent antigen-specific cells were calculated by subtracting the percent gated in cognate stained CD8+ T cells from non-cognate stained CD8+ T cells. Number of antigen-specific cells was determined from multiplying the percent of antigen-specific cells by the number counted following cell harvest. For the experiment comparing high density (HD) 50 nm and 300 nm expansion of endogenous CD8+ T cells without enrichment, the same protocol was followed just excluding the magnetic washing at day 0.
Functional Analysis of Antigen-specific CD8+ T Cells.
On Day 7 of culture, approximately 100,000 CD8+ T cells were isolated and stained with either 1 μg of biotinylated-cognate KbSIY or 1 μg of biotinylated-non-cognate KbTRP2 in sterile PBS for 1 hour at 4 °C. All samples were then washed with PBS and stained with a 1:350 ratio of PE-labeled streptavidin (BD Pharmingen) in PBS for 15 minutes at 4 °C. Cells were subsequently washed in complete RPMI-1640 medium supplemented with 10% fetal bovine serum and resuspended in 100 μL of media. To inhibit protein transport and probe for degranulation, 10 μL solution of 1:50 FITC anti-CD107a, 1:350 BD GolgiStop Protein Transport Inhibitor (BD Biosciences), and 1:350 BD GolgiPlug Protein Transport Inhibitor (BD Biosciences) in PBS was added to the samples. Cells were incubated at 37 °C for 6 hours. After incubation, cells were washed and stained with 1:100 PBS solution of PerCP-conjugated anti-mouse CD8a, clone 53-6.7 (Biolegend) and 1:1000 of LIVE/DEAD® AmCyan Fixable Aqua Dead Cell Stain (ThermoFisher) at 4 °C for 30 minutes. Cells were subsequently fixed and permeabilized with 100 μL BD Cytofix/Cytoperm Fixation and Permeabilization Solution (BD Biosciences) overnight. Cells were washed with 1x BD PERM/Wash buffer with 2% BSA the following day and stained with 1:100 solution of APC-conjugated rat anti-mouse IFN-γ, clone XMG1.2 (BD Pharmingen) in PERM/Wash buffer with 2% BSA at 4 °C for 1 hour. Stained cells were read on BD LSR II flow cytometer.
3. RESULTS
3.1. aAPC size impacts antigen-specific T cell enrichment efficiency
To study how engineering nanoparticle aAPC properties affect the ability to enrich antigen-specific T cells, we doped in fluorescently-labeled antigen-specific CD8+ T cells at a 1:1000 ratio to CD8+ T cells from a B6 mouse. The antigen-specific cells were isolated from a 2C transgenic mouse that recognizes the SIY peptide loaded into the MHC Kb (Fig. 1B). Using a magnetic field, we enriched antigen-specific cells with our different sized magnetic aAPCs. We detected the percent antigen-specific T cells by flow cytometry and calculated the fold enrichment (Fig. 1C).
We evaluated the effect of nanoparticle size on the ability to enrich by developing particle aAPCs of 50-, 300-, 600-nm, and 4.5-μm diameters with similar ligand densities of pMHC and anti-CD28 monoclonal antibody (44, 300, 124, and 392 molecules of Signal 1 and 2 per μm2 of particle respectively—data originally published in [7]) (Supplemental Fig. 1). Smaller aAPC sizes were chosen with distinct size distributions and at the nanometer resolution to enable capability with in vivo administration of aAPCs and enriched antigen-specific T cells as a therapy, whereas larger 4.5 μm aAPCs were included for comparison, as they are the standard anti-CD3/anti-CD28 aAPC used to activate polyclonal T cells in ACT [12]. We controlled the amount of SIY-loaded MHC and anti-CD28 on the particle surface across various particle sizes. This theoretically normalizes the number of binding events each TCR should encounter. Particles 300 nm and larger, were effective in enriching antigen-specific cells about 20-fold, whereas 50 nm aAPCs were significantly less effective, only providing a 1.5-fold enrichment (Fig. 1D).
We hypothesized that aAPCs larger than 300 nm have multivalent interactions with the TCRs and lead to greater binding with the T cell thereby enhancing enrichment. To test this hypothesis, we incubated our different sized aAPCs with cognate 2C CD8+ T cells at varying doses to examine their equilibrium binding. Interestingly, we observed a size-dependent trend with the aAPCs ability to bind to the T cells (Fig. 1E, Supplemental Fig. 2). As aAPC size increases, fewer aAPCs are needed to effectively bind to the CD8+ T cell indicating a higher avidity of the aAPC for the cognate T cell. For example, to achieve greater than 40 percent of the T cells bound to particles, the ratio of particles to T cells for 4.5 μm, 600 nm, 300 nm, and 50 nm are around 1, 10, 10, and 105 respectively. The increase in avidity further substantiates our hypothesis that aAPCs engage clusters of TCR and co-stimulatory molecules.
3.2. Decreasing aAPC concentration improves T cell enrichment but decreases cell recovery
Based on the more efficient binding of larger aAPCs, we hypothesized that decreasing the total number of aAPCs could reduce enrichment of non-cognate CD8+ T cells. We postulated that by eliminating excess particle aAPCs would decrease the number of lower affinity nonspecific interactions. By decreasing the concentration of the 300 nm aAPCs about 20-fold, we were able to increase enrichment from 20-fold to 60-fold (Fig. 2A). However, when evaluating enrichment, we recovered much fewer cells in general. We thus counted the number of cells that went into each enrichment and also the number after enrichment to determine the percent cell recovery of our doped antigen-specific cells. While we achieved much greater levels of antigen-specific enrichment, the percent recovery of these cells decreased substantially to nearly 5% (Fig. 2B).
Figure 2:

Particle aAPC concentration affects fold enrichment and percent antigen-specific cell recovery. (A) Increased enrichment when decreasing concentration of 300 nm particle aAPCs (n=3). (B) Decreased cell recovery when decreasing concentration of particle aAPCs as measured by hemocytometry and flow cytometry (error bars show s.e.m.; n = 3). (C) At high concentrations of aAPC particles increase cell recovery but also have increased non-specific interactions potentially due to the reason they have both antigen-specific signals and non-specific co-stimulatory signals. (D) High cell recovery and high cell enrichment are needed for adoptive immunotherapy applications and high cell enrichment is wanted for diagnostic applications. (E) Size dependent differences in fold enrichment and antigen-specific cell recovery at a concentration of 115 fmol aAPC-bound pMHC (error bars show s.e.m.; n = 3).
From these results we observed competing optima, where reducing aAPCs leads to greater enrichment, but decreases binding and recovery of total antigen-specific cells (Fig. 2C). Selecting conditions for enrichment depends on the application for antigen-specific T cell enrichment. For cell therapy applications, high cell recoveries are desired as the effectiveness of cell-based therapies increases with increasing number of effector cells [15]. In contrast, fold enrichment is more important for detection purposes, but still requires a threshold of total cell recovery to achieve accurate readouts. When plotting our enrichment results on a graph that indicates both antigen-specific cell recovery and enrichment (Fig. 2D), it is apparent that there is a trade-off between non-specific T cell binding and low antigen-specific T cell recovery rates, pointing to the fact that the concentration of aAPCs in the enriching solution is an important parameter to optimize (Supplemental Fig. 3).
Based on these results, we quantified the percent of antigen-specific cells recovered in enrichment experiments with different-sized aAPCs. Although there were minimal differences in fold-enrichment of particles larger than 300 nm (Fig. 1C), we can observe drastic effects of the size of the particle on enrichment and cell recovery (Fig. 2E). It appears that there is also a balance between size in both achieving high enrichment and high percent cell recovery, with an optimal size of 300 nm aAPCs achieving both the highest fold enrichment and highest percent cell recovery.
This phenomenon could be due to a balance between collective magnetic strength of the particles attached to a T cell and individual magnetic strength of a particle. The first requirement to successfully enrich a cell is an adequate magnetic force. Thus, there is a need to maximize the aggregate magnetic strength of the particles to successfully magnetically isolate the tagged cell. However, there is also a requirement to minimize individual particle magnetic strength to prevent particle disassociation from the cell [16,17].
The magnetic strength of an individual particle is related to total iron oxide and thus related to volume or diameter cubed. However, the collective magnetic strength of particles bound to a given T cell, assuming spherical square-packing, is proportionally related to the diameter (Supplemental Fig. 4AߝB). A square-packing estimate is more conservative biologically, where there is less packing per surface area than hexagonal-packing; however, the proportion is equivalent, with just a constant difference. Thus, mathematically we also see the competing optima between decreasing the diameter to the third power and increasing it proportionally to achieve both high percent recovery and high fold enrichment. This could explain why we observe an optimal 300-nm size, which achieves both the greatest antigen-specific CD8+ T cell enrichment and cell recovery (Fig. 2E).
3.3. Increasing ligand density increases aAPC avidity and improves antigen-specific CD8+ T cell isolation for small 50 nm-sized aAPCs
Besides particle size, another important design parameter of aAPCs is the density of the stimulatory ligand on the surface of the particle (Fig. 3A). This has been shown to influence the ability to activate T cells presumably due to both clustering of nearby TCRs and co-stimulatory signals and also increased signal duration due to a more avid interaction [7,18–20]. We similarly hypothesized that increasing the particle avidity would increase enrichment of antigen-specific CD8+ T cells.
Figure 3:

Particle ligand density influences target cell enrichment. (A) Ligand density of aAPC affects local density and thus avidity with T cell. (B) Binding avidity increases for 50 nm particles with increased density of ligand. (C) Increasing ligand density improves fold enrichment of 50 nm aAPCs at a concentration of 115 fmol aAPC-bound pMHC (error bars show s.e.m.; *p < 0.05, n = 3, Student’s T test). (DߝF) Increasing the surface ligand density increases the fold enrichment of 50 nm aAPCs (D), but leads to greater non-specific enrichment by (E) 300 nm and (F) 600 nm aAPCs (error bars show s.e.m.; n = 3).
To study this, we developed aAPCs with nearly a 100-fold increase in ligand density termed high-density (HD) 50 nm. These HD 50 nm aAPCs bound to cognate CD8+ T cells much more effectively than their lower density counterparts (Fig. 3B). For example, to achieve above 40% of T cells bound to particles, 105 of 50 nm particles per cell were required, while only 102 of HD 50 nm particles per cell were needed. We hypothesized that this several log difference in binding would lead to greater enrichment. Indeed, the HD 50 nm aAPCs enriched more effectively than the 50 nm aAPCs (Fig. 3C). However, the 10-fold enrichment was still lower than the 300 nm aAPCs, and even by changing the concentration of these HD 50 nm aAPCs we were unable to increase the enrichment or percent of antigen-specific recovery (Fig. 3D). This inability to further increase enrichment could be due to either the low magnetic strength of the smaller particles, or an increase in non-specific interactions leading to lower enrichments.
To further explore the effects of ligand density, we made higher density versions of the 300 and 600 nm aAPCs (Supplemental Fig. 5A). These higher density versions also exhibited enhanced binding compared to normal density aAPCs (Supplemental Fig. 5B). However, when compared at the same concentration (controlled by total particle-bound protein), the HD 300 and 600 nm aAPCs provided little to no enrichment (Supplemental Fig. 5C). We hypothesized that the increase in ligand density also led to an increase in non-specific binding, and that by decreasing the concentration we could achieve higher values of enrichment. While decreasing the concentration helped improve the enrichment, it also decreased valued of cell recovery below 50% (Fig. 3E, F). This demonstrates the importance of ligand density and also in the context of particle size to both achieve effective enrichment and cell recovery. This is another illustration of competing optima, where increasing ligand density may lead to increased binding with cognate T cells, which will increase cell recovery. However, increasing ligand density may also lead to increased non-specific interactions such as binding with CD28 on non-cognate T cells, thus decreasing enrichment.
3.4. Eliminating signal 2 significantly improves antigen-specific CD8+ T cell enrichment
Based on all of our previous results where we saw significant non-specific binding and lower enrichment values with particles presenting both pMHC and anti-CD28, we hypothesized that if we eliminated non-specific anti-CD28 from our particles, we would increase specificity as CD28 is expressed by all T cells (Fig 4A). Decoupling the co-stimulatory molecule from T cell stimulation has been shown to lead to anergy and even inhibitory phenotypes [21–23]. However, recently we have shown that the co-stimulatory molecule can be separated from the aAPC on the nanoscale and added after enrichment if these two particles are co-clustered in a magnetic field [11]. Encouraged by these recent results we developed particles with only pMHC (Signal 1 or S1 only aAPCs) attached at high ligand densities for sizes of 50, 300, and 600 nm.
Figure 4:

Eliminating non-specific co-stimulatory ligand from particle aAPCs to improve enrichment. (A) Signal-1 only aAPCs only have antigen-specific MHC which should eliminate many non-specific interactions. (B) Binding avidity is dependent on size of the aAPC and decreases for each size when anti-CD28 antibody is eliminated. (CߝE) Eliminating non-specific co-stimulatory decreases fold enrichment for (C) 50 nm aAPCs but increases fold enrichment for (D) 300 nm and (E) 600 nm aAPCs (error bars show s.e.m.; n = 3).
The S1 only particles exhibited the same particle size-dependent increase in binding to cognate CD8+ T cells as with the canonical aAPCs (Fig. 4B). However, eliminating anti-CD28 from the particle decreased the particle binding compared to their canonical HD S1/S2 aAPC counterparts (Supplemental Fig. 6AߝC). This is not surprising as the antibody anti-CD28/CD28 interaction is a higher affinity interaction (nanomolar KD) than the pMHC-TCR interaction (micromolar KD) [24].
We next probed the ability for the 50, 300, and 600 nm S1 only particles to enrich antigen-specific cells. S1 50 nm aAPCs did not provide effective enrichment, where even at their highest concentration of particles there was only 2-fold enrichment (Fig. 4C). However, eliminating signal 2 from 300 nm aAPCs significantly improved specificity, where up to 90-fold enrichment was achieved with 40% recovery (Fig. 4D). This was also true for S1 600 nm aAPCs but exhibited lower cell recovery percentages (Fig. 4E). In general, cell recovery percentages were lower for S1 only particles at the same aAPC concentration than observed for the HD particles with anti-CD28 (Fig. 3DߝF). This agrees with our observation that HD S1 particles bind less effectively at the same dose than the HD S1 and S2 particles (Supplemental Fig. 6AߝC). Thus, we would expect increasing cell-recovery percentages with increased doses of S1-only particles.
Achieving 90-fold enrichment is significantly better than enrichments we had previously achieved, where at most we were able to enrich up to 10-fold [6,11]. This increase in cell enrichment efficacy could be utilized to identify rare antigen-specific T cells earlier and more accurately.
3.5. Multiavidity interactions of larger aAPCs with T cells are seen by both experimental and modeling analysis
Since even S1-only aAPCs showed a size-dependent enrichment, we hypothesized that smaller aAPCs have fewer chances for multi-receptor binding leading to faster off-rates for our S1 50 nm particles. We also hypothesized that larger particles would dissociate more slowly than smaller ones because they have more contact area with the T cell and thus more available ligands, schematically illustrated in Figure 5A. This should be even more pronounced for S1 50 nm particles as the spacing of TCRs is estimated around 30 nm [9,10].
Figure 5:

Nanoparticle size affects avidity and effective off-rate from T cell surface. (A) Schematic of how size of particles affects number of ligands available to interact with T cell receptors. (B) HD S1-only 50 nm particles dissociate more rapidly than S1-only 300 nm particles, as determined by an off-rate experiment. (C) Larger particles have increased numbers of available ligands and longer half-lives (error bars show s.e.m., * p<0.05, Student’s t test).
To quantitatively assess this hypothesis, we conducted off-rate experiments by incubating 2C CD8+ T cells with saturating amounts of fluorescently labelled 50 and 300 nm Signal 1 KbSIY particles and then competing them off with 1B2, an anticlonotypic antibody for the 2C CD8+ TCR. We then fit the off-rate data for the S1 50 nm and S1 300 nm particles with an exponential decay function (Fig. 5B, R2 = 0.98 and 0.89, respectively) and found that the effective off rate of 50 nm particles was significantly faster than 300 nm particles (p=0.001, unpaired t test).
To associate these off-rates with multi-ligand binding, we estimated available ligands from the aAPCs to the CD8+ T cell based on particle size and total conjugated protein as quantified through fluorescent staining (Supplemental Fig. 7A, B). S1 300 nm particles had a total of 100 ± 29 dimer proteins, while S1 50 nm particles had 8.3 ±1.5 dimer proteins per particle. The number of available ligands was estimated by assuming as we have done previously7 that the ratio of available to total ligands is equal to the ratio of the area of a spherical cap of height h to the total surface area of a particle with diameter D, as described in Equation [1] and that the distance of interaction between particles and the T cell is within 5 nm.
| (6) |
Based on this conservative, static ratio we determined that S1 50 nm and S1 300 nm particles had 0.8±0.1 and 1.7±0.3 available ligands, respectively, leading us to attribute this difference in effective off-rate and half-life to the 300 nm particle having more available ligands despite a slightly lower density (Fig. 5C).
To explore the design space of aAPC-T cell binding, we decided to mathematically model the effect of multi-ligand binding on particle off-rate. This will clarify how effective off-rate would change as the number of available ligands increases for other particle configurations and ligand densities. To do so we extended a kinetic model developed for oligomers with three available binding sites to particles with any given number of available binding sites [13], The model, as shown in Equation [2] below relates the effective off rate to the number of binding sites (n), the monomeric off rate (koff) and the multivalent on-rate (μ) by assuming mass equilibrium between all states of binding and that koff and μ are independent of binding of neighboring MHC with TCR.
| (7) |
While the first assumption is difficult to validate, the latter assumption about rapid interconvertibility and mass-equilibrium is corroborated by the exponential decay behavior of our particles from the cell surfaces and that μ is at least 10 times larger than koff. By fitting our values for according to equation [2], we were able to estimate the parameters koff and μ and determine the behavior of as the number of available ligands increases (Supplemental Fig. 8). We found that decreases very rapidly, as was expected based on the significantly different off-rates of our S1 50 and S1 300 nm particles. Thus, both experimental and modeling approaches demonstrated that both the ligand density and the size of the nanoparticles are crucial to determining the local number of ligands affecting the avidity of the T cell and aAPC interaction. These results could help explain why there is so much more non-specific binding with our high density 300 and 600 nm particles that include anti-CD28 on the surface, which has a much higher affinity for non-specific CD28.
3.6. The effects of aAPC size and ligand density on endogenous antigen-specific enrichment and expansion
Beyond antigen-specific T cell identification, enriching antigen-specific CD8+ T cells can be applied in ACT applications. Magnetic enrichment can benefit ACT by eliminating non-specific and regulatory cells in culture, which will also limit off-target immune responses in vivo. Therefore, the goal is to achieve the highest percentage and number of antigen-specific cells. For this purpose, aAPCs with both Signals 1 and 2 can be used to enrich and expand antigen-specific cells taken from patients to large numbers, decreasing the time, cost, and technical difficulty to achieve this therapy [6].
Synthesizing what we have learned about particle properties in model systems, we aimed to study further how these studies translate to isolating endogenous rare antigen-specific T cells. To test how particle size and ligand density affected cell enrichment and activation, we chose aAPCs with different fold enrichments, yet similar percent cell recoveries. Therefore, we selected 50 nm aAPCs with low enrichment, HD 50 nm aAPCs with intermediate enrichment, and 300 nm aAPCs with high enrichment capabilities—all with around 50-60% cell recovery (Fig. 6A).
For these studies we enriched antigen-specific CD8+ T cells from the endogenous population representative of how one would approach clinical ACT. First, we expect our cell recoveries post-enrichment for high enriching aAPCs to be lower when starting with the same total number of CD8+ T cells pre-enrichment. Indeed, the overall number of recovered CD8+ T cells was consistent with previous enrichment experiments. The least amount of recovered cells was from the 300 nm aAPCs and the most from the 50 nm aAPCs (Supplemental Fig. 9).
We then cultured these enriched fractions for seven days to allow for stimulation and expansion. The process of enriching antigen-specific T cells should increase nutrient supply, stimulus to cell ratio, and room to expand ex vivo. Therefore, we expected that increasing enrichment would also lead to an increase in total antigen-specific cell number on day 7.
On day 7, we stained the cells with anti-CD8 and pMHC KbSIY (cognate) and control KbSINF (noncognate) complexes (Fig. 6B). The 300 nm aAPCs had significantly more antigen-specific cells than 50 nm aAPCs as expected, and more than the HD 50 nm while not statistically significant (Fig. 6C). We also investigated whether antigen-specific CD8+ T cells generated from the enrichment and expansion process were functional by investigating cytokine and degranulation markers associated with enhanced killing [25–28]. We first investigated CD107a expression where this is a degranulation marker of lytic ability. Both 300 and HD 50 nm produced high percentages functional antigen-specific CD8+ T cells, where this resulted in 70% and 88% positive for CD107a (Supplemental Fig. 10A). Furthermore, upwards of 20% of antigen-specific CD8+ T cells were also positive for effector cytokine IFNγ—a marker of the functionality of killer cells (Supplemental Fig. 10B). Both readouts indicate robust expansion of functional antigen-specific CD8+ T cells. Frequencies of antigen-specific cells vary from 1-in-104 to 1-in-106; therefore, assuming the frequency to be between 0.0001–0.01%, the number of original antigen-specific cells was between 3 and 300. With the resultant number totaling close to 1.5×10⁵, this represents between a 450–45,000-fold expansion.
To decouple how variables affect either enrichment or activation of rare-antigen specific cells we eliminated enrichment but still stimulated endogenous CD8+ T cells with HD 50 and 300 nm aAPCs. We see significant decreases in total cells generated by both the HD 50 nm and 300 nm aAPCs, indicating again the important role of enrichment (Supplemental Fig. 11AߝB). HD 50 nm aAPCs demonstrated a greater reduction in antigen-specific cells, nearly 8-fold compared to only 5-fold reduction for the 300 nm aAPCs. This agrees with previous studies that demonstrated particles smaller than 300 nm are less effective at stimulating T cells, unless artificially clustered in a magnetic field.7 Indeed, clustering HD 50 nm aAPCs in a magnetic field without enrichment increased the number of antigen-specific CD8+ T cells to be similar to activating with 300 nm aAPCs without any magnetic field (Supplemental Fig. 11CߝD). Thus, during the enrichment process, the magnetic field may artificially cluster HD 50 nm aAPCs, allowing efficient activation closer to the 300 nm aAPCs.
We also investigated if differences in particle endocytosis correlate with greater proliferation seen with 300 nm aAPCs. We studied this at saturating doses of aAPCs with cognate 2C CD8+ T cells across nanoparticle aAPC sizes. After 1 hour of cell incubation at 4 °C, particles were not internalized, but bound to the surface (Supplemental Fig. 12, Supplemental Video 1), which agreed with temperature-dependent receptor mediated endocytosis and our own previous studies [7,11,29–31]. After 3 and 18 hours of incubation at 37 °C, most particles dissociated from the cells (Supplemental Fig. 13A). More specifically, the percent of cognate CD8+ T cells bound to aAPCs decreased to below 20% for all conditions (Supplemental Fig. 13B). Of these aAPC-bound T cells, almost no uptake was observed with HD 50 nm aAPCs (Supplemental Fig. 13CߝE, Supplemental Videos 2, 3). Greater uptake was observed in the 300 and 600 nm aAPCs, where the increased avidity of larger particles potentially enabled activation induced TCR-mediated endocytosis of particles [32,33], albeit in only 5–10% of total antigen-specific cells (Supplemental Fig. 13CߝE). Therefore, endocytosis likely contributes to further signaling in a subset of antigen-specific cells [34] and needs to be studied further for 300 nm aAPCs, but early cell-binding events appear to influence a greater proportion of antigen-specific cells.
Finally, the degree of purity of antigen-specific CD8+ T cells is consistent with previous enrichment experiments with 300 nm aAPCs providing the highest percentage of antigen-specific T cells (~65%) and the 50 nm aAPCs with the lowest (~15%) (Fig. 6D). An increase in antigen-specific purity to nearly 65% is a major advancement for two major reasons. First, antigen-specific purity enables tumor-specific CD8+ T cells to propagate and fill the immunological space in a lymphodepleted patient, rather than non-specific CD8+ T cells. Second, the antigen-specific purity of a therapeutic product will limit off-target effects such as autoimmunity, where ex vivo stimulation could activate self-reactive T cells.
Even more dramatic increases in percentage (3-fold) and number (5-fold) of antigen-specific T cells were observed when targeting a shared tumor antigen TRP2 when 300 nm aAPCs were used and compared to HD 50 nm aAPCs (Fig. 6EߝF). Testing these sizes at another antigenic boundary condition validates our size and ligand-dependent findings that 300 nm aAPCs enrich and expand antigen-specific CD8+ T cells more effectively than smaller 50 nm aAPCs even with increased ligand density.
4. DISCUSSION
This acellular particle platform is an attractive approach because of its ability to be modular yet standardized across different patients. First, we do not need to produce and maintain variable and costly feeder cells for T cell expansions needed [35,36]. Second, this can be an off-the-shelf reagent that can be customized with any peptide sequence needed for patient specific responses. Third, the ability to use a magnetic field greatly enriches for antigen-specific cells and decreases nutrient competition and potential regulatory cells in culture. Fourth, with co-stimulation we can activate these cells to divide to create thousands of copies of themselves within short periods of time. Fifth, enrichment can increase the purity of antigen-specific T cells in the final cell transfer product limiting the off-target side effects.
Beyond these benefits, the results described herein provide a path towards development of a higher throughput version of antigen identification and in vivo activation studies. Previously the enrichment and expansion process was developed with the 50 nm particle and required Miltenyi columns to enhance the magnetic field for enrichment [6]. However, with 300 nm particles, this enables the use of plate-based magnets, thus eliminating costly columns and enabling multiple enrichments to occur at the same time if done on 96-well plate magnets. The 300 nm particles are also still small enough to be injected in vivo as a therapy post enrichment or enrichment and expansion [37]. Since there is no commercially available aAPC, these benefits may enable transfer to other labs and adoption of these aAPCs both as a tool to isolate and study antigen-specific CD8+ T cells and as a therapy. Finally, we have previously observed enhanced stimulation from particles larger than 300 nm in vitro [7], which could lead to enhanced in vivo activation of antigen-specific cells—potentially eliminating the ex vivo activation step after enrichment.
Cell modulation with particle platforms is becoming a more widely used tool to both study biological properties of cells and manipulate cell fate for cell therapy [37,38]. These studies continue to reveal the importance of heterogeneity in cell types and should drive particle design. Here we investigated how important particle parameters such as size, concentration, surface ligand density, and surface ligand choice affected enrichment of cells in a model system with CD8+ T cells for immunotherapeutic applications.
To achieve optimal magnetic enrichment of antigen-specific cells, particle parameters need to be balanced based on T cell biology. For particle size, the relationship between the potential number of close-packed particles, individual and collective magnetic strength of particles, and local T cell ligand clustering need to be considered with an experimentally observed maximum for 300 nm sized particles. We further demonstrated that increasing ligand density can improve magnetic cellular enrichment, but this avidity also increases any non-specific existing interactions. These unwanted interactions can be limited by decreasing particle concentration or eliminating non-specific ligand on the surface of the particle. Finally, in combining enrichment with stimulation, we were able to achieve nearly 65% antigen-specific purity from an endogenous population of less than 0.01%, and nearly 5 times the number of antigen-specific cells from a shared tumor antigen.
For immunotherapeutic applications, many current forms of antigen-specific T cell identification are either costly or do not allow subsequent culture or manipulation of the cells [39]. On the other hand enriching antigen-specific T cells with superparamagnetic aAPCs could be more affordable, multiplexed, and allow subsequent culture—creating a new diagnostic tool and improving expansions of antigen-specific CD8+ T cells potentially to be used in antigen-specific therapies.
5. CONCLUSION
In conclusion, we have investigated unexplored biomaterial parameters of nanoparticle size, ligand density, particle concentration, and ligand choice in the enrichment of rare antigen-specific CD8+ T cells. Previous enrichment with aAPCs have been limited to 50 nm with a single ligand density. Quantitative control of parameters revealed that 300 nm aAPCs were most effective at both enriching and activating antigen-specific CD8+ T cells, shedding light on how particle design can be influenced and inspired from T cell biology. This resulted in generating nearly 3-fold increase in the percentage and 5-fold in the number of antigen-specific CD8+ T cells for a shared tumor antigen. Ultimately, advancing the utility as a tool for identifying, characterizing, and utilizing antigen-specific immune responses, and offers a general case study in biomaterial nanoparticle property design to isolate rare cells.
Supplementary Material
6. ACKNOWLEDGEMENTS
JWH thanks the NIH Cancer Nanotechnology Training Center at the Johns Hopkins Institute for NanoBioTechnology, the National Science Foundation Graduate Research Fellowship (DGE-1232825), and the ARCS foundation for fellowship support. AYI is also supported by the National Science Foundation Graduate Research Fellowship. This work was funded by support from the National Institutes of Health (P01-AI072677, R01-CA108835, R21-CA185819), TEDCO/Maryland Innovation Initiative and the Coulter Foundation (JPS). The authors also thank Barbara Smith from the Johns Hopkins School of Medicine Microscope Facility for assistance in the confocal imaging with T cells and aAPCs.
Footnotes
The authors declare the following competing financial interest(s): Under a licensing agreement between NexImmune and The Johns Hopkins University, Jonathan Schneck is entitled to a share of royalty received by the university on sales of products described in this article. He was also a founder of NexImmune and owns equity in the company and he serves as a member of NexImmune’s Board of Directors and scientific advisory board. The terms of these arrangements have been reviewed and approved by The Johns Hopkins University in accordance with its conflict of interest policies.
DATA AVAILABILITY
All the data needed to reproduce the work performed and evaluate the conclusions made are presented in the paper and/or the Supplemental Materials. The raw data required to reproduce these findings cannot be shared at this time due to technical or time limitations.
Publisher's Disclaimer: This is a PDF file of an unedited manuscript that has been accepted for publication. As a service to our customers we are providing this early version of the manuscript. The manuscript will undergo copyediting, typesetting, and review of the resulting proof before it is published in its final citable form. Please note that during the production process errors may be discovered which could affect the content, and all legal disclaimers that apply to the journal pertain.
9. REFERENCES
- [1].Tran E, Robbins PF, Lu Y-C, Prickett TD, Gartner JJ, Jia L, Pasetto A, Zheng Z, Ray S, Groh EM, T-cell transfer therapy targeting mutant KRAS in cancer, N. Engl. J. Med. 375 (2016) 2255–2262. [DOI] [PMC free article] [PubMed] [Google Scholar]
- [2].Rosenberg SA, Restifo NP, Yang JC, Morgan RA, Dudley ME, Adoptive cell transfer: a clinical path to effective cancer immunotherapy, Nat. Rev. Cancer. 8 (2008) 299. [DOI] [PMC free article] [PubMed] [Google Scholar]
- [3].Berger C, Jensen MC, Lansdorp PM, Gough M, Elliott C, Riddell SR, Adoptive transfer of effector CD8+ T cells derived from central memory cells establishes persistent T cell memory in primates, J. Clin. Invest. 118 (2008) 294–305. [DOI] [PMC free article] [PubMed] [Google Scholar]
- [4].Jenkins MK, Moon JJ, The role of naive T cell precursor frequency and recruitment in dictating immune response magnitude, J. Immunol. 188 (2012) 4135–4140. [DOI] [PMC free article] [PubMed] [Google Scholar]
- [5].Rizzuto GA, Merghoub T, Hirschhorn-Cymerman D, Liu C, Lesokhin AM, Sahawneh D, Zhong H, Panageas KS, Perales M-A, Altan-Bonnet G, Self-antigenߝspecific CD8+ T cell precursor frequency determines the quality of the antitumor immune response, J. Exp. Med. 206 (2009) 849–866. [DOI] [PMC free article] [PubMed] [Google Scholar]
- [6].Perica K, Bieler JG, Schutz C, Varela JC, Douglass J, Skora A, Chiu YL, Oelke M, Kinzler K, Zhou S, Enrichment and expansion with nanoscale artificial antigen presenting cells for adoptive immunotherapy, ACS Nano. 9 (2015) 6861–6871. [DOI] [PMC free article] [PubMed] [Google Scholar]
- [7].Hickey JW, Vicente FP, Howard GP, Mao H-Q, Schneck JP, Biologically Inspired Design of Nanoparticle Artificial Antigen-Presenting Cells for Immunomodulation, Nano Lett. 17 (2017). doi:10.1021/acs.nanolett.7b03734. [DOI] [PMC free article] [PubMed] [Google Scholar]
- [8].Cai H, Muller J, Depoil D, Mayya V, Sheetz MP, Dustin ML, Wind SJ, Full control of ligand positioning reveals spatial thresholds for T cell receptor triggering, Nat. Nanotechnol. (2018). [DOI] [PMC free article] [PubMed] [Google Scholar]
- [9].Molnár E, Swamy M, Holzer M, Beck-García K, Worch R, Thiele C, Guigas G, Boye K, Luescher IF, Schwille P, Cholesterol and sphingomyelin drive ligand-independent T-cell antigen receptor nanoclustering, J. Biol. Chem. 287 (2012) 42664–42674. [DOI] [PMC free article] [PubMed] [Google Scholar]
- [10].Lillemeier BF, Mörtelmaier MA, Forstner MB, Huppa JB, Groves JT, Davis MM, TCR and Lat are expressed on separate protein islands on T cell membranes and concatenate during activation., Nat. Immunol. 11 (2010) 90–96. doi:10.1038/ni0610-543b. [DOI] [PMC free article] [PubMed] [Google Scholar]
- [11].Kosmides AK, Necochea K, Hickey JW, Schneck JP, Separating T Cell Targeting Components onto Magnetically Clustered Nanoparticles Boosts Activation, Nano Lett. 18 (2018). doi: 10.1021/acs.nanolett.7b05284. [DOI] [PMC free article] [PubMed] [Google Scholar]
- [12].Oelke M, V Maus M, Didiano D, June CH, Mackensen A, Schneck JP, Ex vivo induction and expansion of antigen-specific cytotoxic T cells by HLA-Ig-coated artificial antigen-presenting cells, Nat. Med. 9 (2003) 619–625. [DOI] [PubMed] [Google Scholar]
- [13].Stone JD, Artyomov MN, Chervin AS, Chakraborty AK, Eisen HN, Kranz DM, Interaction of streptavidin-based peptideߝMHC oligomers (tetramers) with cell-surface TCRs, J. Immunol. 187 (2011) 6281–6290. [DOI] [PMC free article] [PubMed] [Google Scholar]
- [14].Durai M, Krueger C, Ye Z, Cheng L, Mackensen A, Oelke M, Schneck JP, In vivo functional efficacy of tumor-specific T cells expanded using HLA-Ig based artificial antigen presenting cells (aAPC), Cancer Immunol. Immunother. 58 (2009) 209–220. [DOI] [PMC free article] [PubMed] [Google Scholar]
- [15].Restifo NP, Dudley ME, Rosenberg SA, Adoptive immunotherapy for cancer: harnessing the T cell response, Nat. Rev. Immunol. 12 (2012) 269. [DOI] [PMC free article] [PubMed] [Google Scholar]
- [16].McCloskey KE, Chalmers JJ, Zborowski M, Magnetic cell separation: characterization of magnetophoretic mobility, Anal. Chem. 75 (2003) 6868–6874. [DOI] [PubMed] [Google Scholar]
- [17].Plouffe BD, Murthy SK, Lewis LH, Fundamentals and application of magnetic particles in cell isolation and enrichment: a review, Reports Prog. Phys. 78 (2014) 16601. [DOI] [PMC free article] [PubMed] [Google Scholar]
- [18].Matic J, Deeg J, Scheffold A, Goldstein I, Spatz JP, Fine tuning and efficient T cell activation with stimulatory aCD3 nanoarrays, Nano Lett. 13 (2013) 5090–5097. [DOI] [PMC free article] [PubMed] [Google Scholar]
- [19].Deeg J, Axmann M, Matic J, Liapis A, Depoil D, Afrose J, Curado S, Dustin ML, Spatz JP, T cell activation is determined by the number of presented antigens, Nano Lett. 13 (2013) 5619–5626. doi:10.1021/nl403266t. [DOI] [PMC free article] [PubMed] [Google Scholar]
- [20].Hammink R, Mandal S, Eggermont LJ, Nooteboom M, Willems PHGM, Tel J, Rowan AE, Figdor CG, Blank KG, Controlling T-cell activation with synthetic dendritic cells using the multivalency effect, ACS Omega. 2 (2017) 937–945. [DOI] [PMC free article] [PubMed] [Google Scholar]
- [21].Singha S, Shao K, Yang Y, Clemente-Casares X, Solé P, Clemente A, Blanco J, Dai Q, Song F, Liu SW, Yamanouchi J, Umeshappa CS, Nanjundappa RH, Detampel P, Amrein M, Fandos C, Tanguay R, Newbigging S, Serra P, Khadra A, Chan WCW, Santamaria P, Peptide-MHC-based nanomedicines for autoimmunity function as T-cell receptor microclustering devices, Nat. Nanotechnol. 12 (2017) 701–710. doi:10.1038/nnano.2017.56. [DOI] [PubMed] [Google Scholar]
- [22].Cebecauer M, Guillaume P, Hozák P, Mark S, Everett H, Schneider P, Luescher IF, Soluble MHC-peptide complexes induce rapid death of CD8+ CTL, J. Immunol. 174 (2005) 6809–6819. [DOI] [PubMed] [Google Scholar]
- [23].Guillaume P, Legler DF, Boucheron N, Doucey M-A, Cerottini J-C, Luescher IF, Soluble major histocompatibility complex-peptide octamers with impaired CD8 binding selectively induce Fas-dependent apoptosis, J. Biol. Chem. 278 (2003) 4500–4509. [DOI] [PubMed] [Google Scholar]
- [24].Lanzavecchia A, Iezzi G, Viola A, From TCR engagement to T cell activation, Cell. 96 (1999) 1–4. [DOI] [PubMed] [Google Scholar]
- [25].Y.-L.L. Chiu, L. Shan, H. Huang, C. Haupt, C. Bessell, D.H. Canaday, H. Zhang, Y.C. Ho, J.D. Powell, M. Oelke, J.B. Margolick, J.N. Blankson, D.E. Griffin, J.P. Schneck, Sprouty-2 regulates HIV-specific T cell polyfunctionality, J. Clin. Invest. 124 (2014) 198ߝ208. doi:10.1172/JCI70510. [DOI] [PMC free article] [PubMed] [Google Scholar]
- [26].Rodrigue-Gervais IG, Rigsby H, Jouan L, Sauvé D, Sékaly R-P, Willems B, Lamarre D, Dendritic cell inhibition is connected to exhaustion of CD8+ T cell polyfunctionality during chronic hepatitis C virus infection, J. Immunol. (2010) ji_0902522. [DOI] [PubMed] [Google Scholar]
- [27].Ciuffreda D, Comte D, Cavassini M, Giostra E, Bühler L, Perruchoud M, Heim MH, Battegay M, Genné D, Mulhaupt B, Polyfunctional HCV-specific T-cell responses are associated with effective control of HCV replication, Eur. J. Immunol. 38 (2008) 2665–2677. [DOI] [PubMed] [Google Scholar]
- [28].Almeida JR, a Price D, Papagno L, Arkoub ZA, Sauce D, Bornstein E, Asher TE, Samri A, Schnuriger A, Theodorou I, Costagliola D, Rouzioux C, Agut H, Marcelin A-G, Douek D, Autran B, Appay V, Superior control of HIV-1 replication by CD8+ T cells is reflected by their avidity, polyfunctionality, and clonal turnover., J. Exp. Med. 204 (2007) 2473–85. doi:10.1084/jem.20070784. [DOI] [PMC free article] [PubMed] [Google Scholar]
- [29].Chithrani BD, Ghazani AA, Chan WCW, Determining the size and shape dependence of gold nanoparticle uptake into mammalian cells, Nano Lett. 6 (2006) 662–668. [DOI] [PubMed] [Google Scholar]
- [30].Jiang W, Kim BYS, Rutka JT, Chan WCW, Nanoparticle-mediated cellular response is size-dependent, Nat. Nanotechnol. 3 (2008) 145. [DOI] [PubMed] [Google Scholar]
- [31].Perica K, Tu A, Richter A, Bieler JG, Edidin M, Schneck JP, Magnetic field-induced T cell receptor clustering by nanoparticles enhances T cell activation and stimulates antitumor activity., ACS Nano. 8 (2014) 2252–60. doi:10.1021/nn405520d. [DOI] [PMC free article] [PubMed] [Google Scholar]
- [32].Griffiths GM, Tsun A, Stinchcombe JC, The immunological synapse: a focal point for endocytosis and exocytosis, J. Cell Biol. 189 (2010) 399–406. [DOI] [PMC free article] [PubMed] [Google Scholar]
- [33].Martínez-Martín N, Fernández-Arenas E, Cemerski S, Delgado P, Turner M, Heuser J, Irvine DJ, Huang B, Bustelo XR, Shaw A, T cell receptor internalization from the immunological synapse is mediated by TC21 and RhoG GTPase-dependent phagocytosis, Immunity. 35 (2011) 208–222. [DOI] [PMC free article] [PubMed] [Google Scholar]
- [34].Osborne DG, Wetzel SA, Trogocytosis results in sustained intracellular signaling in CD4+ T cells, J. Immunol. (2012) 1201507. [DOI] [PMC free article] [PubMed] [Google Scholar]
- [35].Chapuis AG, Ragnarsson GB, Nguyen HN, Chaney CN, Pufnock JS, Schmitt TM, Duerkopp N, Roberts IM, Pogosov GL, Ho WY, Transferred WT1-reactive CD8+ T cells can mediate antileukemic activity and persist in post-transplant patients, Sci. Transl. Med. 5 (2013) 174ra27ߝ174ra27. [DOI] [PMC free article] [PubMed] [Google Scholar]
- [36].Pollack SM, Jones RL, Farrar EA, Lai IP, Lee SM, Cao J, Pillarisetty VG, Hoch BL, Gullett A, Bleakley M, Tetramer guided, cell sorter assisted production of clinical grade autologous NY-ESO-1 specific CD8+ T cells, J. Immunother. Cancer. 2 (2014) 36. [DOI] [PMC free article] [PubMed] [Google Scholar]
- [37].Hickey JW, Santos JL, Williford J-M, Mao H-Q, Control of polymeric nanoparticle size to improve therapeutic delivery, J. Control. Release. 219 (2015) 536–547. [DOI] [PMC free article] [PubMed] [Google Scholar]
- [38].Fang RH, Zhang L, Nanoparticle-based modulation of the immune system, Annu. Rev. Chem. Biomol. Eng. 7 (2016) 305–326. [DOI] [PubMed] [Google Scholar]
- [39].Newell EW, Davis MM, Beyond model antigens: high-dimensional methods for the analysis of antigen-specific T cells, Nat. Biotechnol. 32 (2014) 149. [DOI] [PMC free article] [PubMed] [Google Scholar]
Associated Data
This section collects any data citations, data availability statements, or supplementary materials included in this article.