

Abstract
Sheep and deer calcanei are finding increased use as models for studies of bone adaptation, including advancing understanding of how the strain (deformation) environment influences the ontogenetic emergence of biomechanically relevant structural and material variations in cortical and trabecular bone. These artiodactyl calcanei seem ideal for these analyses because they function like simply loaded short‐cantilevered beams with net compression and tension strains on the dorsal and plantar cortices, respectively. However, this habitual strain distribution requires more rigorous validation because it has been shown by limited in vivo and ex vivo strain measurements obtained during controlled ambulation (typically walking and trotting). The conception that these calcanei are relatively simply and habitually loaded ‘tension/compression bones’ could be invalid if infrequent, though biologically relevant, loads substantially change the location of the neutral axis (NA) that separates ‘compression’ and ‘tension’ regions. The effect on calcaneus strains of the tension members (plantar ligament and flexor tendon) is also not well understood and measuring strains after transecting them could reveal that they significantly modulate the strain distribution. We tested the hypothesis that the NA location previously described during simulated on‐axis loads of deer calcanei would exhibit limited variations even when load perturbations are unusual (e.g. off‐axis loads) or extreme (e.g. after transection of the tension members). We also examined regional differences in the predominance of the three strain modes (tension, compression, and shear) in these various load conditions in dorsal, plantar, medial, and lateral cortices. In addition to considering principal strains (tension and compression) and maximum shear strains, we also considered material‐axis (M‐A) shear strains. M‐A shear strains are those that are aligned along the long axis of the bone and are considered to have greater biomechanical relevance than maximum shear strains because failure theories of composite materials and bone are often based on stresses or strains in the principal material directions. We used the same load apparatus from our prior study of mule deer calcanei. Results showed that although the NA rotated up to 8° medially and 15° laterally during these off‐axis loads, it did not shift dramatically until after transection of all tension members. When comparing results based on maximum shear strain data vs. M‐A shear strain data, the dominant strain mode changed only in the plantar cortex – as expected (in accordance with our a priori view) it was tension when M‐A shear strains were considered (shear : tension = 0.2) but changed to dominant shear when maximum shear strain data were considered (shear : tension = 1.3). This difference leads to different conclusions and speculations regarding which specific strain modes and magnitudes most strongly influence the emergence of the marked mineralization and histomorphological differences in the dorsal vs. plantar cortices. Consequently, our prior simplification of the deer calcaneus model as a simply loaded ‘tension/compression bone’ (i.e. plantar/dorsal) might be incorrect. In vivo and in finite element analyses are needed to determine whether describing it as a ‘shear‐tension/compression’ bone is more accurate. Addressing this question will help to advance the artiodactyl calcaneus as an experimental model for bone adaptation studies.
Keywords: bone adaptation, collagen fiber orientation, deer calcaneus, osteonal remodeling, sheep calcaneus, strain mode
Introduction
Artiodactyl (sheep and deer) calcanei have been used as models for studying cortical (compact) and trabecular (cancellous) bone adaptation (Lanyon, 1974; Skedros et al. 1994a, 2001, 2004, 2007, 2012; Skerry & Lanyon, 1995; Kim et al. 2008; Sinclair et al. 2013; Keenan et al. 2017). One great value of this model for the translation of mechanotransduction studies to the human skeleton and other larger mammals is that it has abundant secondary osteons (Haversian systems), is relatively simply loaded, and has highly heterogeneous histomorphological organization between cortical regions that strongly correlate with specific strain characteristics of load history (Skedros et al. 2011; Keenan et al. 2017). This contrasts with mice and rats as models for bone adaptation studies because they: (1) lack forming secondary osteons under natural conditions, (2) usually exhibit bone modeling (non‐osteonal) responses to applied mechanical stimuli during growth and maturity, and (3) because of their small size their bones are relatively ‘overdesigned’ for the loads they normally encounter (Turner, 2001; Baumann et al. 2015; Ross & Sumner, 2017; Yang et al. 2017). In these contexts, the deer calcaneus is an important and innovative model for understanding bone adaptation.
During physiologic weight‐bearing activities, the calcaneal shaft is believed to function like a simply loaded short‐cantilevered beam with a highly consistent distribution of net compression and tension strains on the dorsal and plantar cortices, respectively (Fig. 1). However, the view that this strain distribution is habitual (i.e. spatially and temporally stereotypical) has been shown by limited in vivo and ex vivo strain gauge measurements that were obtained only during actual or simulated controlled ambulation such as walking and trotting (Lanyon, 1973, 1974; Su et al. 1999). Therefore, it is unclear whether this strain distribution is consistent during the many possible gait‐related activities (e.g. jumping, darting, vigorous running, and sharp turning) that can significantly perturb the strain distribution and thereby affect the modeling and remodeling processes that mediate bone adaptation (Skerry & Lanyon, 1995; Currey, 2002; Main & Biewener, 2004; Moreno et al. 2008; Yang et al. 2011). Hence, the conception of sheep and deer calcanei as relatively simply and habitually loaded ‘tension/compression bones’ (Skedros, 2012) is not rigorously established.
Figure 1.

Lateral‐to‐medial view of a left ankle of a skeletally mature mule deer showing locations for defining shaft ‘length’. The large arrow shows the direction of force by the common calcaneal tendon in mid‐stance, loading the dorsal cortex in net compression (‘C’) and plantar cortex presumably resulting in net tension (‘T’) during the majority of stance phase. The arched trabecular patterns that are deeper inside the bone are shown in a stylized/simplified fashion and are thought to reflect compression and tension stress trajectories (Skedros & Baucom, 2007).
Sheep and deer calcanei have been shown to have unusual regional heterogeneity in characteristics of their structural and material organization that correlate with the presumably habitual dorsal/plantar compression/tension strain distribution. For example, biomechanically and statistically significant differences have been shown between their dorsal ‘compression region’ and plantar ‘tension region’ in terms of cortical thickness, mineral content (percent ash), microstructure (e.g. secondary osteon morphotypes and population densities, and osteon size and shape), and ultrastructure, e.g. predominant collagen fiber orientation (CFO) (Skedros et al. 1994b, 2001, 2009; Keenan et al. 2017). The differences in mineral content between the dorsal and plantar cortices of mule deer calcanei are the largest that have been reported within the same cross‐section of a mature limb bone of any vertebrate species (Skedros et al. 1994a, 1997, 2011, 2012). In the perspective of these dramatic mineral content and histomorphological differences, these calcanei appear to be ideal natural models for studying the proximate stimuli that produce these variations and their ultimate mechanical consequences. Additional studies aimed at gaining a better understanding of the artiodactyl calcaneus model are needed, especially when considering that it is being used to test the mechanistic hypothesis that regional differences in prevalent/predominant strain modes (tension, compression, and shear) found in many bones are important characteristics of the strain environment in terms of causing ontogenetic structural and material adaptations of compact and trabecular bone (Sinclair et al. 2013; Skedros et al. 2013).
Because of their presumed simple loading, sheep and deer calcanei are considered to be in a ‘low‐complexity load category’ (Skedros, 2012; Keenan et al. 2017). ‘Categories’ that are based on the degree of load complexity, as described by Skedros et al. (2009, 2012), represent a novel concept for interpreting bone adaptation, especially in the context of deciphering relationships between load history and regional variations in the histomorphology of limb bones. Load‐complexity categories are currently defined as the magnitude of neutral axis (NA) rotation during stance phase of gait in typical/controlled loading cycles: (1) ‘Low’ (NA rotation < ±10°); (2) ‘Intermediate A’ (NA rotation ±[10°–20°]); (3) ‘Intermediate B’ (NA rotation ±[20° to 40°]); and (4) ‘High’ (NA rotation > ±40°). Load complexity can vary between bones of the same or different species (e.g. equine radius vs. third metacarpal; Skedros et al. 2006a), within the same bone (e.g. proximal vs. mid‐diaphyseal human femur; Skedros 2012), and during ontogeny of the same bone (e.g. immature vs. mature turkey ulnae; Skedros & Hunt 2004).
Sheep and deer calcanei are considered to be in the ‘low‐complexity load category’ because available strain data suggest that their NAs rotate less than ±10° during most load conditions (Skedros, 2012). We hypothesize that the morphology and lever mechanics of sheep and deer tarsal joints constrain motion to the extent that the dorsal (compression)/plantar (tension) strain distribution does not change substantially when loading of the calcaneal shaft is perturbed relative to simpler/sagittal‐plane loading of the calcaneus. The primary goal of the present study was to test this null hypothesis by placing strain gauges on calcanei obtained from mature wild Rocky Mountain mule deer and conducting ex vivo experimental loading. The loads were imparted in two directions that we suggest are a first step toward the simulation of a myriad of load conditions that might be experienced by the calcaneus: 5° off‐axis medially and 5° off‐axis laterally. These unpublished data, which we report in the present study, were obtained in the same set of experiments that were conducted for our prior ex vivo study (Su et al. 1999). In that study, we reported strains on the mule deer calcaneus during on‐axis loads that simulate the mid‐stance phase of gaits ranging from walking to running. Strains were also measured after sequential cutting of the plantar ligament and superficial digital flexor (SDF) tendon, which showed that: (1) these fibro‐elastic structures have important load‐sharing functions that significantly influence strain magnitudes and distributions, (2) there is significant shear in the dorsal and plantar cortices, and (3) net tension actually does not occur on the plantar cortex; the dominant strain mode in this region is shear. Since the publication of Su et al. (1999), we have recognized that our sole adherence to reporting maximum shear strains (i.e. those at 45° with respect to the principal compression and tension strains) may have constrained our ability to consider alternative interpretations of the importance of ‘other’ shear criteria in causing regional adaptations of the calcaneal shaft. Consequently, the second goal of the present study is to report the relative magnitudes of the regional shear strains with respect to the long axis of the calcaneal shaft (i.e. material‐axis shear strains), which are considered to have greater biomechanical relevance than maximum shear strains (Carter, 1978), as discussed further below. This then also allowed us to report the results of the present study in the context of improved methods for calculating the shifts of the NA locations that occur after each of the soft‐tissue transections. The results of the present study are also more specifically considered in terms of the importance of the soft‐tissue structures (i.e. ‘tension members’) in modulating the functionally induced strain environment of this bone. In the context of these goals, we test the hypothesis that during mid‐stance, net (dominant) compression and tension will still be present in the dorsal and plantar cortices, respectively, even in these perturbed load conditions.
Finally, we also examine differing load‐history interpretations based on regional (e.g. dorsal vs. plantar) differences in the magnitudes of the three strain modes in order to evaluate more critically the biomechanical implications of our often‐stated view that the artiodactyl calcaneus is a simple tension/compression (plantar/dorsal cortex) beam‐like bone. We did this to challenge our prior emphasis on tension and compression because this belies the importance that shear strains have in causing bone adaptations; the importance of shear strains is clear from experimental studies showing that compact (cortical) and trabecular bone are generally substantially weaker, less tough, and have comparatively reduced fatigue resistance in shear when compared to compression or tension (Reilly et al. 1997; Boyce et al. 1998; Reilly & Currey, 1999; Diab & Vashishth, 2007; Skedros, 2012). Because of these disparities, shear is considered to have priority over tension and compression in activating specific remodeling activities that enhance bone material properties in order to avoid failure in this potentially most deleterious strain mode – this is known as the ‘shear‐resistance priority hypothesis’ (Skedros, 2012; Skedros et al. 2015). We examine the three strain modes in terms of which one is dominant within each bone region (i.e. dorsal, plantar, medial, and lateral cortices) and in terms of ratios between two regions (e.g. dorsal : plantar). These regional ratios help in seeing whether the simple ‘dorsal compression’ vs. ‘plantar tension’ view of the bone is maintained in terms of the various load conditions and in cases when using maximum vs. material‐axis shear strain data. We hypothesize that the importance of shear strains will be interpreted as being substantially different when the distributions of the tension and compression strain modes are considered in terms of either maximum or material‐axis shear strains.
Methods
Hind limbs were obtained from 10 mature, wild, male Rocky Mountain mule deer (Odocoileus hemionus hemionus) and prepared for loading as described by Su et al. (1999). The animals were ~ 4 years old and were obtained from the sample used in a prior study of ribs and forelimb bones (Skedros et al. 2003). Rectangular stacked rosette strain gauges (WA‐060‐120‐WR, Measurements Group Inc., Raleigh, NC, USA) were attached to the calcanei at various locations (Fig. 2). These limbs were positioned in a loading apparatus (Fig. 3) with load applications that simulate the middle of the support phase in gaits ranging from walking to running. All of the flexor tendons were sewn together with a running zigzag stitch to reinforce them and to attach them as a single unit to an aramide cord (Gemini, Black Diamond Ltd, Salt Lake City, UT, USA) for loading. As described previously, ambulatory strains were simulated by a screw‐driven universal testing machine (model 1125, Instron Inc., Canton, MA, USA) as the cord was pulled through a set of pulleys. Forces in the cord were not recorded. The duration of one load cycle was 10 s, and the load was progressively applied from no load to a peak load (50, 100, 150, and 200 kg). For each of the peak loads, there are six loading trials; results of these trials for the 50 and 200 kg loads are reported below. Data from gauge #5 (dorsal‐medial) were only obtained in trials #1 (baseline) and #4 (plantar ligament separated from the plantar cortex and the plantar gauge attached to the bone surface), as described below. Consequently, strains recorded from gauge #5 could not be used to determine NA locations. All of the trials reported here and those that were also reported in our prior study (Su et al. 1999) were conducted in the same set of experiments. Our prior study contains additional information about the loading methods.
Figure 2.

(A) Lateral‐to‐medial view and (B) medial‐to‐lateral view of a right mature mule deer calcaneus showing the locations of the seven strain gauges. The gauge numbers are also the same as shown in that prior study. The plantar cortex is along the lower margins of the bones in (A) and (B) (ST = sustentaculum talus, which is on the medial side of the bone). Data from gauges 1 and 3 are not used in the present study. (C) Transverse section from the 50% location of a calcaneus, which shows the five gauges used in this study (#7 is the plantar gauge). The NA locations in the off‐axis trials were calculated using these gauges: dorsal‐lateral (#2), lateral (#4), and medial (#6). As shown in Table 1, data from gauge #5 (dorsal‐medial) were only obtained in trials #1 (baseline) and #4 (plantar ligament separated from the plantar cortex and the plantar gauge attached). (Figures reproduced and adapted with permission of J. G. Skedros).
Figure 3.

(A) Lateral‐to‐medial view and (B) posterior‐to‐anterior view of the hind limb of a mature mule deer in the loading apparatus. To achieve the off‐axis loads (C), the apparatus was moved either medial or lateral with respect to the Instron, and the pulleys were also moved either medially or laterally, so that the cord was at a 5° angle to the long axis of the calcaneus; the limb remained in the midstance position. (Reproduced, with modification, with permission of J. G. Skedros.).
All trials, and reasons for reporting data from our prior study
The principal strain data from trial 1 (no plantar strain gauge) and trials 4–6 (which included a plantar strain gauge) are reported in our previous study (Su et al. 1999). However, the NA shifts that occur during all of the non‐baseline trials (i.e. trials 2–6) have not been reported. The reasons that we again report some of our previously reported strain data include: (1) we did not previously report results from all of the trials, (2) we only reported maximum shear magnitudes, and (3) the trials that we did report have a different numerical sequence than those described herein. Hence, some of the data reported by Su et al. are reproduced herein to allow for reconsideration/reinterpretation without forcing readers to cross‐reference our current results with those reported using a different numerical sequence in our prior study.
Trial 1: baseline trial, on‐axis loads (results published previously but with maximum shear data)
In trial 1, the cord was pulled on‐axis, which yielded what we call ‘baseline strains’.
Trials 2 and 3: off‐axis loads (results not published previously)
In trials 2 and 3, the cord was pulled off‐axis 5° medially (trial 2) and 5° laterally (trial 3) with respect to the longitudinal axis of the bone (Fig. 3C). Trials 2 and 3 were conducted as a means of simulating and estimating changes in strain distributions and magnitudes that might resemble the net consequence of less typical loads that occur during some natural conditions. These load deviations were based on results of an ex vivo study of talocrural joint mechanics in sheep by Alexander & Bennett (1987). They showed that when high loads (i.e. 4800 N, which is nearly 10 times bodyweight) are applied to the talocrural joint in a physiologically flexed configuration, the calcaneus rotates 5° from its unloaded position. The higher magnitudes of the incrementally increased loads that they imparted to the talocrural joint approximated strenuous activities such as running and jumping (i.e. 5–10 times bodyweight) (Alexander, 1980). Alexander & Bennett (1987) concluded that forces applied during in vivo locomotion were unlikely to cause deviations greater than 5°.
The previously unreported data from off‐axis trials 2 and 3, which we report here, were derived during the same set of experiments described by Su et al. (1999). Trials 2 and 3 were the only trials where the tendons were pulled off‐axis. The 5° offset (medially or laterally) of these load directions was aligned approximately along either the medial or lateral surfaces of the gastrocnemius muscle (Fig. 3B). Data were collected during trials 2 and 3 at three strain gauge sites: dorsal‐lateral, lateral, and medial.
Trial 4: plantar ligament separated (results published previously but with maximum shear data)
The same specimens used in trials 1–3 in the present study were also used in trial 4. In trial 4, a scalpel was used to separate the plantar ligament from the plantar cortex from 20 to 80% of shaft length. Although separated from its cortex, the plantar ligament remained in continuity to maintain its longitudinal load‐carrying capacity. The plantar ligament has a firmly adherent attachment along the entire plantar aspect of the calcaneal shaft and it was necessary to separate this ligament from the bone in order to attach a strain gauge to the plantar cortex at 50% shaft length. Applied loads were the same as in trial 1.
Trial 5: plantar ligament separated and transected (results published previously but with maximum shear data)
Trial 5 used eight of the 10 specimens used in trials 1–4. In these specimens the plantar ligament was completely transected; hence, it could no longer carry loads along the plantar aspect of the calcaneus. The SDF tendon remained intact. Applied loads were the same as trial 1.
Trial 6: plantar ligament separated and transected and SDF tendon transected (results published previously but with maximum shear data)
Using the same eight specimens of trial 5, the SDF tendon was completely severed in addition to the previous separation and transection of the plantar ligament. Applied loads were the same as trial 1.
Trials 4–6 were conducted to examine the changes in strain distributions and magnitudes that would occur with sequential cutting of the tension members.
Two methods for calculating shear strain data
The shear strain data reported in the present study are determined using two methods. The first is the conventional method used to obtain maximum shear strains, which are calculated as the difference between the maximum and minimum principal strains – as was done in our previous study (Su et al. 1999) and by Lanyon (1974). However, it has been argued that this method, when used in isolation, does not give a clear understanding of the shear strain distribution and its biological relevance (Carter, 1978; Young & Budynas, 2002). More specifically, Carter (1978) recommends that:
Strains and stresses estimated from rosettes bonded to bone [should be] reported in the principal material directions, since (1) it is easier to integrate this information with current knowledge of gait and functional anatomy, and (2) failure theories of composite materials and bone are based on stresses or strains in the principal material directions (Pope & Outwater, 1974; Reilly & Burstein, 1975; Hayes & Wright, 1977).
This view has been sustained by subsequent studies (Norman et al. 1996; Phelps et al. 2000; Turner et al. 2001; An et al. 2011; Koester et al. 2011; Martinéz‐Reina et al. 2014) and is consistent with data showing that osteons and other matrix characteristics (e.g. mineral crystallites and/or, in many cases, collagen fibers) have preferred orientations that are generally along the long axis of limb bones, including artiodactyl calcanei (Cohen & Harris, 1958; Lanyon & Bourn, 1979; Petrtýl et al. 1996; Skedros et al. 2006b; Martinéz‐Reina et al. 2014; Keenan et al. 2017). Hence the second method that we used to calculate regional shear strains (γ) expresses them in terms of their magnitudes along what is considered the principal material axis (long axis) of the bone (Fig. 4). To accomplish this, we used the following equation obtained from Carter (1978) as employed in studies of in vivo strain modes and magnitudes on limb bones by Biewener and colleagues (Biewener & Dial, 1995; Blob & Biewener, 1999):
where E1 and E2 are the maximum (tensile) and minimum (compressive) principal strains, respectively, and Ø is the angle of E1 to the bone's longitudinal axis. Consequently, the shear strains are with respect to what Carter (1978) refers to as material‐axis shear strains. The original principal strain data reported in Su et al. (Su, 1998; Su et al. 1999) were input into the above equation to determine these material‐axis shear strain values. In contrast to his 1974 study, Lanyon (1973) also obtained shear data in his 1973 study using methods that are similar to the ‘second method’ used in the present study.
Figure 4.

Reference axes on the anterior aspect of an idealized diaphyseal bone segment. From the strain rosette data at point 0, one can determine the principal strains and the angle between the principal strain axes and the principal material axes (Dally & Riley, 1991) (redrawn from Carter 1978).
Determining the neutral axis (NA)
Because there were no additional strain gauges or correlated finite element analyses, simplifying assumptions were necessary before the changes in the locations of the NA could be determined. This included the assumption that the changes in strain distribution with on‐axis and off‐axis loading would occur linearly across the cross‐section. This assumes that the material properties of the bone, though anisotropic, are uniform across the section, and asymmetrical cross‐sectional shape and cortical thickness of the section do not substantially affect this linearity. Published strain data and computational studies generally support these simplifying assumptions for the purposes of estimating the locations of the NAs in this study (Biewener, 1992; Gross et al. 1992; Donahue et al. 2000). Additionally, no adjustment was made to account for the trabecular bone that filled the medullary cavity. Ruff (1983) has suggested that the contribution of trabecular bone to the structural properties of a diaphyseal region becomes important when this type of bone occupies more than 40% of the total cross‐sectional area. This applies well to the deer calcaneus at mid‐shaft because the relative percentage of the medullary cavity (which is filled with trabecular bone) is typically between 30 and 35% (Sinclair et al. 2013).
The steps taken to determine the baseline NA (trial 1) and the shifts of the NAs that occurred during trials 2–6 were done in accordance with the method described by Biewener (1992). To accomplish this, the cross‐sectional shape of the bone cortex was digitized and the bone shape and the position of the strain gauges were defined with respect to a Cartesian coordinate system. The measured normal strains (i.e. normal to the plane of the bone cross‐section, which means that they are along the longitudinal axis of the bone) were obtained from three gauge locations (medial, lateral, and dorsal‐lateral). A system of three linear equations consisting of three unknowns (a, b, and c) was then solved using Cramer's rule to establish the equation describing the planar distribution of normal strains across the bone cortex (normal strains are zero at the NA).
The normal strains ε2, ε4, ε6 recorded at peak stance at sites 2 (dorsal‐lateral gauge), 4 (lateral gauge), and 6 (medial gauge) have the coordinates (x 2, y 2), (x 4, y 4), and (x 6, y 6), respectively. Using these data, the following equations can then be written as:
| (1) |
| (2) |
| (3) |
The equation of the line defining the NA (ε = 0) can then be written as:
| (4) |
Equation (4) was then solved by inputting the coefficients (a, b, and c) obtained from Eqns (1), (2), (3). Least‐squares regressions based on 35 sets of x,y coordinates were used to determine the NA lines on a digitized cross‐section of the bone. The NA lines for all of the trials were drawn on the cross‐section, and the angles formed by trials 2–6 with respect to the NA in trial 1 (baseline) were then determined. Use of this method and the estimated NA locations that we then were able to calculate have not been reported previously.
One‐way analysis of variance (anova) was used to determine statistical differences (P ≤ 0.05) between principal strain ratios at gauge locations between trial 1 (baseline; trial 4 is baseline with respect to the plantar gauge) and each subsequent trial.
Statistical power was based on means and standard deviations from our pilot data from five bones that were loaded in the sagittal plane (on‐axis as in trial 1) and off‐axis (as in trials 2–3) with 200‐kg load, which produced the largest NA deviations of the experimental loads. The set of ‘on‐axis’ loading trials showed 0° ± 3° NA rotations. The off‐axis data showed absolute angles of NA rotations of 12.5° ± 4° from lateral off‐axis loading and 8° ± 3° from medial off‐axis loading (see Fig. 5 for examples of the directions of these rotations). Statistical power was calculated in two steps for a sample size of 10 bones, α < 0.05, and with respect to the load‐complexity categories described above. The first step was in the context of the null hypothesis that the absolute value of NA rotation caused by lateral and medial off‐axis loads would be small in each case; namely, below the 10° threshold between the low‐complexity load category and all higher‐complexity load categories. The power for this NA rotation comparison from 0° ± 3° to 10° ± 5° was > 99% for the lateral and medial directions of rotation, respectively. In the second step of the analysis, statistical power was calculated in the context of the alternative hypothesis that the smaller NA rotations indicative of the two lower‐complexity load categories could be confidently distinguished from larger NA rotations of the two higher‐complexity load categories. This was accomplished by using the means and standard deviations of the lateral and medial off‐axis loads and comparing each to the 20° threshold in each direction of the off‐axis loads. These comparisons include: 13° ± 4° to 20° ± 5° in the clockwise direction (from lateral off‐axis loading), and 8° ± 3° to 20° ± 5° in the counterclockwise direction (from medial off‐axis loading). The power in these two load cases was 94 and > 99%, respectively.
Figure 5.
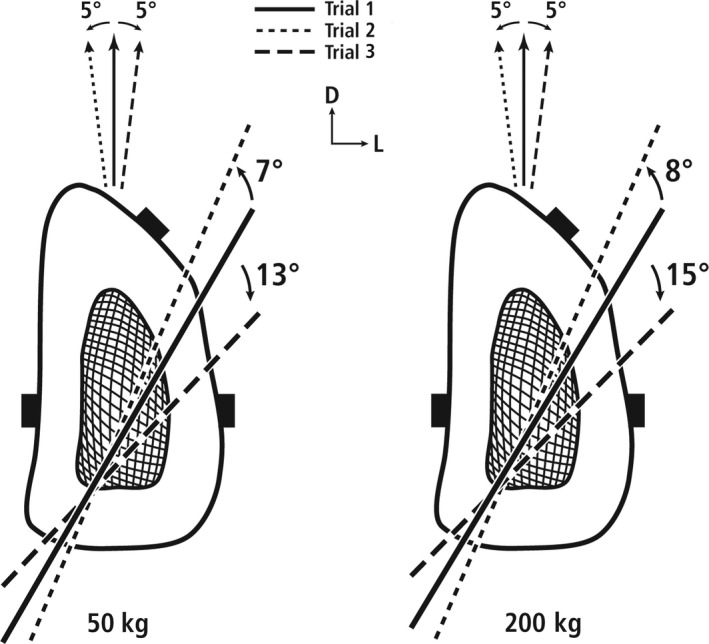
Transverse cross‐section from the 50% location of a deer calcaneus during 50‐kg (at left) and 200‐kg loads (at right) showing the locations of the NA during these trials: (1) Baseline (on‐axis) loading = Trial 1, (2) 5° off‐axis medially (counterclockwise rotation = Trial 2), and (3) 5° off‐axis laterally (clockwise rotation = Trial 3). D = dorsal, L = lateral.
Results
The new data reported here and some of our previously reported data are summarized in Tables 1, 2, 3 and Figs 5, 6, 7. As noted above, the sequence of some of the trials has changed from those used in our prior study (Su et al. 1999). Data reported previously are highlighted in gray in Table 1. To avoid confusion, the summarized data in Fig. 7 only consider the material‐axis shear strains (maximum vs. material‐axis shear strains are considered below).
Table 1.
Strain parameters at 50% length and 50 kg applied load to the calcaneus.a
| Gauge site | Trial | n | Principal tensile strain (μ‐strain) | Principal compressive strain (μ‐strain) | Maximum (max) shear strain (μ‐strain) | Material‐axis (M‐A) shear strain (μ‐strain) | Principal angle (°)b | Principal strain ratioc (C/T) | Dominant strain mode (with max shear) | Dominant strain mode (with M‐A shear) | |||
|---|---|---|---|---|---|---|---|---|---|---|---|---|---|
| Dorsal‐Lateral (#2) | 1 | 9 | 170.9 | 52.4 | −348.4 | 177.0 | 519.3 | 93.7 | −84.8 | 5.2 | 2.04 | C | C |
| 2 | 4 | 235.1 | 106.9 | −318.0 | 104.9 | 553.2 | 296.4 | −73.8 | 20.0 | 1.35 | C | C | |
| 3 | 4 | 217.2 | 24.9 | −513.1 | 119.8 | 730.3 | 256.9 | −100.3 | 4.8 | 2.36 | C | C | |
| 4 | 9 | 155.1 | 60.9 | −292.9 | 153.6 | 448.0 | 71.6 | −85.4 | 5.6 | 1.89 | C | C | |
| 5 | 8 | 185.4 | 57.8 | −357.4 | 161.7 | 542.8 | 32.2 | −88.3 | 6.2 | 1.93 | C | C | |
| 6 | 7 | 218.5 | 96.7 | −374.1 | 149.7 | 592.5 | 80.4 | −86.1 | 8.5 | 1.71 | C | C | |
| Dorsal‐Medial (#5) | 1 | 6 | 183.8 | 67.9 | −323.7 | 158.0 | 507.5 | 166.9 | −80.4 | 7.2 | 1.76 | C | C |
| 2 | na | na | na | na | na | na | na | na | na | ||||
| 3 | na | na | na | na | na | na | na | na | na | ||||
| 4 | 5 | 181.0 | 41.6 | −309.8 | 136.7 | 490.7 | 146.8 | −81.3 | 8.3 | 1.71 | C | C | |
| 5 | na | na | na | na | na | na | na | na | na | ||||
| 6 | na | na | na | na | na | na | na | na | na | ||||
| Medial (#6) | 1 | 10 | 192.0 | 60.2 | −389.3 | 155.9 | 581.3 | 432.0 | −66.0 | 6.4 | 2.03 | S | S |
| 2 | 5 | 189.2 | 75.9 | −507.4 | 138.2 | 696.5 | 269.9 | −78.6 | 13.3 | 2.68 | C | C | |
| 3 | 5 | 342.0 | 106.6 | −385.6 | 79.8 | 727.7 | 698.7 | −53.1 | 8.0 | 1.13 | S | S | |
| 4 | 9 | 199.3 | 47.5 | −372.5 | 159.1 | 571.8 | 440.6 | −64.8 | 7.2 | 1.87 | S | S | |
| 5 | 8 | 197.2 | 49.2 | −277.3 | 143.9 | 474.5 | 405.8 | −60.6 | 7.9 | 1.41 | S | S | |
| 6 | 7 | 245.0 | 96.8 | −111.0 | 91.3 | 356.0 | 327.2 | −33.4 | 19.1 | 0.45 | S | S | |
| Lateral (#4) | 1 | 10 | 348.1 | 132.1 | −135.6 | 29.2 | 483.7 | 397.2 | −27.6 | 26.3 | 0.39 | S | S |
| 2 | 5 | 545.0 | 316.0 | −195.3 | 91.5 | 740.3 | 594.6 | −26.7 | 13.4 | 0.36 | S | S | |
| 3 | 5 | 144.6 | 108.5 | −87.1 | 59.4 | 231.7 | 230.8 | −47.5 | 10.8 | 0.60 | S | S | |
| 4 | 10 | 330.7 | 128.1 | −159.3 | 52.3 | 489.9 | 407.2 | −28.1 | 25.5 | 0.48 | S | S | |
| 5 | 8 | 373.6 | 130.6 | −165.2 | 87.9 | 538.8 | 529.6 | −39.7 | 15.6 | 0.44 | S | S | |
| 6 | 8 | 511.1 | 178.7 | −311.1 | 75.4 | 822.2 | 726.0 | −31.0 | 25.8 | 0.61 | S | S | |
| Plantar (#7) | 1 | na | na | na | na | na | na | na | na | na | |||
| 2 | na | na | na | na | na | na | na | na | na | ||||
| 3 | na | na | na | na | na | na | na | na | na | ||||
| 4 | 7 | 590.6 | 93.4 | −195.2 | 65.8 | 785.8 | 125.6 | 4.6 | 5.6 | 0.33 | S
|
T | |
| 5 | 7 | 803.0 | 192.6 | −317.3 | 131.3 | 1120.3 | 7.8 | 0.2 | 4.0 | 0.40 | S
|
T | |
| 6 | 5 | 1218.2 | 288.3 | −459.1 | 118.1 | 1677.3 | 122.8 | −2.1 | 3.8 | −0.38 | S
|
T | |
These data are representative of the various loads used. The strain data for trials 1, 4, 5, and 6 that have been reported previously by Su et al. (1999) are highlighted in gray. These data are shown here again for efficient comparisons and for their re‐interpretation of our prior results vs. those of the present study, where we calculate the material‐axis shear strains and use improved methods to calculate the neutral axis (NA) locations.
Double‐headed arrows indicate where the dominant strain mode changes: this occurs only when maximum shear strain data are considered.
Italicized numbers, standard deviations; na, not applicable; C, compression; T, tension; S, shear; μ, micro; Max, maximum; M‐A, material axis.
The principal angle determined with respect to the principal tensile strain: see Su et al. (1999).
Principal strain ratio = absolute value of (principal compressive stain/principal tensile strain).
Table 2.
Normal strain data (means) for trials 1–6 with: (a) 50‐kg applied load and (b) 200‐kg load
| Dorsal‐lateral (ε2) | Lateral (ε4) | Medial (ε6) | |
|---|---|---|---|
| (a) 50 kg | |||
| Trial 1 | −330.6 | 225.0 | −309.0 |
| Trial 2 | −302.1 | 353.2 | −403.1 |
| Trial 3 | −487.4 | 93.3 | −306.9 |
| Trial 4 | −278.4 | 214.5 | −296.5 |
| Trial 5 | −339.2 | 242.4 | −220.2 |
| Trial 6 | −355.3 | 331.1 | 194.8 |
| (b) 200 kg | |||
| Trial 1 | −1030.2 | 747.0 | −961.0 |
| Trial 2 | −878.9 | 1152.6 | −1189.0 |
| Trial 3 | −1527.9 | 320.6 | −950.5 |
| Trial 4 | −789.6 | 668.2 | −922.9 |
| Trial 5 | −1003.0 | 757.1 | −580.0 |
| Trial 6 | −902.4 | 905.0 | 688.8 |
Data were collected from the dorsal‐lateral, lateral, and medial gauges. Data shown are in microstrain.
Table 3.
Ratios of principal tension and compression strains, and both shear‐strain criteria (material‐axis and maximum) during trial 4 (baseline with respect to plantar ‘tension region’ gauge). (a) Comparisons with respect to the distribution of each of the three strain modes at the plantar ‘tension region’ gauge vs. the two ‘compression region’ gauges (dorsal‐lateral and dorsal‐medial). (b) Comparisons at each of the five gauge locations in terms of these ratios: (1) compression : tension, (2) shear : tension, and (3) shear : compression
| (a) Dorsal and plantar gauges only | One strain mode (two locations) | |||
|---|---|---|---|---|
| Two gauge comparisons | Tension : Tension | Compression : Compression | M‐A Shear : M‐A Shear | Max Shear : Max Shear |
| Plantar : Dorsal‐Lateral |
3.81 P>D |
0.67 D>P |
1.75 P>D |
1.75 P>D |
| Plantar : Dorsal‐Medial |
3.26 P>D |
0.63 D>P |
0.85a
D>P |
 1.60aP>D 1.60aP>D |
| Dorsal‐Lateral : Plantar |
0.26 P>D |
1.50 D>P |
0.57 P>D |
0.57 P>D |
| Dorsal‐Medial : Plantar |
0.31 P>D |
1.59 D>P |
1.17a
D>P |
 0.62a 0.62a
D>P |
| (b) All five gauges | Two strain modes (one location) | ||||
|---|---|---|---|---|---|
| Individual gauge locations | Compression : Tension | M‐A Shear : Tension | Max Shear : Tension | M‐A Shear : Compression | Max Shear : Compression |
| Dorsal‐lateral | 1.9 | 0.5a |
 2.9a 2.9a
|
0.2a |
 1.5a 1.5a
|
| Dorsal‐medial | 1.7 | 0.8a |
 2.7a 2.7a
|
0.5a |
 1.6a 1.6a
|
| Plantar | 0.3 | 0.2a |
 1.3a 1.3a
|
0.6a |
 4.1a
,
b 4.1a
,
b
|
| Medial | 1.9 | 2.2 | 2.9 | 1.2 | 1.5 |
| Lateral | 0.5 | 1.2 | 2.9 | 2.6 | 3.1 |
Cells highlighted in gray indicate the two gauge (dorsal vs. plantar) comparisons where the specific strain mode indicated was found to predominate in the dorsal ‘compression’ cortex.
M‐A, material axis; Max, maximum; P, plantar (‘tension region’) gauge; D = dorsal (‘compression region’) gauges.
Double‐headed arrows indicate cases where the ratio ‘inverts’ (becomes > 1.0 or < 1.0) in the paired comparison. This only involves ratios where the two different shear‐strain criteria are being considered.
As shown also in Table 1, this is the only case where maximum shear strains are high enough to call into question the view that the deer calcaneus is a simple ‘tension/compression’ (plantar cortex/dorsal cortex) bone. ‘Shear‐tension/compression’ might be more appropriate.
Figure 6.
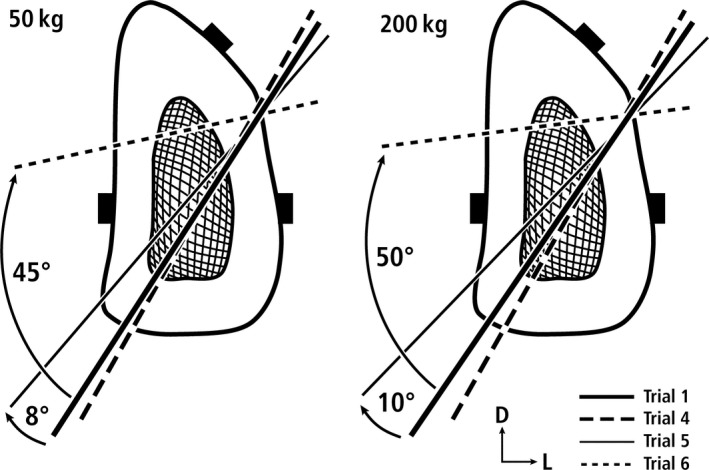
Transverse cross‐section from the 50% location of a deer calcaneus during 50‐kg (at left) and 200‐kg loads (at right) showing the locations of the NA during these trials: (4) plantar ligament separated from the plantar cortex; (5) plantar ligament separated and transected; (6) plantar ligament separated and transected and the SDF tendon transected. D = dorsal, L = lateral.
Figure 7.

(A) Principal strain ratios at four gauge locations (mean values). The data shown for 50‐kg are representative of the various loads used. (B) Material‐axis shear vs. principal strain ratios at the same locations and load conditions are shown in part (A).
Off‐axis loads
As summarized from the strain data, Fig. 5 shows that the rotation of the NA during off‐axis loading does not change enough to invert the on‐axis principal stain‐mode ratios (i.e. tension and compression strains) at the medial or lateral gauges. It was estimated that the NA rotates 13°–15° in the clockwise direction with lateral off‐axis loads of 50 and 200 kg, respectively. During medial off‐axis loading (Fig. 5) the strains increased at the medial (‘compression’) and lateral (‘tension’) gauges, showing that the NA rotates in the counterclockwise direction. It can be estimated that this counterclockwise NA rotation represents 7°–8° with 50‐ and 200‐kg off‐axis loads, respectively.
The probability that the estimated NA location for baseline loading is sufficiently accurate is supported by the fact that it was approximately equidistant from the dorsal‐lateral (DL) and lateral (L) gauges at simulated midstance with 50‐ and 200‐kg applied loads (Fig. 5). This is because the approximate location of zero microstrain (of the principal strains) that defines the NA (Demes, 2007) would be at a location approximately one‐half the distance between these two gauges. When compared with baseline conditions, the NA would, therefore, need to rotate ~ 30° in the counterclockwise direction to traverse the location of the dorsal‐lateral gauge. Conversely, a ~ 30° clockwise rotation would be required for the NA to traverse the location of the lateral gauge, which seems improbable in physiological load conditions.
Loads after transections of tension members
The changes in the location of the NA in trials 4–6 are shown in Fig. 6. Notably, changes in the NA are relatively minor in trial 4 (includes a plantar gauge beneath the plantar ligament) and trial 5 (< ±11°) (trial 5 = transected plantar ligament), which are less than the degrees of rotation shown in the off‐axis trials 2 and 3 (< ±15°). By contrast, in trial 6 (complete transection of all tension members) the NA rotates more dramatically (45°–50°) and shifts dorsally. Although this shift places the NA close to the dorsal cortex, the dorsal cortex still experiences net compression, though of lower magnitudes, when compared with baseline load conditions seen in trial 1. Conversely, the plantar cortex still experiences net tension (here material‐axis shear strains are relatively low) but of higher tension magnitudes when compared with baseline conditions.
Shear strain data in terms of two ‘shear‐strain criteria’, and the analysis of regional strain‐mode ratios
Examination of the strain data shows that material‐axis shear strains predominate at the medial and lateral gauge locations but not on the dorsal and plantar cortices (Tables 1 and 3B). This contrasts with the maximum shear strains, which, when compared with material‐axis shear strains, have relatively greater magnitudes on the dorsal and plantar cortices of this bone, as reported previously (Su et al. 1999).
When analyzing ratios between the absolute magnitudes of principal compression and tension strains vs. material‐axis or maximum shear strains, several additional important observations were made with respect to the dorsal/plantar proportions (i.e. the regional ‘distribution’) of shear strains. The data for the calculation of these ratios were obtained from trial 4 (plantar gauge attached) and are shown in Table 3A. Here we express the relative differences in the areal distribution of each strain mode as ratios between the plantar (‘tension’) gauge and each of the ‘compression region’ gauges (dorsal‐lateral and dorsal‐medial).
When considering principal compression and tension strain data (shear data not considered here) and with respect to each of the two dorsal gauges, these ratios show that compression is relatively more prevalent in the dorsal cortex (dorsal : plantar ratios of compression are 1.50 and 1.59) and tension is more prevalent in the plantar cortex (plantar : dorsal ratios of tension are 3.81 and 3.26).
When considering only maximum shear strain data (which was the only shear‐strain criterion that we reported previously), the plantar : dorsal ratio is: 1.75 for the plantar vs. dorsal‐lateral comparison, and 1.60 for the plantar vs. dorsal‐medial comparison. Similarly, when considering material‐axis shear strain data (reported here for the first time), the plantar : dorsal ratio is 1.75 for the plantar vs. dorsal‐lateral comparison. However, when considering material‐axis shear strain data the ratio is inverted (i.e. becomes < 1.0) in the plantar vs. dorsal‐medial comparison (plantar : dorsal‐medial ratio is 0.85), reflecting the notably lower material‐axis shear strains than maximum shear strains in the plantar cortex (see shear data in Table 1 from all trials that include a plantar gauge).
Table 3B lists ratio comparisons using two strain modes within each cortical region. Notable findings include that in 60% (6/10) of the paired comparisons (see double‐headed arrows in Table 3B) the strain ratios invert, changing to > 1.0 when maximum shear data are compared to material‐axis shear data. In this context, an ‘inversion’ means that, depending on the shear‐strain criterion used, the predominant strain mode switches from shear to either compression or tension (or vice versa). This result, though notable, is not wholly unexpected when considering that all material‐axis shear strain data shown in Table 1 have lower magnitudes when compared with maximum shear strain data.
Discussion
The results of this study show that the change in strain distribution during either medial or lateral off‐axis loading of the deer calcaneus did not invert the principal tension/compression strain ratio at the medial or lateral mid‐shaft gauges when compared with baseline on‐axis loading. Because the NA did not rotate past these gauge locations with these loads, the dorsal cortex still experienced net compression and the plantar cortex experienced net tension (when considering only material‐axis shear strains). When considering all trials, the only inversion of the principal strain ratio occurred at the medial gauge during trial 6 (after transection of all of the tension members). The morphology of the tarsal articulations and collateral ligaments that play an important role in restricting calcaneus motion primarily in the sagittal plane during in vivo loading would also be predicted to function similarly despite the transections performed in this study (Alexander & Bennett, 1987). This constraint would be expected to maintain sagittal‐plane bending, which is consistent with our findings. However, as described below, additional studies are needed to examine more rigorously the strain distributions of artiodactyl calcanei during loads with various limb conformations that more closely replicate other extremes of in vivo activities.
After transection of all of the tension members, the dorsal shift of the NA that then occurred was also associated with rotation (45°–50°), which placed the NA in a more transverse direction (Fig. 6). Because of this transverse orientation, the dorsal cortex remained in net compression, though of lower magnitudes, and the plantar cortex in tension, though of higher magnitudes. These results and those summarized in Figs 5, 6, 7 demonstrate that the relative simplicity of the dorsal/plantar compression/tension strain distribution of this model is maintained during simulated mid‐stance even with simulated loading events that are intended to estimate a spectrum from uncommon/unusual physiologic to extreme load perturbations. However, this conclusion is based only material‐axis shear strains, which presumably have greater biological relevance than maximum shear strains (Carter, 1978). As discussed below, when maximum shear strain data are considered, this challenges the view that the distribution of strain modes and magnitudes along the dorsal‐plantar axis can primarily focus on compression and tension.
The data reported here in baseline load conditions of trial 1 and the less typical load conditions of trials 2–3 show that the NA is also more oblique than was estimated by our prior study (Su et al. 1999). In that study we roughly estimated the NA region and did not apply the more advanced calculations performed in the present study. With a more obliquely oriented NA, the medial cortex experiences higher magnitude and more prevalent compression and, conversely, the lateral cortex experiences greater tension than what we had previously recognized. It is likely that the concavity of the medial to dorsal‐medial cortex (Fig. 2C) accentuates bending in this direction. Nevertheless, the regions that have been analyzed for histomorphological correlates of the predominant/prevalent tension (middle portion of plantar cortex) and compression strains (middle portion of dorsal cortex) of habitual bending (Skedros et al. 2004, 2009; Keenan et al. 2017) still appear accurate because they remain on opposite sides of the NA, even though it is oblique and rotates ~ 50° during trial 6. Additional studies are needed to verify that the obliquely oriented NA shown to occur in baseline loading is actually also common during in vivo loading, and to determine the frequency in the domesticated sheep calcaneus model, which is more amenable to experimental studies than are deer calcanei (Newman et al. 1995; Skerry & Lanyon, 1995; Kennedy et al. 2008, 2009; Oheim et al. 2012; Meakin et al. 2014).
We are aware of only two studies that have measured in vivo strains on artiodactyl calcanei, and both used domesticated sheep calcanei (Lanyon, 1973, 1974). Those studies, however, only examined strains during controlled ambulation (walking and trotting). Hence, they did not examine less frequent load conditions such as darting, jumping, and vigorous running on uneven terrain, which can change strain distributions in limb bones (Biewener et al. 1983a,b; Moreno et al. 2008). In his two studies, Lanyon also: did not place a strain gauge on the plantar cortex (i.e. beneath the plantar ligament) to see whether net tension actually occurs there, and only measured strains on varying locations of the lateral cortex. A limitation of our prior ex vivo study (Su et al. 1999) and of the present ex vivo study includes the use of a fixed limb position during simulated mid‐stance of controlled ambulation. This is potentially important because Lanyon's (1973) data for the sheep calcaneus showed that although peak tension and compression occurred at mid‐stance, peak shear strains on the lateral surface can occur toward the beginning and/or later in stance during walking and trotting. While a seemingly subtle distinction, this can be of importance for interpreting bone adaptation if shear has priority over tension and compression in activating specific remodeling activities [see Discussion of the ‘shear‐resistance priority hypothesis’ elsewhere (Skedros, 2012; Skedros et al. 2015)].
Another limitation of the present study is the possibility that the 5° off‐axis loading conditions of trials 2 and 3 that we simulated are neither extreme nor aggressive in the context of physiologically possible loads. This is because the data that we used to base our selection of 5° off‐axis loading were obtained when loads were applied in the sagittal plane of sheep talocrural joints that were fixed in a naturally occurring flexed position that would occur in controlled ambulation (Alexander & Bennett, 1987). Additionally, the bony anatomy of the tarsus in addition to the collateral ligaments highly constrains the potential motion of the calcaneus, and this constraint persists despite the tendon/ligament transections that were made in this study. Because the tendon direction is determined by its bone and muscle belly attachment sites, a tendon crossing a relatively constrained hinge joint allows for minimal angular change (Alexander & Bennett, 1987). Even though sharp turns will likely have a greater effect on the direction of the ground reaction force and joint forces, we speculate that the strain distribution will not change much farther than what is shown by the off‐axis loads studied herein. This hypothesis warrants testing because some investigators might conclude that modifying the directions of muscle pull by 5° is not unusual because it is not comparable with extreme load variability where strain magnitudes, modes, and rates substantially increase or change when compared with typical ambulatory activities, as has been shown in vivo in human limb bones (Yang et al. 2011). Additional in vivo experiments coupled with more sophisticated ex vivo experiments and finite element analyses are therefore needed to quantify the changes that can occur in strain distributions of the artiodactyl calcaneus with more aggressive and perturbed physiologic and supra‐physiologic loading conditions that occur in vivo, especially in wild animals such as deer. These experiments must model other limb conformations that include various loading vectors and joint angles. Hence, the load perturbations examined in this study should be viewed as an important first step in understanding the biologically relevant strain environment of the functionally loaded deer calcaneus and the role the tension members have in helping to maintain the strain environment within safe limits.
We also only used adult animals in this study. It is not clear how differences in the daily amount and relative frequencies of various locomotor activities in younger mule deer (i.e. fawns, which are < 1 year old) might influence the regional histomorphology and mineralization differences that occur in older subadult and adult deer calcanei. Studies of ontogenetic adaptations in the appendicular skeletons of some animals suggest that the loading environment of growing animals likely influenced the adult morphology. For example, in a study of an ontogenetic series of wild jackrabbits, Carrier (1983) showed that the bone and muscle of growing animals markedly changes in mechanical and physiological characteristics as the animal matures. In contrast, Carrier noted that his results and those of others show that bone and muscle of non‐elderly adult mammals and growing reptiles is relatively uniform in terms of physiological and mechanical properties. We have also shown that ontogenetic changes in load history associated with wing‐flapping behaviours in domesticated turkeys correlate with differences in the histomorphology of the shaft of the ulna in subadults vs. adults (Skedros & Hunt, 2004). Unquantified observations suggest that the ambulatory activities of fawn mule deer are generally increased, including more frequent running, darting, and pronking behaviours, or ‘stotting’, when compared with adults and non‐fawn subadults (Lingle, 1992 and unpublished field observations of wild deer by J. G. Skedros). Because the age difference between fawns and the deer used in the present study is ~ 3 years it seems unlikely that the calcanei used in the present study would be significantly influenced by the increased activities of very young juveniles. Support for this, though indirect, is suggested by results of our past studies that show that most regional differences in structural and material characteristics of cortical bone of mule deer calcanei are similar in older subadult and adult animals, but that these groups differ considerably from older fawns (Skedros et al. 2001, 2004).
As shown in Tables 1 and 3, material‐axis shear strains predominate only in the medial and lateral cortices, which is expected along the NA of a unidirectionally end‐loaded short‐cantilevered beam (Young, 1989: p. 97). It has been suggested that the prevalence of shear strains and/or the obliquity of principal strains in the vicinity of the NA explain why the predominant CFO and secondary osteon morphotypes in this region typically differ from the nearby dorsal and plantar cortices where compression and tension, respectively, have been reported to have a greater effect on the local histomorphology (Su et al. 1999; Skedros & Hunt, 2004; Skedros et al. 2009). Because substantial shear is also present in the ‘compression region’ and ‘tension region’ of short end‐loaded cantilevered beams (Young, 1989), the absence of ‘shear’ in the moniker ‘tension/compression bone’ seems inappropriate/incomplete. This seems especially true in view of the possibility that material‐axis shear strains, even though they are of relatively lower magnitude than the principal strains in the dorsal and plantar cortices, could be important in causing histomorphological adaptation. We have speculated that shear strains, even when they have relatively low magnitudes, play important roles in influencing adaptations of the dorsal and plantar regions; but specific histomorphological features that correlate with the shear strains in these regions have not been identified (Skedros et al. 2013). In this context and in terms of data reported in the present study, it is important to determine whether the absolute magnitudes of shear strains (maximum vs. material‐axis) are in fact relatively greater in terms of their areal distribution when compared with the other regionally predominant strain mode (tension or compression).
As shown in the two columns at the far right side of Table 1, when considering maximum shear data instead of material‐axis shear data, the dominant strain mode changed only in the plantar cortex. This is a very important finding because, as was described in our prior study, it clearly suggests that our often‐stated prior simplification of the deer calcaneus model as a simply loaded ‘tension/compression bone’ (i.e. plantar/dorsal) might be incorrect. This is additionally important because of the priority that shear strains are believed to have in terms of causing bone adaptations when compared with the other two strain modes. Perhaps describing the deer and other artiodactyl calcanei as ‘shear‐tension/compression’ bones with respect to the plantar/dorsal strain distribution would be more appropriate. Alternatively, if the material‐axis shear strain data are in fact more biologically relevant (this assumption is consistent with conventional thinking as stated above), then tension is the dominant strain mode in the plantar cortex and the influence of shear is likely less important (Fig. 7B).
Table 3B (double‐headed arrows) shows that when considering maximum shear vs. material‐axis shear strain data within an individual cortical location and with respect to ratios with principal compression and tension, 60% (6/10) of the paired comparisons had strain ratios that were inverted (i.e. changed from < 1.0 or > 1.0). By ‘inverted’ we mean that the predominant strain mode switches from shear to either compression or tension (or vice versa) depending on the shear‐strain criterion used. This is an important finding because the expected preferential adaptations for shear could be misinterpreted if only one shear criterion was used. Until it can be experimentally determined whether one criterion is more important than the other with respect to causing bone adaptation, we suggest that both shear‐strain criteria should be considered in studies of the presence and consequences (e.g. microstructural adaptation) of inter‐region and local (one region) differences of shear and the other strain modes. In this perspective, it is notable that when shear strains have been quantified in prior studies it is common for investigators to only report one of these criteria, with material‐axis shear strains usually being the only criterion considered (Lanyon, 1973, 1974; Biewener & Dial, 1995; Blob & Biewener, 1999).
Although shear stresses and strains are considered to be important in bone biology (Rubin et al. 1996; Prendergast et al. 1997; Tang et al. 2015; Piccinini et al. 2016; Tiwari & Prasad, 2017), especially with respect to mechanotransduction at the cellular level (Klein‐Nulend et al. 2013; Thi et al. 2013; Wu et al. 2016), studies are needed to determine whether maximum vs. material‐axis shear strains have different potency in causing adaptations, and/or different adaptations in bone material or structural organization. It remains unclear whether the frequent, habitual, low‐magnitude/on‐axis loads or the occasional, high‐magnitude, ‘error’ loads are dominant (Skerry & Lanyon, 1995; Lanyon, 2008; Rubin et al. 2013). The significance of this point is that if habitual loading is the main driver of bone adaptation, then occasional high‐magnitude off‐axis loading does not warrant much attention when interpreting a bone's adaptation to its load history. In other words, in the artiodactyl calcaneus model, it might be irrelevant whether the NA might shift under extreme loading. Alternatively, the more frequent high‐magnitude on‐axis error loads might dominate the less frequent high‐magnitude off‐axis error loads; in this case, off‐axis and other less typical loads are relevant (Skerry & Lanyon, 1995). Finally, the possibility that there are strain‐related adaptations in architectural and material characteristics of trabecular bone can also be examined in the artiodactyl calcaneus. For example, our prior studies of the trabecular bone from dorsal vs. plantar regions suggest that prevalent/predominant shear is accommodated differently compared with tension or compression via specific architectural characteristics (Sinclair et al. 2013; see also Garrison et al. 2009), and differences in the histocompositional organization of individual trabeculae (e.g. mineral content levels and predominant collagen fiber orientation in hemiosteons) in dorsal vs. plantar trabecular regions might reflect a strain‐mode‐related adaptation (Skedros et al. 2012, 2014; Sinclair et al. 2013).
Additional studies are warranted to investigate these issues further, and the artiodactyl calcaneus will likely prove to be a good experimental model in this respect. It is anticipated that prospective studies that experimentally change the strain distribution of this bone by significantly shifting its NA will show the importance of specific strain features in causing bone matrix adaptation. An example of this type of study is provided by Takano et al.'s (1999) controlled experiment on canine radii in which they substantially changed the location of the NA by excising a portion of the ulna. Their results specifically demonstrate how strain mode can be more important than strain magnitude in causing material adaptation of cortical bone. Similar perturbations of the habitual loading of an artiodactyl calcaneus could be achieved using loads imparted in atypical directions via an external fixator as has been described in other applications of ovine limb‐bone loading models (O'Connor et al. 1982; Skerry & Lanyon, 1995; Meakin et al. 2014).
An expression that, while placing greater emphasis on shear, synthesizes all strain modes and additional characteristics of the strain milieu, might eventually be shown to be most appropriate for the artiodactyl calcaneus model. These conclusions will likely apply in more generalized contexts because, across a broad range of species, many limb bones are loaded in directionally consistent bending during typical daily ambulatory activities and hence typically have non‐uniform distributions of tension, compression, and shear (Skedros, 2012). In addition, the physiologic range of bone strain rates and magnitudes involved in appendicular skeletal maintenance and osteogenesis appears to be highly conserved (Rubin & Lanyon, 1984; Al Nazer et al. 2012; Aiello et al. 2015).
Conclusion
The results of this simulated loading analysis of calcanei of adult mule deer support our prior view that the NA would remain between the dorsal and plantar cortices even during simulated loading conditions that are intended to resemble the effects of some unusual/perturbed loading conditions. However, the dominant strain mode on the plantar cortex is tension only when considering material‐axis shear strains. When maximum shear strain data are considered, the dominant strain mode on the plantar cortex changes from tension to shear. Furthermore, when considering material‐axis shear strains, it is clear that they predominate only along the NA. However, when only considering maximum shear data instead of material‐axis shear data, the dominant strain mode changed from being shear in the NA region to the plantar cortex. It is not known whether it is important to distinguish between these two shear‐strain criteria to better understand the mechanisms that cause the histomorphological and compositional (e.g. mineral content) differences that occur between the dorsal and plantar cortical and trabecular regions of sheep and deer calcanei. If maximum shear strains are important in effecting the emergence of the regionally heterogeneous histomorphology of these bones, then the ‘tension/compression bone’ concept might need to be revised such that it reflects this influence (e.g. ‘shear‐tension/compression bone’). In vivo studies coupled with finite element analyses are needed to establish more rigorously the spatial and temporal strain dynamics of this natural and experimental model during many gait‐related activities in order to evaluate more directly and rigorously the speculations and conclusions stated herein. These studies will also be important for confirming the habitual obliquity of the NA in vivo and whether or not similar obliquity occurs in domesticated sheep calcanei, which are more readily available for experimental studies.
Funding
This work was supported by research funds from the Orthopedic Research Laboratory, Department of Orthopedics, University of Utah School of Medicine, Salt Lake City, Utah, USA, and the USA Department of Veterans Affairs medical research funds.
Conflict of interest
The authors have no conflict of interest.
Acknowledgements
The authors thank Scott Sorenson, Chad Marriott, Kendra Keenan, and Dave Schoralle for their technical support and assistance, Drs. David Carrier and Dennis Bramble for offering their expertise and advice on the biomechanics of quadrupedal locomotion, and Dr. Wilson C. Hayes for advice regarding the loading regimens. The comments of anonymous reviewers were also very helpful.
References
- Aiello BR, Iriarte‐Diaz J, Blob RW, et al. (2015) Bone strain magnitude is correlated with bone strain rate in tetrapods: implications for models of mechanotransduction. Proc Biol Sci 282, 1–8. [DOI] [PMC free article] [PubMed] [Google Scholar]
- Al Nazer R, Lanovaz J, Kawalilak C, et al. (2012) Direct in vivo strain measurements in human bone‐a systematic literature review. J Biomech 45, 27–40. [DOI] [PubMed] [Google Scholar]
- Alexander RM (1980) Forces in animal joints. Engng Med 9, 93–97. [Google Scholar]
- Alexander RM, Bennett MB (1987) Some principles of ligament function, with examples from the tarsal joints of the sheep (Ovis aries). J Zool Lond 211, 487–504. [Google Scholar]
- An B, Liu Y, Arola D, et al. (2011) Fracture toughening mechanism of cortical bone: an experimental and numerical approach. J Mech Behav Biomed Mater 4, 983–992. [DOI] [PubMed] [Google Scholar]
- Baumann AP, Aref MW, Turnbull TL, et al. (2015) Development of an in vivo rabbit ulnar loading model. Bone 75, 55–61. [DOI] [PubMed] [Google Scholar]
- Biewener AA (1992) In vivo measurement of bone strain and tendon force In: Biomechanics – Structures and Systems: A Practical Approach (ed. Biewener AA.), pp. 123–147. New York: Oxford University Press. [Google Scholar]
- Biewener AA, Dial KP (1995) In vivo strain in the humerus of pigeons (Columba livia) during flight. J Morphol 225, 61–75. [Google Scholar]
- Biewener AA, Thomason J, Goodship A, et al. (1983a) Bone stress in the horse forelimb during locomotion at different gaits: a comparison of two experimental methods. J Biomech 16, 565–576. [DOI] [PubMed] [Google Scholar]
- Biewener AA, Thomason J, Lanyon LE (1983b) Mechanics of locomotion and jumping in the forelimb of the horse (Equus): in vivo stress developed in the radius and metacarpus. J Zool Lond 201, 67–82. [Google Scholar]
- Blob RW, Biewener AA (1999) In vivo locomotor strain in the hindlimb bones of Alligator mississippiensis and Iguana iguana: implications for the evolution of limb bone safety factor and non‐sprawling limb posture. J Exp Biol 202, 1023–1046. [DOI] [PubMed] [Google Scholar]
- Boyce TM, Fyhrie DP, Glotkowski MC, et al. (1998) Damage type and strain mode associations in human compact bone bending fatigue. J Orthop Res 16, 322–329. [DOI] [PubMed] [Google Scholar]
- Carrier DR (1983) Postnatal ontogeny of the musculo‐skeletal system in the black‐tailed jack rabbit (Lepus californicus). J Zool Lond 201, 27–55. [Google Scholar]
- Carter DR (1978) Anisotropic analysis of strain rosette information from cortical bone. J Biomech 11, 199–202. [DOI] [PubMed] [Google Scholar]
- Cohen J, Harris WH (1958) The three‐dimensional anatomy of haversian systems. J Bone Joint Surg Am 40, 419–434. [PubMed] [Google Scholar]
- Currey JD (2002) Safety factors and scaling effects in bones In: Bones: Structure and Mechanics, pp. 309–336. Princeton: Princeton University Press. [Google Scholar]
- Dally JW, Riley WF (1991) Strain‐gage circuits In: Experimental Stress Analysis, pp. 214–260. New York: McGraw‐Hill Inc. [Google Scholar]
- Demes B (2007) In vivo bone strain and bone functional adaptation. Am J Phys Anthropol 133, 717–722. [DOI] [PubMed] [Google Scholar]
- Diab T, Vashishth D (2007) Morphology, localization and accumulation of in vivo microdamage in human cortical bone. Bone 40, 612–618. [DOI] [PMC free article] [PubMed] [Google Scholar]
- Donahue SW, Sharkey NA, Modanlou KA, et al. (2000) Bone strain and microcracks at stress fracture sites in human metatarsals. Bone 27, 827–833. [DOI] [PubMed] [Google Scholar]
- Garrison JG, Slaboch CL, Niebur GL (2009) Density and architecture have greater effects on the toughness of trabecular bone than damage. Bone 44, 924–929. [DOI] [PMC free article] [PubMed] [Google Scholar]
- Gross TS, McLeod KJ, Rubin CT (1992) Characterizing bone strain distribution in vivo using three triple rosette strain gauges. J Biomech 25, 1081–1087. [DOI] [PubMed] [Google Scholar]
- Hayes WC, Wright TM (1977) An empirical strength theory for compact bone In: Fracture (International Conference on Fracture 4, (ICF4)) pp. 1173–1179. Waterloo, Canada: http://www.gruppofrattura.it/ocs/index.php/ICF/ICF4/paper/view/2318. [Google Scholar]
- Keenan KE, Mears CS, Skedros JG (2017) Utility of osteon circularity for determining species and interpreting load history in primates and nonprimates. Am J Phys Anthropol 162, 657–681. [DOI] [PubMed] [Google Scholar]
- Kennedy OD, Brennan O, Mauer P, et al. (2008) The effects of increased intracortical remodeling on microcrack behaviour in compact bone. Bone 43, 889–893. [DOI] [PubMed] [Google Scholar]
- Kennedy OD, Brennan O, Rackard SM, et al. (2009) Effects of ovariectomy on bone turnover, porosity, and biomechanical properties in ovine compact bone 12 months postsurgery. J Orthop Res 27, 303–309. [DOI] [PubMed] [Google Scholar]
- Kim HA, Clement PJ, Cunningham JL (2008) Investigation of cancellous bone architecture using structural optimisation. J Biomech 41, 629–635. [DOI] [PubMed] [Google Scholar]
- Klein‐Nulend J, Bakker AD, Bacabac RG, et al. (2013) Mechanosensation and transduction in osteocytes. Bone 54, 182–190. [DOI] [PubMed] [Google Scholar]
- Koester KJ, Barth HD, Ritchie RO (2011) Effect of aging on the transverse toughness of human cortical bone: evaluation by R‐curves. J Mech Behav Biomed Mater 4, 1504–1513. [DOI] [PubMed] [Google Scholar]
- Lanyon LE (1973) Analysis of surface bone strain in the calcaneus of sheep during normal locomotion. Strain analysis of the calcaneus. J Biomech 6, 41–49. [DOI] [PubMed] [Google Scholar]
- Lanyon LE (1974) Experimental support for the trajectorial theory of bone structure. J Bone Joint Surg Br 56, 160–166. [PubMed] [Google Scholar]
- Lanyon L (2008) Strain‐related control of bone (re)modeling: objectives, mechanisms and failures. J Musculoskelet Neuronal Interact 8, 298–300. [PubMed] [Google Scholar]
- Lanyon LE, Bourn S (1979) The influence of mechanical function on the development and remodeling of the tibia: an experimental study in sheep. J Bone Joint Surg Am 61, 263–273. [PubMed] [Google Scholar]
- Lingle S (1992) Escape gaits of white‐tailed deer, mule deer and their hybrids: gaits observed and patterns of limb coordination. Behaviour 122, 153–181. [Google Scholar]
- Main RP, Biewener AA (2004) Ontogenetic patterns of limb loading, in vivo bone strains and growth in the goat radius. J Exp Biol 207, 2577–2588. [DOI] [PubMed] [Google Scholar]
- Martinéz‐Reina J, Reina I, Dominguez J, et al. (2014) A bone remodelling model including the effect of damage on the steering of BMUs. J Mech Behav Biomed Mater 32, 99–112. [DOI] [PubMed] [Google Scholar]
- Meakin LB, Price JS, Lanyon LE (2014) The contribution of experimental in vivo models to understanding the mechanisms of adaptation to mechanical loading in bone. Front Endocrinol (Lausanne) 5, 1–13. [DOI] [PMC free article] [PubMed] [Google Scholar]
- Moreno CA, Main RP, Biewener AA (2008) Variability in forelimb bone strains during non‐steady locomotor activities in goats. J Exp Biol 211, 1148–1162. [DOI] [PubMed] [Google Scholar]
- Newman E, Turner AS, Wark JD (1995) The potential of sheep for the study of osteopenia: current status and comparison with other animal models. Bone 16, 277S–284S. [DOI] [PubMed] [Google Scholar]
- Norman TL, Nivargikar SV, Burr DB (1996) Resistance to crack growth in human cortical bone is greater in shear than in tension. J Biomech 29, 1023–1031. [DOI] [PubMed] [Google Scholar]
- O'Connor JA, Lanyon LE, MacFie H (1982) The influence of strain rate on adaptive bone remodeling. J Biomech 15, 767–781. [DOI] [PubMed] [Google Scholar]
- Oheim R, Amling M, Ignatius A, et al. (2012) Large animal model for osteoporosis in humans: the ewe. Eur Cell Mater 24, 372–385. [DOI] [PubMed] [Google Scholar]
- Petrtýl M, Hert J, Fiala P (1996) Spatial organization of Haversian bone in man. J Biomech 29, 161–169. [DOI] [PubMed] [Google Scholar]
- Phelps JB, Hubbard GB, Wang X, et al. (2000) Microstructural heterogeneity and the fracture toughness of bone. J Biomed Mater Res 51, 735–741. [DOI] [PubMed] [Google Scholar]
- Piccinini M, Cugnoni J, Botsis J, et al. (2016) Numerical prediction of peri‐implant bone adaptation: comparison of mechanical stimuli and sensitivity to modeling parameters. Med Eng Phys 38, 1348–1359. [DOI] [PubMed] [Google Scholar]
- Pope MH, Outwater JO (1974) Mechanical properties of bone as a function of position and orientation. J Biomech 7, 61–66. [DOI] [PubMed] [Google Scholar]
- Prendergast PJ, Huiskes R, Søballe K (1997) ESB Research Award 1996. Biophysical stimuli on cells during tissue differentiation at implant interfaces. J Biomech 30, 539–548. [DOI] [PubMed] [Google Scholar]
- Reilly DT, Burstein AH (1975) The elastic and ultimate properties of compact bone tissue. J Biomech 8, 393–405. [DOI] [PubMed] [Google Scholar]
- Reilly GC, Currey JD (1999) The development of microcracking and failure in bone depends on the loading mode to which it is adapted. J Exp Biol 202, 543–552. [DOI] [PubMed] [Google Scholar]
- Reilly GC, Currey JD, Goodship A (1997) Exercise of young thoroughbred horses increases impact strength of the third metacarpal bone. J Orthop Res 15, 862–868. [DOI] [PubMed] [Google Scholar]
- Ross RD, Sumner DR (2017) Bone matrix maturation in a rat model of intra‐cortical bone remodeling. Calcif Tissue Int 101, 193–203. [DOI] [PMC free article] [PubMed] [Google Scholar]
- Rubin CT, Lanyon LE (1984) Dynamic strain similarity in vertebrates; an alternative to allometric limb bone scaling. J Theor Biol 107, 321–327. [DOI] [PubMed] [Google Scholar]
- Rubin CT, Gross TS, Qin Y, et al. (1996) Differentiation of the bone‐tissue remodeling response to axial and torsional loading in the turkey ulna. J Bone Joint Surg Am 78, 1523–1533. [DOI] [PubMed] [Google Scholar]
- Rubin CT, Seeherman H, Qin YX, et al. (2013) The mechanical consequences of load bearing in the equine third metacarpal across speed and gait: the nonuniform distributions of normal strain, shear strain, and strain energy density. FASEB J 27, 1887–1894. [DOI] [PMC free article] [PubMed] [Google Scholar]
- Ruff CB (1983) The contribution of cancellous bone to long bone strength and rigidity. Am J Phys Anthrop 61, 141–143. [DOI] [PubMed] [Google Scholar]
- Sinclair KD, Farnsworth RW, Pham TX, et al. (2013) The artiodactyl calcaneus as a potential ‘control bone’ cautions against simple interpretations of trabecular bone adaptation in the anthropoid femoral neck. J Hum Evol 64, 366–379. [DOI] [PubMed] [Google Scholar]
- Skedros JG (2012) Interpreting load history in limb‐bone diaphyses: important considerations and their biomechanical foundations In: Bone Histology: An Anthropological Perspective (eds. Crowder C, Stout S.), pp. 153–220. Boca Raton: CRC Press. [Google Scholar]
- Skedros JG, Baucom SL (2007) Mathematical analysis of trabecular ‘trajectories’ in apparent trajectorial structures: the unfortunate historical emphasis on the human proximal femur. J Theor Biol 244, 15–45. [DOI] [PubMed] [Google Scholar]
- Skedros JG, Hunt KJ (2004) Does the degree of laminarity mediate site‐specific differences in collagen fiber orientation in primary bone? An evaluation in the turkey ulna diaphysis. J Anat 205, 121–134. [DOI] [PMC free article] [PubMed] [Google Scholar]
- Skedros JG, Bloebaum RD, Mason MW, et al. (1994a) Analysis of a tension/compression skeletal system: possible strain‐specific differences in the hierarchical organization of bone. Anat Rec 239, 396–404. [DOI] [PubMed] [Google Scholar]
- Skedros JG, Mason MW, Bloebaum RD (1994b) Differences in osteonal micromorphology between tensile and compressive cortices of a bending skeletal system: Indications of potential strain‐specific differences in bone microstructure. Anat Rec 239, 405–413. [DOI] [PubMed] [Google Scholar]
- Skedros JG, Su SC, Bloebaum RD (1997) Biomechanical implications of mineral content and microstructural variations in cortical bone of horse, elk, and sheep calcanei. Anat Rec 249, 297–316. [DOI] [PubMed] [Google Scholar]
- Skedros JG, Mason MW, Bloebaum RD (2001) Modeling and remodeling in a developing artiodactyl calcaneus: a model for evaluating Frost's Mechanostat hypothesis and its corollaries. Anat Rec 263, 167–185. [DOI] [PubMed] [Google Scholar]
- Skedros JG, Sybrowsky CL, Parry TR, et al. (2003) Regional differences in cortical bone organization and microdamage prevalence in Rocky Mountain mule deer. Anat Rec A Discov Mol Cell Evol Biol 274, 837–850. [DOI] [PubMed] [Google Scholar]
- Skedros JG, Hunt KJ, Bloebaum RD (2004) Relationships of loading history and structural and material characteristics of bone: development of the mule deer calcaneus. J Morphol 259, 281–307. [DOI] [PubMed] [Google Scholar]
- Skedros JG, Dayton MR, Sybrowsky CL, et al. (2006a) The influence of collagen fiber orientation and other histocompositional characteristics on the mechanical properties of equine cortical bone. J Exp Biol 209, 3025–3042. [DOI] [PubMed] [Google Scholar]
- Skedros JG, Sorenson SM, Takano Y, et al. (2006b) Dissociation of mineral and collagen orientations may differentially adapt compact bone for regional loading environments: results from acoustic velocity measurements in deer calcanei. Bone 39, 143–151. [DOI] [PubMed] [Google Scholar]
- Skedros JG, Sorenson SM, Hunt KJ, et al. (2007) Ontogenetic structural and material variations in ovine calcanei: a model for interpreting bone adaptation. Anat Rec 290, 284–300. [DOI] [PubMed] [Google Scholar]
- Skedros JG, Mendenhall SD, Kiser CJ, et al. (2009) Interpreting cortical bone adaptation and load history by quantifying osteon morphotypes in circularly polarized light images. Bone 44, 392–403. [DOI] [PubMed] [Google Scholar]
- Skedros JG, Sybrowsky CL, Anderson WE, et al. (2011) Relationships between in vivo microdamage and the remarkable regional material and strain heterogeneity of cortical bone of adult deer, elk, sheep and horse calcanei. J Anat 219, 722–733. [DOI] [PMC free article] [PubMed] [Google Scholar]
- Skedros JG, Knight AN, Farnsworth RW, et al. (2012) Do regional modifications in tissue mineral content and microscopic mineralization heterogeneity adapt trabecular bone tracts for habitual bending? Analysis in the context of trabecular architecture of deer calcanei. J Anat 220, 242–255. [DOI] [PMC free article] [PubMed] [Google Scholar]
- Skedros JG, Keenan KE, Williams TJ, et al. (2013) Secondary osteon size and collagen/lamellar organization (‘osteon morphotypes’) are not coupled, but potentially adapt independently for local strain mode or magnitude. J Struct Biol 181, 95–107. [DOI] [PubMed] [Google Scholar]
- Skedros JG, Mears CS, Epperson RT, et al. (2014) Trabecular bone has the capacity for hemiosteonal collagen/lamellar “morphotype’ adaptation: implications for advancing understanding of the emergence of skeletal fragility in the elderly. 60th Annual Meeting of the Orthopaedic Research Society, 0622.
- Skedros JG, Keenan KE, Mears CS, et al. (2015) The ‘shear resistance‐priority hypothesis’: a means for enhancing understanding of material adaptations in bones that habitually experience complex loading. Am J Phys Anthropol 154, 290. [Google Scholar]
- Skerry TM, Lanyon LE (1995) Interruption of disuse by short duration walking exercise does not prevent bone loss in the sheep calcaneus. Bone 16, 269–274. [DOI] [PubMed] [Google Scholar]
- Su SC (1998) Microstructure and mineral content correlations to strain parameters in cortical bone of the artiodactyl calcaneus. Department of Bioengineering (Masters Thesis), pp. 64 Salt Lake City: University of Utah. [Google Scholar]
- Su SC, Skedros JG, Bachus KN, et al. (1999) Loading conditions and cortical bone construction of an artiodactyl calcaneus. J Exp Biol 202, 3239–3254. [DOI] [PubMed] [Google Scholar]
- Takano Y, Turner CH, Owan I, et al. (1999) Elastic anisotropy and collagen orientation of osteonal bone are dependent on the mechanical strain distribution. J Orthop Res 17, 59–66. [DOI] [PubMed] [Google Scholar]
- Tang T, Ebacher V, Cripton P, et al. (2015) Shear deformation and fracture of human cortical bone. Bone 71, 25–35. [DOI] [PubMed] [Google Scholar]
- Thi MM, Suadicani SO, Schaffler MB, et al. (2013) Mechanosensory responses of osteocytes to physiological forces occur along processes and not cell body and require αVβ3 integrin. Proc Natl Acad Sci USA 110, 21012–21017. [DOI] [PMC free article] [PubMed] [Google Scholar]
- Tiwari AK, Prasad J (2017) Computer modelling of bone's adaptation: the role of normal strain, shear strain and fluid flow. Biomech Model Mechanobiol 16, 395–410. [DOI] [PubMed] [Google Scholar]
- Turner AS (2001) Animal models of osteoporosis – necessity and limitations. Eur Cell Mater 1, 66–81. [DOI] [PubMed] [Google Scholar]
- Turner CH, Wang T, Burr DB (2001) Shear strength and fatigue properties of human cortical bone determined from pure shear tests. Calcif Tissue Int 69, 373–378. [DOI] [PubMed] [Google Scholar]
- Wu X, Wang N, Wang Z, et al. (2016) Mathematically modeling fluid flow and fluid shear stress in the canaliculi of a loaded osteon. Biomed Eng Online 15(Suppl. 2), 1–13. [DOI] [PMC free article] [PubMed] [Google Scholar]
- Yang PF, Bruggemann GP, Rittweger J (2011) What do we currently know from in vivo bone strain measurements in humans? J Musculoskelet Neuronal Interact 11, 8–20. [PubMed] [Google Scholar]
- Yang H, Embry RE, Main RP (2017) Effects of loading duration and short rest insertion on cancellous and cortical bone adaptation in the mouse tibia. PLoS ONE 12, e0169519. [DOI] [PMC free article] [PubMed] [Google Scholar]
- Young WC (1989) Roark's Formulas for Stress and Strain. New York: McGraw‐Hill. [Google Scholar]
- Young WC, Budynas RG (2002) Roark's Formulas for Stress and Strain. New York: McGraw‐Hill. [Google Scholar]