Abstract
Purpose
To compare the diagnostic ability of the vessel parameters in macular and peripapillary regions measured using spectral-domain optical coherence tomography angiography (SD-OCTA) in differentiating primary open-angle glaucoma (POAG) from healthy eyes.
Methods
POAG patients and healthy subjects underwent 6 × 6-mm scans centered on the macula and optic nerve head. Commercially available automatic segmentation created en face images from SD-OCTA of the superficial retinal layer (SRL) of the macular (m) and peripapillary (cp) regions. Vessel area density (VAD), vessel skeleton density (VSD), vessel complexity index (VCI), and flux were calculated. Area under curve (AUC) statistics controlled for age and intereye correlation.
Results
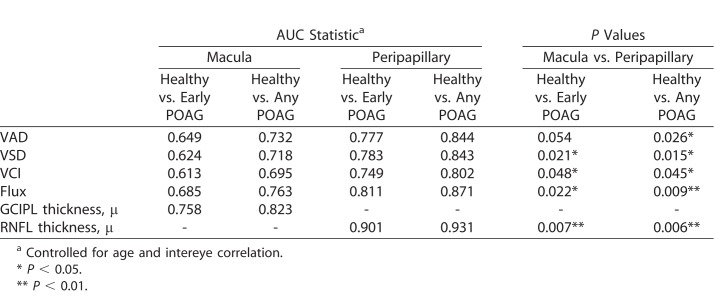
Of 126 eyes from 79 patients who underwent SD-OCTA macula and peripapillary imaging, 50 eyes from 35 POAG patients and 37 healthy eyes from 25 control subjects had good quality imaging and were studied. Diagnostic accuracies of four perfusion parameters, VAD, VSD, VCI, and flux, were significantly greater in the peripapillary compared with the macular regions. For VAD, the cpAUC was 0.84 and mAUC was 0.73 (AUC difference: P = 0.026). For VSD, the cpAUC was 0.84 and mAUC was 0.72 (ΔP = 0.015). For VCI, the cpAUC was 0.80 and mAUC was 0.70 (ΔP = 0.045). For flux, the cpAUC = 0.87 and mAUC was 0.76 (ΔP = 0.0091).
Conclusions
Peripapillary perfusion parameters performed better than macular perfusion parameters for glaucoma diagnosis, supporting the idea that glaucomatous superficial retinal vascular changes are more pronounced in the peripapillary region.
Translational Relevance
The diagnostic accuracy of OCTA perfusion parameters of the superficial retinal microcirculation was greater for the peripapillary region than the macular region in the diagnosis of glaucoma.
Keywords: OCTA, glaucoma, diagnosis
Introduction
Glaucoma, a leading cause of irreversible blindness worldwide, is characterized by progressive loss of retinal ganglion cells (RGCs) and their axons (retinal nerve fiber layer; RNFL).1,2 Clinical diagnosis is usually made after evaluating the optic disc on clinical exam, visual fields, and OCT testing.3 Prior studies have shown that early glaucomatous damage can be detected by OCT as reduced RNFL thickness in the peripapillary region or thinning of the ganglion cell complex within the macula, which contains the highest concentration of RGCs.4–6
The pathophysiology of glaucoma is not fully understood. Reduction of intraocular pressure (IOP) is the only proven treatment to slow glaucomatous damage.7 However, significant basic and clinical studies support a role of unstable ocular blood flow in glaucoma pathogenesis.8 Some studies have recently suggested that reduced ocular blood flow is a primarily independent metric of visual function outside of other structural parameters, supporting a vascular role in the development of glaucoma.9,10
Previous efforts to study ocular blood flow were limited by invasive imaging modalities, which required intravenous dye administration and inability to measure the microcirculation.11,12 Optical coherence tomography angiography (OCTA) is a relatively nascent technology able to noninvasively evaluate in vivo microvascular perfusion in various retinal layers with repeatable and reproducible measurements.13–15 Studies have consistently demonstrated reduced optic nerve head (ONH),13,14,16 peripapillary,17 and macular18–21 perfusion in glaucoma patients using OCTA. Decreased vessel density has been reported to be significantly associated with the severity of functional loss, independent of structural loss.9,10 Thus, the use of vessel density measurements from OCTA may complement existing structural parameters to detect glaucoma and its progression by detecting changes in microvasculature supplying the ganglion cell bodies and axons prior to changes in structural thickness measurements.10,22–25
Currently, studies show variable diagnostic ability of macular and peripapillary vascular parameters. Some studies have found inferior diagnostic ability of vascular parameters compared with structural parameters, such as RNFL thickness,26,27 while other studies showed comparable diagnostic accuracy.28 However, these studies used different scan sizes, segmentation techniques, study populations, and vessel parameters. The purpose of our study was to compare the diagnostic ability between macular and peripapillary regions of perfusion parameters for the superficial retina using a commercially available spectral-domain OCTA (SD-OCTA) segmentation protocol in differentiating primary open-angle glaucoma (POAG) from healthy eyes.
Methods
Study Group Selection and Clinical Assessment
An observational, cross-sectional study was performed on healthy subjects and POAG patients presenting to the glaucoma service at USC Roski Eye Institute, Keck Medicine of University of Southern California over 18 months (March 1, 2016 to October 31, 2017). The research protocol was approved by the institutional review board and carried out in accordance with the Declaration of Helsinki. Written informed consent was obtained from each subject following an explanation of the nature of the study.
The diagnosis of POAG was based on diagnosis by a fellowship-trained glaucoma specialist, incorporating clinical exam demonstrating an optic nerve rim defect (notching or localized thinning) characteristic of glaucoma. RNFL thickness and deviation maps from OCT (Cirrus HD-OCT 5000; Zeiss, Dublin, CA) were reviewed on all patients, and all glaucoma cases demonstrated focal RNFL thinning consistent with the funduscopic disc findings. For perimetric glaucoma, Humphrey Swedish Interactive Threshold Algorithm (SITA) 24-2 visual fields (VFs) had at least one of the following three: a glaucoma hemifield test outside normal limits, pattern standard deviation (PSD) outside normal limits (P < 0.05), or a cluster of three or more adjacent points in locations characteristic of glaucoma, all of which were reduced on the pattern deviation plot at a P < 5% level. Preperimetric glaucoma eyes had the optic nerve rim defect, consistent OCT findings, without qualifying VF findings. Staging of disease was based on the International Classification of Disease and Related Health Problems, as validated previously.29 Healthy participants in the study had normal clinical exam results, including nonglaucomatous optic discs and IOP of 21 mm Hg or less. Inclusion criterion for both glaucoma and healthy groups included age 22 years and older. Exclusion criteria included known refractive error greater than +6.00 diopters (D) or less than −9.00 D, macular or other retinal or optic nerve disease, history of ocular trauma or ocular surgeries other than uncomplicated cataract and glaucoma surgery, and signal strength of 6 or less (of 10).
Demographic information collected from the clinical chart included age, sex, IOP, central corneal thickness (CCT), cup-to-disc ratio (CDR), glaucoma medications, diagnoses of diabetes or hypertension, prior ocular surgeries, VF mean deviation (MD), VF pattern standard deviation (PSD), and average global GCIPL and RNFL thicknesses in glaucomatous and healthy eyes included in the study. The mean GCIPL thickness was based on ganglion cell analysis of an area outlined by two ellipsoids, with the outer ellipsoid having a vertical diameter of 4 mm and a horizontal diameter of 4.8 mm and the inner blacked-out ellipsoid having a vertical diameter of 1 mm and a horizontal diameter of 1.2 mm, around the fovea. The average RNFL thickness was measured along a 3.4-mm diameter circle centered on the optic nerve.
All subjects underwent slit-lamp biomicroscopy, IOP measurement using Goldman applanation tonometry, VF testing (Humphrey Field Analyzer II-i 24-2; Zeiss), OCT imaging of GCIPL and RNFL thickness (Cirrus HD-OCT 5000; Zeiss), and OCT angiography imaging (Zeiss Angioplex OCT Angiography; center wavelength 840 nm) acquiring 6 × 6-mm scans of the macular and peripapillary regions.
OCTA Image Analysis
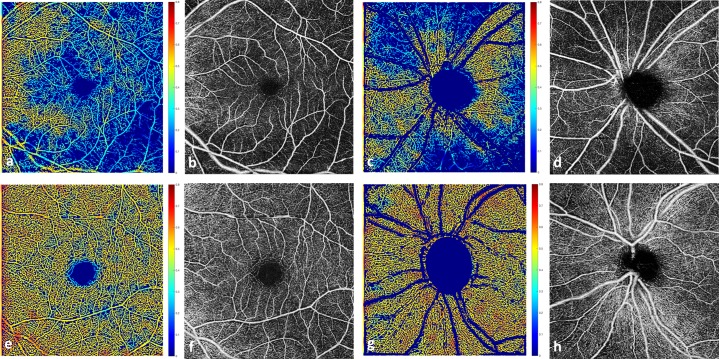
Commercially available Food and Drug Administration–approved algorithms for optical microangiography (OMAG) based automatic segmentation of the raw OCTA data were used to obtain superficial retinal layer (SRL) en face images of the macular and peripapillary regions. The inner surface of SRL was defined by the internal limiting membrane (ILM). The outer surface of SRL was an approximation of inner plexiform layer (IPL), where IPL is estimated to be at 70% of the thickness between the ILM and the retinal pigment epithelium. The segmentation software automatically detected the boundaries of the retinal layers from the structural OCT cross-sectional images by measuring the gradient of OCT signals to create SRL en face images of the macular and peripapillary regions (Fig. 1).
Figure 1.
Top row: from a representative patient, left eye with severe glaucoma. (a) Vessel density map of the macula region overlaid on binary vessel map; (b) OCTA en face image, within the SRL, of the macular region with microcirculation defects greatest inferotemporally; (c) vessel density map of the peripapillary region overlaid on binary vessel map; and (d) OCTA SRL en face image of the peripapillary region also with inferior and superior microcirculation defects. Bottom row: from a representative healthy subject, left eye (e–h) corresponding images without microcirculation defects.
Following this, custom quantification software30 with an interactive interface was used to quantify retinal vascular density and morphology from four parameters for the entire macular and peripapillary regions (MATLAB R2016a; MathWorks, Natick, MA). The global OCTA parameter measurements were based on the entire 6 × 6-mm scan. The original grayscale en face OCTA images of the 6 × 6-mm macular SRL and peripapillary SRL were converted to binarized, black and white images using a three-way combined method consisting of global thresholding, Hessian filter, and adaptive threshold. The areas within the foveal avascular zone and the optic nerve head were selected to establish the baseline background noise for global thresholding. A vessel perimeter map was created by outlining vessel boundaries in the binarized image. A vessel skeleton map was created by linearizing vessel signals into 1-pixel width.
Four vessel parameters provided distinct and biologically relevant information about microvasculature perfusion in the macular and peripapillary regions. Large vessels of more than 32 μ were removed from the image area to be quantified. Vessel area density (VAD) provided information about both medium vessels and capillaries. From the binarized image, VAD was the unitless proportion of total sum area of white pixels with detected OCTA signal divided by the total sum area of all pixels in the binarized image, excluding the areas occupied by the vessels larger than 32 μ. Vessel skeleton density (VSD) was considered a marker for perfused capillary density. VSD was the sum of white pixels in the skeletonized image from linearized OCTA signal divided by the sum of all pixels in skeletonized image. Vessel complexity index (VCI) was used to detect presence of degree of vessel branching or morphologic abnormalities. VCI was the square of the sum of pixels occupied by the vessel perimeter image divided by 4π times the sum of white pixels in the binarized image. Flux index measures the number of blood cells passing through a retinal vessel cross-sectional area per unit time. The blood flux index was defined as the mean flow intensity in the vessel area, where the blood flow signal was normalized from 0 to 1 by dividing by the full dynamic range of blood flow signal intensity. This was a unitless ratio.
Statistical Analysis
SAS 9.4 (Cary, NC), STATA 15.1 (College Station, TX), and Microsoft Excel 2016 Software (Redmond, WA) were used for all data analyses. Clustered Wilcoxon rank sum test was used to compare differences in eye-specific demographics between the healthy and POAG, controlling for intereye correlation. Wilcoxon rank sum test was used to compare differences in person-specific continuous variables between the two groups. Exact χ2 test was used to test differences in person-specific categoric variables between the two groups. All tests were two-sided and used a significance level of 0.05. Receiver-operating-characteristics (ROC) curve statistics, specifically area under the curve (AUC), were calculated to assess diagnostic accuracy and controlled for age and intereye correlation. DeLong's method was used to nonparametrically compare the AUCs among OCT and OCTA parameters between the two groups, controlling for age and intereye correlation.31 Two-way mixed intraclass correlations were calculated to test the agreement of quantification results between repeated testing by the same operator (test-retest reliability) and between two operators (intergrader reliability) based on a subset of eight healthy and eight glaucoma eyes.
Results
Of 126 eyes from 79 patients who underwent SD-OCTA macula and peripapillary imaging and met our inclusion and exclusion criteria, 50 eyes from 35 POAG patients and 37 healthy eyes from 25 control subjects were studied. The other eyes were excluded due to poor image quality from motion artifact, blink artifact, or media opacities such as vitreous floaters. Twenty-four eyes from 19 patients had mild POAG (5 eyes were preperimetric), 10 eyes from 10 patients had moderate POAG, and 16 eyes from 13 patients had severe POAG. Early glaucoma eyes included eyes with mild or moderate glaucoma, excluding severe glaucoma.
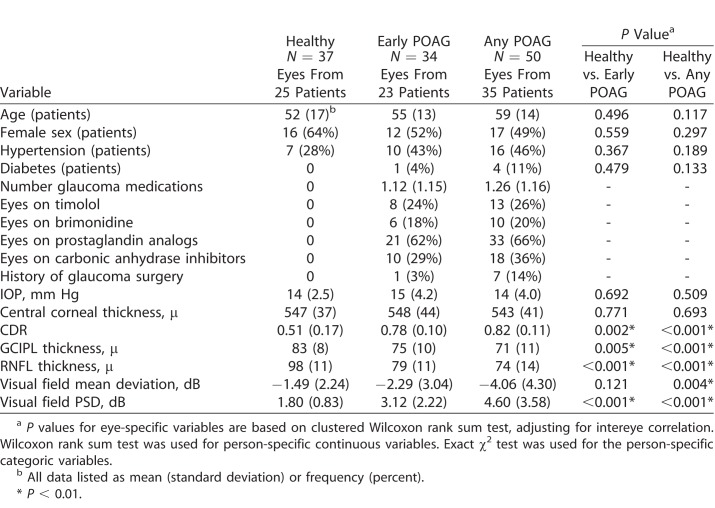
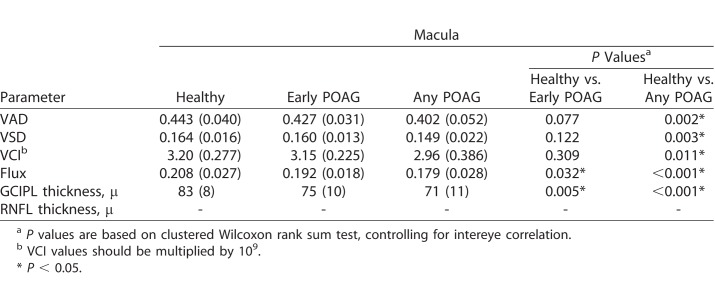
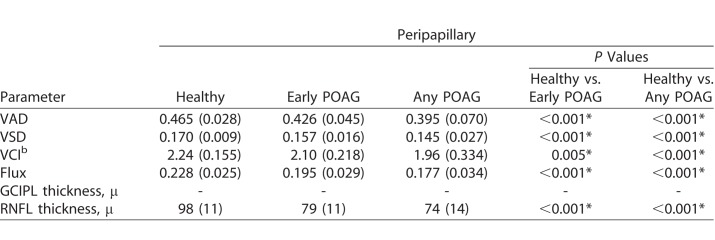
The average age was 59 years in the POAG group and 52 years in the healthy group (P = 0.12). Nonetheless, both age and intereye correlation was controlled for in our analyses. There was no difference in sex, hypertension, diabetes, IOP, or CCT between the healthy and POAG groups (Table 1). As expected, there was a significant difference in CDR, GCIPL thickness, RNFL thickness, and VF MD and PSD between the healthy and glaucoma eyes, controlling for intereye correlation. In addition, there was significantly reduced global VAD, global VSD, global VCI, and global flux in the SRL microcirculation in the POAG groups (early POAG, any POAG) compared with healthy groups (Table 2), controlling for intereye correlation. The test-retest reliability was more than 0.999 for each macular and peripapillary parameter, and the inter-user reliability was more than 0.999 for each parameter, except for peripapillary VCI, where it was 0.996.
Table 1.
Demographic and Clinical Data of Healthy, Early Glaucoma, and Glaucoma Groups
Table 2.
Mean Global OCTA and OCT Parameters of Macular and Peripapillary Regions
Table 2.
Extended
Table 3 demonstrates the diagnostic accuracy of each of the global OCT and OCTA parameters for macular and peripapillary regions, controlling for age and intereye correlation. Diagnostic accuracies for the peripapillary and macular regions, respectively, between healthy and POAG eyes were as follows: 0.844 and 0.732 for VAD (AUC difference: [Δ] P = 0.026); 0.843 and 0.718 for VSD (ΔP = 0.015); 0.802 and 0.695 for VCI (ΔP = 0.045); and 0.871 and 0.763 for flux (ΔP = 0.009) (Fig. 2). Diagnostic accuracy for RNFL thickness was 0.931 and GCIPL thickness was 0.823 (ΔP = 0.006) between healthy and POAG eyes (Fig. 3). Diagnostic accuracies for the peripapillary and macular regions, respectively, between healthy and early POAG eyes were as follows: 0.777 and 0.649 for VAD (ΔP = 0.054); 0.783 and 0.624 for VSD (ΔP = 0.021); 0.749 and 0.613 for VCI (ΔP = 0.048); and 0.811 and 0.685 for flux (ΔP = 0.022) (Fig. 4). Diagnostic accuracy for RNFL thickness was 0.901 and GCIPL thickness was 0.758 (ΔP = 0.007) between healthy and early POAG eyes (Fig. 5).
Table 3.
Diagnostic Accuracy of Global OCTA and OCT Parameters of Macular and Peripapillary Regions
Figure 2.
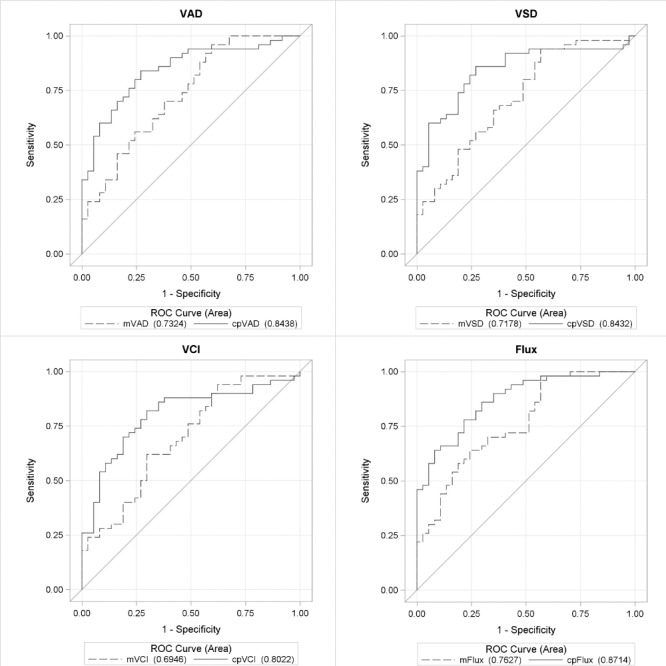
ROC curves for OCTA parameters between POAG and healthy eyes. ROC curves for global VAD, VSD, VCI, and flux for macular (m) and peripapillary (cp) regions for differentiating between healthy and glaucoma eyes, controlling for age and intereye correlation.
Figure 3.
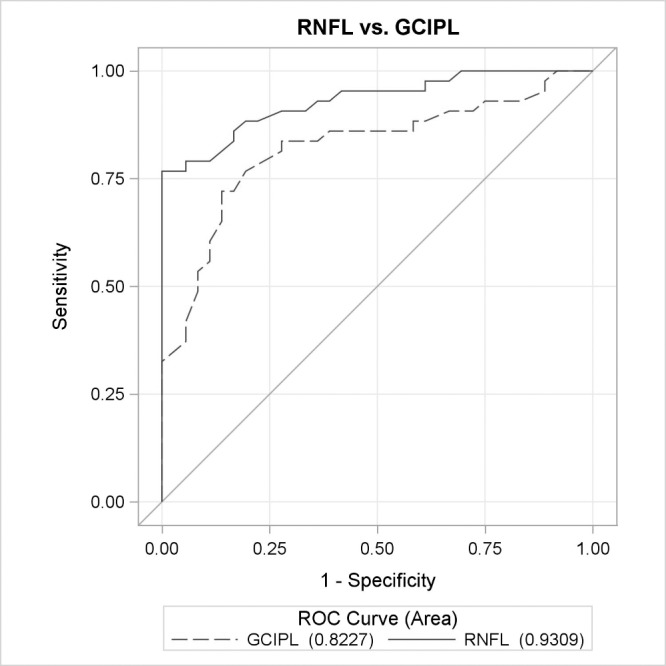
ROC curves for OCT parameters between POAG and healthy eyes. ROC curves for global OCT parameters, GCIPL and RNFL, for macula and peripapillary regions between healthy and glaucoma eyes, controlling for age and intereye correlation.
Figure 4.
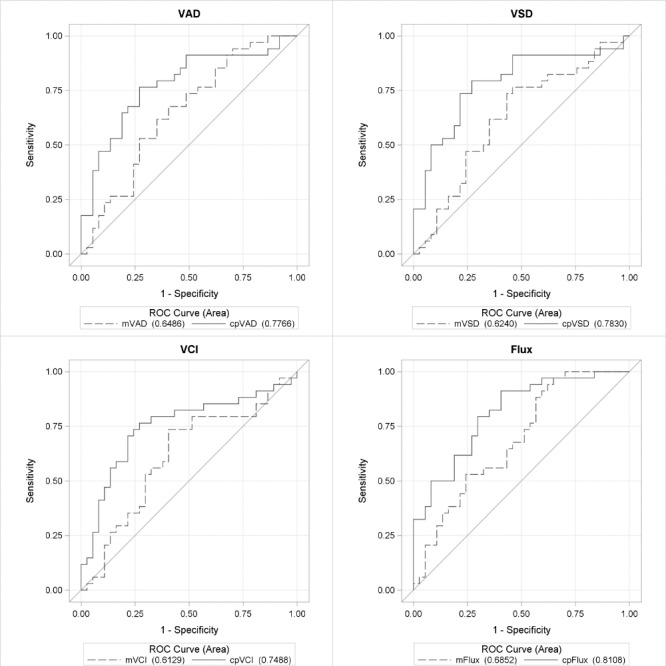
ROC curves for OCTA parameters between early glaucoma and healthy eyes. ROC curves for VAD, VSD, VCI, and flux for macular (m) and peripapillary (cp) regions for differentiating between healthy and early glaucoma eyes, controlling for age and intereye correlation.
Figure 5.
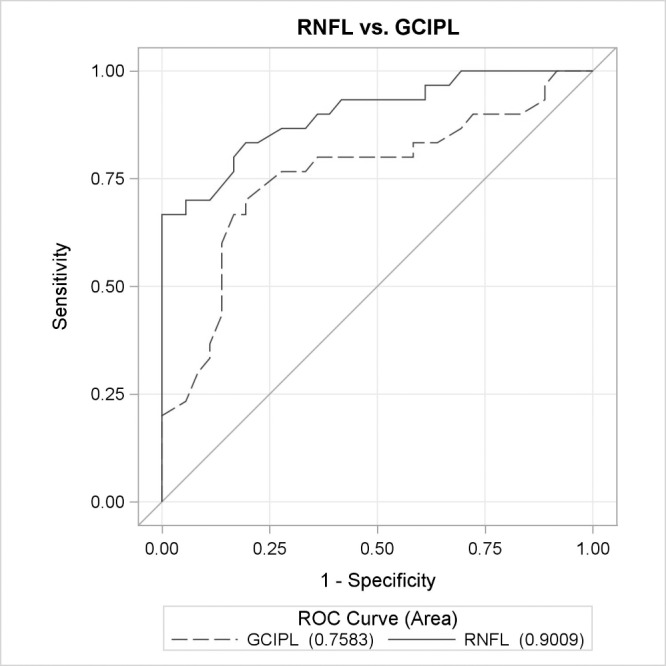
ROC curves for OCTA parameters between early glaucoma and healthy eyes. ROC curves for global OCT parameters, GCIPL and RNFL, for macula and peripapillary regions between healthy and early glaucoma eyes, controlling for age and intereye correlation.
The OCT parameter AUC values were generally higher than the OCTA parameters for the corresponding anatomic regions. DeLong's method was used to determine whether those AUC values were statistically different from one another. The P values for comparing AUC values of global OCTA parameters to that of GCIPL and RNFL thickness values, for the macular and peripapillary regions, respectively, between healthy and POAG eyes were: 0.179 and 0.062 for VAD; 0.117 and 0.065 for VSD; 0.066 and 0.023 for VCI; and 0.301 and 0.113 for flux. The P values for comparing AUC values of global OCTA parameters to that of corresponding GCIPL and RNFL thickness values, for the macular and peripapillary regions, respectively, between healthy and early POAG eyes were as follows: 0.215 and 0.069 for VAD; 0.139 and 0.084 for VSD; 0.126 and 0.053 for VCI; and 0.330 and 0.099 for flux.
Discussion
In the present study, we evaluated four OCTA perfusion parameters (VAD, VSD, VCI, and flux) in the peripapillary region and the macula and evaluated their diagnostic accuracies for detection of glaucoma. In the macular region, there were 1.6% to 7.7 % reductions in perfusion parameter values in early POAG eyes compared with controls and 7.5% to 14% reductions in perfusion parameter values in all POAG eyes compared with controls. This was more pronounced in the peripapillary region, with 6.3% to 14.5% reductions for early POAG and 12.5% to 22.4% reductions in perfusion parameter values in all POAG eyes, compared with controls. The diagnostic accuracies of any POAG, as measured by AUC, ranged from 0.70 to 0.76 for the macula scans compared with 0.80 to 0.87 in the peripapillary scans in the case of all four OCTA parameters. These values were slightly reduced when considering detection of only early POAG, with AUC values ranging from 0.61 to 0.69 for the macula scans compared with 0.75 to 0.81 for the peripapillary scans. Overall, the peripapillary region generally outperformed the macular region, and this is consistent with OCT findings in our and other studies32 showing a higher diagnostic accuracy for peripapillary RNFL thickness compared with macular GCIPL thickness (0.93 vs. 0.82 in our study). Glaucomatous damage is understood to originate at the optic nerve head with direct mechanical and/or vascular damage occurring to the RGC axons at this level; thus, it makes sense that the peripapillary region of RNFL and its vasculature has more diagnostic value than that of the ganglion cell bodies in the macula. In addition, the peripapillary region encompasses axons and corresponding microcirculation from the entire retinal distribution; whereas the macular GCIPL and its vasculature, while making up approximately half of total RGCs, necessarily does not represent the entire retinal distribution.4
A few other studies have recently reported diagnostic accuracy of OCTA vessel density in both or either anatomic regions.26,33–36 These studies differed from ours in use of device (Angiovue SD-OCTA33–36or Plex Elite SS-OCTA26), image size (3 × 3 for macula,32 4.5 × 4.5 mm for nerve26,27,34,36), and exclusion of preperimetric glaucoma34–36 from the glaucoma group. The AUCs ranged from 0.83 to 0.93 in the peripapillary region and 0.63 to 0.96 in the macular region, with the higher values coming from studies that excluded preperimetric glaucoma cases.34–36 Overall, these results are consistent with our own. While Triolo et al.26 and Rao et al.27 support our findings that the peripapillary region outperforms the macular region, Chen et al.18 showed equivalent diagnostic accuracy between the peripapillary and macular regions. This may be attributed to the smaller sample size and difference in case severity in the study by Chen et al.18 It was interesting that we had very comparable AUC values to other studies for the peripapillary region despite using a larger scan size than the other studies. This suggests that the resolution provided by our 6 × 6-mm scan size appears adequate and equivalent to smaller scan sizes, but this idea deserves direct study. Interestingly, the diagnostic accuracies provided by Triolo et al.,26 a study that used a swept-source OCTA device, showed AUC values similar to ours and the other studies and thus did not demonstrate a diagnostic advantage to using swept-source technology.
While there was a trend of the diagnostic accuracies for the OCT parameters being slightly higher, both macular and peripapillary OCTA parameters did not significantly differ in diagnostic accuracy compared with mean GCIPL thickness and mean RNFL thickness, respectively. The only exception to this was AUC for VCI in the peripapillary region, which was significantly lower than that for mean RNFL thickness, and this was likely a reflection of the overall weaker diagnostic performance of VCI compared with the other OCTA parameters. It is worth noting that in comparing the OCTA to OCT parameters, our goal was to compare commercially available measurements by the same device. Thus, while the anatomic areas covered by the OCTA and OCT measurements for the macula and peripapillary, respectively, are similar, they are not identical, as specified in the methods section. Equivalent diagnostic accuracies between OCTA parameters and their structural thickness counterparts have also been demonstrated in other studies34,36 and shows great promise that OCTA, with additional development and understanding, could supplement current glaucoma diagnostic tools.
In both regions, there was a trend that the perfusion parameter with the highest diagnostic accuracy was flux. Flux directly measures the mean flow intensity in the vessel area,37 which can be interpreted as a measure of the number of red blood cells passing an area per unit time; whereas vessel area density (also referred to as vessel density in other papers) measures the percentage of area occupied by vessels. For both parameters, large vessels were excluded from the calculation. The higher performance by flux suggests that there may be additional diagnostic information in understanding the fluid dynamics within the small- and medium-sized vessels rather than just the overall area occupied by perfused vessels. These data suggest that development and improved understanding of OCTA parameters that aim to understand fluid dynamics are likely to improve the utility of OCTA in glaucoma.
Unique from other similar studies, our study used the OMAG-based form of SD-OCTA to compare diagnostic accuracies of the macular and peripapillary regions. Other strengths of our study include the application of varied OCTA perfusion parameters, including flux that may provide insight into fluid dynamics, VSD providing capillary density, and VAD providing vessel density of small and medium vessels. In addition, our study included preperimetric glaucoma eyes, in addition to more moderate and severe cases; thus, providing a more realistic representation of glaucoma patients.
Our study presents some limitations. These include its case-control design precluding full application to a true clinic population, and the potentially confounding effect of eye drops and glaucoma procedures on retinal microcirculation. Of the 50 glaucomatous eyes in the study, 13 were on a beta-blocker eye drop, 10 on an α2-adrenergic agonist, 33 on a prostaglandin analog, 18 on a carbonic anhydrase inhibitor, and 7 eyes had glaucoma surgery. Future research should investigate the effects of these glaucoma interventions on retinal perfusion.
In conclusion, we found that superficial microcirculation in both macular and peripapillary regions were significantly reduced in glaucoma patients and that global peripapillary perfusion parameters had good diagnostic performance and outperformed global macular perfusion parameters. Additional research should optimize imaging algorithms in the peripapillary region and improve our understanding of other factors that may affect retinal perfusion.
Acknowledgments
Supported by grants from the National Institutes of Health (Grant 1K23EY027855-01, GMR; R01EY024158, RKW; K08EY027006, AHK), American Glaucoma Society Mentoring for Advancement of Physician Scientists Grant (GMR), an unrestricted grant to the USC Department of Ophthalmology from Research to Prevent Blindness, and Carl Zeiss Meditec (Dublin, CA; SD-OCTA device). We also wish to thank Anoush Shahidzadeh, MPH for her image acquisition support (USC Roski).
This work was previously presented at the American Academy of Ophthalmology Annual Meeting 2017.
Disclosure: G.M. Richter, SD-OCTA device provided by Zeiss (F); R. Chang, None; B. Situ, None; Z. Chu, None; B. Burkemper, None; A. Reznik, None; S. Bedrood, None; A.H. Kashani, None; R. Varma, None; R.K. Wang, None
References
- 1.Quigley HA, Broman AT. The number of people with glaucoma worldwide in 2010 and 2020. Br J Ophthalmol. 2006;90:262–267. doi: 10.1136/bjo.2005.081224. [DOI] [PMC free article] [PubMed] [Google Scholar]
- 2.Weinreb RN, Aung T, Medeiros FA. The pathophysiology and treatment of glaucoma: a review. JAMA. 2014;311:1901–1911. doi: 10.1001/jama.2014.3192. [DOI] [PMC free article] [PubMed] [Google Scholar]
- 3.Bussel II, Wollstein G, Schuman JS. OCT for glaucoma diagnosis, screening and detection of glaucoma progression. Br J Ophthalmol. 2014;98(suppl 2):ii15–ii19. doi: 10.1136/bjophthalmol-2013-304326. [DOI] [PMC free article] [PubMed] [Google Scholar]
- 4.Curcio CA, Allen KA. Topography of ganglion cells in human retina. J Comp Neurol. 1990;300:5–25. doi: 10.1002/cne.903000103. [DOI] [PubMed] [Google Scholar]
- 5.Hood DC, Raza AS, de Moraes CGV, et al. Glaucomatous damage of the macula. Prog Retin Eye Res. 2013;32C:1–21. doi: 10.1016/j.preteyeres.2012.08.003. [DOI] [PMC free article] [PubMed] [Google Scholar]
- 6.Leung CKS, Chan WM, Yung WH, et al. Comparison of macular and peripapillary measurements for the detection of glaucoma: an optical coherence tompgraphy study. Ophthalmology. 2205;112:391–400. doi: 10.1016/j.ophtha.2004.10.020. [DOI] [PubMed] [Google Scholar]
- 7.Garway-Heath DF, Lascaratos G, Bunce C, et al. The United Kingdom Glaucoma Treatment Study: a multicenter, randomized, placebo-controlled clinical trial: design and methodology. Ophthalmology. 2013;120:68–76. doi: 10.1016/j.ophtha.2012.07.028. [DOI] [PubMed] [Google Scholar]
- 8.Flammer J, Orgül S, Costa VP, et al. The impact of ocular blood flow in glaucoma. Prog Retin Eye Res. 2002;21:359–393. doi: 10.1016/s1350-9462(02)00008-3. [DOI] [PubMed] [Google Scholar]
- 9.Yarmohammadi A, Zangwill LM, Diniz-Filho A, et al. Relationship between optical coherence tomography angiography vessel density and severity of visual field loss in glaucoma. Ophthalmology. 2016;123:2498–2508. doi: 10.1016/j.ophtha.2016.08.041. [DOI] [PMC free article] [PubMed] [Google Scholar]
- 10.Hwang JC, Konduru R, Zhang X, et al. Relationship among visual field, blood flow, and neural structure measurements in glaucoma. Invest Ophthalmol Vis Sci. 2012;53:3020–3026. doi: 10.1167/iovs.11-8552. [DOI] [PMC free article] [PubMed] [Google Scholar]
- 11.Mohindroo C, Ichhpujani P, Kumar S. Current imaging modalities for assessing ocular blood flow in glaucoma. J Curr Glaucoma Pract. 2016;10:104–112. doi: 10.5005/jp-journals-10008-1210. [DOI] [PMC free article] [PubMed] [Google Scholar]
- 12.Chung HS, Harris A, Ciulla TA, et al. Progress in measurement of ocular blood flow and relevance to our understanding of glaucoma and age-related macular degeneration. Prog Retin Eye Res. 1999;18:669–687. doi: 10.1016/s1350-9462(98)00037-8. [DOI] [PubMed] [Google Scholar]
- 13.Manalastas PIC, Zangwill LM, Saunders LJ, et al. Reproducibility of optical coherence tomography angiography macular and optic nerve head vascular density in glaucoma and healthy eyes. J Glaucoma. 2017;26 doi: 10.1097/IJG.0000000000000768. [DOI] [PMC free article] [PubMed] [Google Scholar]
- 14.Chen CL, Bojikian KD, Xin C, et al. Repeatability and reproducibility of optic nerve head perfusion measurements using optical coherence tomography angiography. J Biomed Opt. 2016;21:065002. doi: 10.1117/1.JBO.21.6.065002. [DOI] [PMC free article] [PubMed] [Google Scholar]
- 15.Kashani AH, Chen CL, Gahm JK, et al. Optical coherence tomography angiography: a comprehensive review of current methods and clinical applications. Prog Retin Eye Res. 2017;60:66–100. doi: 10.1016/j.preteyeres.2017.07.002. [DOI] [PMC free article] [PubMed] [Google Scholar]
- 16.Jia Y, Wei E, Wang X, et al. Optical coherence tomography angiography of optic disc perfusion in glaucoma. Ophthalmology. 2014;121:1322–1332. doi: 10.1016/j.ophtha.2014.01.021. [DOI] [PMC free article] [PubMed] [Google Scholar]
- 17.Liu L, Jia Y, Takusagawa HL, et al. Optical coherence tomography angiography of the peripapillary retina in glaucoma. JAMA Ophthalmol. 2015;133:1045–1052. doi: 10.1001/jamaophthalmol.2015.2225. [DOI] [PMC free article] [PubMed] [Google Scholar]
- 18.Chen HSL, Liu CH, Wu WC, et al. Optical coherence tomography angiography of the superficial microvasculature in the macular and peripapillary areas in glaucomatous and healthy eyes. Invest Ophthalmol Vis Sci. 2017;58:3637–3645. doi: 10.1167/iovs.17-21846. [DOI] [PubMed] [Google Scholar]
- 19.Akil H, Chopra V, Al-Sheikh M, et al. Swept-source OCT angiography imaging of the macular capillary network in glaucoma. Br J Ophthalmol 2017] doi: 10.1136/bjophthalmol-2016-309816. https://doi.org/10.1136/bjophthalmol-2016-309816 [published online ahead of print August 7, . [DOI] [PubMed]
- 20.Xu H, Yu J, Kong X, et al. Macular microvasculature alterations in patients with primary open-angle glaucoma: a cross-sectional study. Medicine (Baltimore) 2016;95:e4341. doi: 10.1097/MD.0000000000004341. [DOI] [PMC free article] [PubMed] [Google Scholar]
- 21.Shoji T, Zangwill LM, Akagi T, et al. Progressive macula vessel density loss in primary open-angle glaucoma: a longitudinal study. Am J Ophthalmol. 2017;182:107–117. doi: 10.1016/j.ajo.2017.07.011. [DOI] [PMC free article] [PubMed] [Google Scholar]
- 22.Yarmohammadi A, Zangwill LM, Diniz-Filho A, et al. Optical coherence tomography angiography vessel density in healthy, glaucoma suspect, and glaucoma eyes. Invest Ophthalmol Vis Sci. 2016;57(9):OCT451–OCT459. doi: 10.1167/iovs.15-18944. [DOI] [PMC free article] [PubMed] [Google Scholar]
- 23.Akil H, Huang AS, Francis BA, et al. Retinal vessel density from optical coherence tomography angiography to differentiate early glaucoma, pre-perimetric glaucoma and normal eyes. PLoS One. 2017;12:e0170476. doi: 10.1371/journal.pone.0170476. [DOI] [PMC free article] [PubMed] [Google Scholar]
- 24.Park HY, Kim JW, Park CK. Choroidal microvasculature dropout is associated with progressive retinal nerve fiber layer thinning in glaucoma with disc hemorrhage. Ophthalmology. 2018;125:1003–1013. doi: 10.1016/j.ophtha.2018.01.016. [DOI] [PubMed] [Google Scholar]
- 25.Moghimi S, Zangwill LM, Penteado RC, et al. Macular and optic nerve head vessel density and progressive retinal nerve fiber layer loss in glaucoma. Ophthalmology. 2018;125:1720–1728. doi: 10.1016/j.ophtha.2018.05.006. [DOI] [PubMed] [Google Scholar]
- 26.Triolo G, Rabiolo A, Shemonski ND, et al. Optical coherence tomography angiography macular and peripapillary vessel perfusion density in healthy subjects, glaucoma suspects, and glaucoma patients. Invest Ophthalmol Vis Sci. 2017;58:5713–5722. doi: 10.1167/iovs.17-22865. [DOI] [PubMed] [Google Scholar]
- 27.Rao HL, Pradhan ZS, Weinreb RN, et al. Regional comparisons of optical coherence tomography angiography vessel density in primary open-angle glaucoma. Am J Ophthalmol. 2016;171(suppl C):75–83. doi: 10.1016/j.ajo.2016.08.030. [DOI] [PubMed] [Google Scholar]
- 28.Liu L, Jia Y, Takusagawa HL, et al. Optical coherence tomography angiography of the peripapillary retina in glaucoma. JAMA Ophthalmol. 2015;133:1045–1052. doi: 10.1001/jamaophthalmol.2015.2225. [DOI] [PMC free article] [PubMed] [Google Scholar]
- 29.Parekh AS, Tafreshi A, Dorairaj SK, et al. Clinical applicability of the International Classification of Disease and Related Health Problems (ICD-9) glaucoma staging codes to predict disease severity in patients with open-angle glaucoma. J Glaucoma. 2014;23:e18–e22. doi: 10.1097/IJG.0000000000000033. [DOI] [PubMed] [Google Scholar]
- 30.Chu Z, Lin J, Gao C, et al. Quantitative assessment of the retinal microvasculature using optical coherence tomography angiography. J Biomed Opt. 2016;21:066008. doi: 10.1117/1.JBO.21.6.066008. [DOI] [PMC free article] [PubMed] [Google Scholar]
- 31.DeLong ER, DeLong DM, Clarke-Pearson DL. Comparing the areas under two or more correlated receiver operating characteristic curves: a nonparametric approach. Biometrics. 1988;44:837–845. [PubMed] [Google Scholar]
- 32.Oddone F, Lucenteforte E, Michelessi M, et al. Macular versus retinal nerve fiber layer parameters for diagnosing manifest glaucoma: a systematic review of diagnostic accuracy studies. Ophthalmology. 2016;123:939–949. doi: 10.1016/j.ophtha.2015.12.041. [DOI] [PubMed] [Google Scholar]
- 33.Rao HL, Kadambi SV, Weinreb RN, et al. Diagnostic ability of peripapillary vessel density measurements of optical coherence tomography angiography in primary open-angle and angle-closure glaucoma. Br J Ophthalmol. 2017;101:1066. doi: 10.1136/bjophthalmol-2016-309377. [DOI] [PubMed] [Google Scholar]
- 34.Yarmohammadi A, Zangwill LM, Diniz-Filho A, et al. Peripapillary and macular vessel density in patients with glaucoma and single-hemifield visual field defect. Ophthalmology. 2017;124:709–719. doi: 10.1016/j.ophtha.2017.01.004. [DOI] [PMC free article] [PubMed] [Google Scholar]
- 35.Takusagawa HL, Liu L, Ma KN, et al. Projection-resolved optical coherence tomography angiography of macular retinal circulation in glaucoma. Ophthalmology. 2017;124:1589–1599. doi: 10.1016/j.ophtha.2017.06.002. [DOI] [PMC free article] [PubMed] [Google Scholar]
- 36.Chen CL, Zhang A, Bojikian KD, et al. Peripapillary retinal nerve fiber layer vascular microcirculation in glaucoma using optical coherence tomography-based microangiography. Invest Ophthalmol Vis Sci. 2016;57:OCT475–OCT485. doi: 10.1167/iovs.15-18909. [DOI] [PMC free article] [PubMed] [Google Scholar]
- 37.Choi WJ, Qin W, Chen C-L, et al. Characterizing relationship between optical microangiography signals and capillary flow using microfluidic channels. Biomed Opt Express. 2016;7:2709–2728. doi: 10.1364/BOE.7.002709. [DOI] [PMC free article] [PubMed] [Google Scholar]


