

Abstract
Background
To dissect the intricate workings of neural circuits, it is essential to gain precise control over subsets of neurons while retaining the ability to monitor larger-scale circuit dynamics. This requires the ability to both evoke and record neural activity simultaneously with high spatial and temporal resolution.
New Method
In this paper we present approaches that address this need by combining micro-electrocorticography (μECoG) with optogenetics in ways that avoid photovoltaic artifacts.
Results
We demonstrate that variations of this approach are broadly applicable across three commonly studied mammalian species—mouse, rat, and macaque monkey—and that the recorded μECoG signal shows complex spectral and spatio-temporal patterns in response to optical stimulation.
Comparison with existing methods
While optogenetics provides the ability to excite or inhibit neural subpopulations in a targeted fashion, large-scale recording of resulting neural activity remains challenging. Recent advances in optical physiology, such as genetically encoded Ca2+ indicators, are promising but currently do not allow simultaneous recordings from extended cortical areas due to limitations in optical imaging hardware.
Conclusions
We demonstrate techniques for the large-scale simultaneous interrogation of cortical circuits in three commonly used mammalian species.
1. Introduction:
Electrophysiological recordings have led to tremendous advances in our understanding of the neural basis of perception, cognition, and action. However, recording constitutes only part of a larger toolkit required to understand the normal or pathological brain in terms of the underlying neural circuit. Precise causal intervention is also indispensable, yet we lack tools for modulating specific neural populations while simultaneously monitoring effects across large areas of cortex. Here we describe a broadly applicable strategy for performing such interventions, using a combination of optogenetics and μECoG (Fig. 1a).
Figure 1.
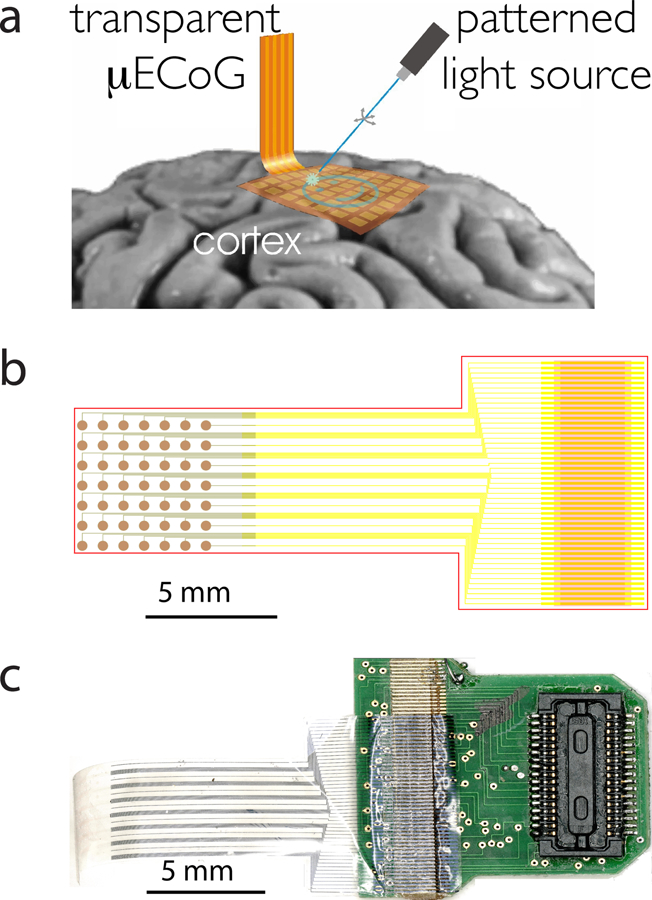
Integration of μECoG with optogenetics. a) Patterned light stimulation excites genetically modified neural tissue underneath a transparent μECoG array. Electrical activity recorded by the array could reveal the effects of stimulation, the characteristics of the underlying neural circuits or be feedback-coupled with the light source to achieve precise control of the activation states on the cortex. © [2011] IEEE. Reprinted, with permission, from conference proceedings (Ledochowitsch et al. 2011b). b) Computer-aided layout of the μECoG array: metal-traces are shown in yellow, ITO-traces and electrodes are shown in green, red indicates plasma-etched vias for the purpose of conductor exposure and device outline definition. c) Photograph of transparent μECoG ACF-bonded to PCB equipped with Zif-Clip® compatible Hirose connectors.
Techniques have been developed for both optical and electrical stimulation as well as optical and electrical recording of neural activity. Electrical stimulation allows for higher temporal resolution than optical methods, as the kinetics of genetically encoded proteins that act as signal transducers may low-pass-filter the light stimulus. However, electrical techniques are limited in spatial and cell-type selectivity. In addition, stimulation artifacts render simultaneous electrophysiological recording and electrical stimulation at the same site very difficult. In parallel, in recent years, optical interrogation of neural activity has made tremendous progress, although the off-kinetics of even the best available Ca2+ sensitive fluorescent proteins such as GCaMP6 (Chen et al. 2013) is too slow to resolve single action potentials in vivo. State-of-the-art tools for combined optogenetic stimulation and electrophysiological recordings, such as ‘optrodes’ (Gradinaru et al. 2007), are destructive to neural tissue and cover only a tiny fraction of the cortex with relatively few stimulation and recording sites. While some studies have attempted to reduce the tissue damage caused by optrode penetrations, reported success was limited to recordings from single sites (Ruiz et al. 2013). In addition, photovoltaic artifacts caused by optical stimulation can also interfere with simultaneous electrophysiology recordings.
Optogenetic stimulation combined with μECoG recording constitutes a versatile and adaptable approach with potential to provide insight into the physiological mechanism of cortical function, and can serve as a platform to develop new stimulation-based therapies for neurological disorders. In 2011, we introduced transparent arrays that consist of indium tin oxide (ITO) traces embedded in a transparent polymer (Parylene C) as a means of enabling optogenetic manipulation and recording from the surface of the brain (Ledochowitsch et al. 2011). Building on our work, Kwon et al. demonstrated 16-channel arrays (ITO traces in Parylene C) with embedded LEDs as a light delivery mechanism (Kwon et al. 2013) in rats. Optical windows in mice have been used in combination with 16-channel μECoG arrays comprising platinum traces embedded in Parylene C (Richner et al. 2014). Most recently, Park et al. used graphene-based transparent arrays for optogenetics applications in rodents (Park et al. 2014). Previous work on the combination of μECoG with optogenetics has mainly focused on engineering of the wafer-level devices and on the use of novel advanced materials. Most published studies either contain little biological data, typically limited to basic device testing in a rodent model (e.g. Park et al. 2014), or use conventional, small channel count μECoG (Richner et al. 2014).Moreover, many practical considerations such as the recognition and avoidance of photovoltaic artifacts, or modifications that meet the needs of different animal models, have not been sufficiently addressed. In this work, we emphasize the versatility of advanced, high-channel count μECoG in combination with optogenetics. Moreover, we show how to tailor experimental specifics to three different species, including non-human primate (NHP), a model in which the combination of μECoG with optogenetics is entirely novel.
We begin by detailing general strategies to avoid photovoltaic artifacts. The small size of rodent brains makes it difficult to confine light to transparent regions of the brain not covered by electrodes. We show that this issue can be solved by optical stimulation through fully transparent electrodes that are impervious to photovoltaic effects. The total area recordable with fully transparent electrodes is limited to approximately 1 cm2 due to the brittle nature of the transparent conductor used (ITO) (Ledochowitsch et al. 2011). This can be an issue, for example, for recordings from an entire hemisphere of a rat, and is a serious constraint for use in animal models with larger brains such as NHPs. However, we show that in animals with large cortical surfaces (NHP), the challenge of photovoltaic artifacts can be addressed by array design, without resorting to novel materials, simply by avoiding optical excitation of the electrode material.
Finally, we use transgenic mice to show that it is possible to capture complex and interesting effects of cell-type-specific optical stimulation in the form of spatially heterogonous changes to the spectral composition of cortical potentials with our approach.
2. Methods
2.1. Characterization of transparent, flexible microelectrode arrays
The computer-aided design (CAD) of the electrode and wiring layout is shown in Fig. 1b. Fig. 1c shows the fully assembled and bonded transparent μECoG array with 49 recording contacts.
The fabrication process for Parylene C-based μECoG with metal electrodes is similar to the fabrication of flexible cables for neural probes developed by Rodger et al. (2008), and has been reported elsewhere (Ledochowitsch et al. 2011a). The fabrication of transparent ITO electrodes on Parylene C, which we initially described in (Ledochowitsch et al. 2011b) was refined, and is partially reprinted with modifications in Appendix A, with permission, from © [2011] IEEE conference proceedings (Ledochowitsch et al. 2011).
2.1.1. Electrical characterization of ITO μECoG arrays
The sheet resistance of the ITO film sputtered on Parylene C was determined on-wafer using a VEECO FPP-5000 4-point-probe.
The electrode-electrolyte interface was characterized by electrochemical impedance spectroscopy (EIS using nanoZ, White Matter, LLC, frequency sweep: 5 Hz to 5 kHz).The recording sites formed the active electrode and silver wire formed the combined reference and counter electrodes. Artificial cerebrospinal fluid (aCSF; Artificial CSF Perfusion Fluid, Harvard Apparatus, ion concentrations in mM: [Na+] = 150; [K+] = 3.0; [Ca2+] = 1.4; [Mg2+] = 0.8; [PO43-] = 1.0; [Cl-] = 155) was used as the electrolyte.
2.1.2. Optical characterization of ITO μECoG arrays
The transmittance of μECoG ITO arrays was measured with the array mounted on a microscope slide using an ellipsometer/spectrometer (Sopra GESP) under normal incidence, with correction for the absorption of the carrier slide.
In order to access the presence and severity of the photovoltaic artifact under realistic experimental conditions, the μECoG was illuminated with a Ti:Sapphire Chameleon Ultra II laser (850nm, 100mW, 8Hz frame-rate, Coherent) using a commercial 2-photon microscope (Ultima, Prairie Technologies). Photovoltaic artifacts were recorded on a custom-built electrophysiology system comprising a unity gain buffer amplifier array (ZC-64, Tucker Davis Technologies), and a 64 channel single-ended amplifier (Gain of 500, 0.1–6 kHz, FA-I-64, Multichannel Systems) and digitized (16 bit resolution, 25 kS/ch, 16AISS64, General Standards).
2.2. In vivo testing of simultaneous optogenetic stimulation and μECoG recording
All procedures were approved by the University of California San Francisco Institutional Animal Care and Use Committee and followed NIH guidelines.
2.2.1. Rat stimulation/recording setup
One male Long-Evans rat, approximately 3 months of age, was used for this study. Three 1 µL injections of AAV1-hSyn-ChR2-YFP were made into the right motor cortex (M1) via a small craniotomy, using a constant-pressure infusion system (UMP3, World Precision Instrument; 700 series 30g Hamilton syringe). To prevent backflow, the injection needle was left in place for 5 min after each injection.
Stimulation and recording was performed in a terminal procedure three weeks post-injection. Anesthesia was maintained by an intravenous continuous-rate injection of sodium pentobarbital. A large craniotomy was made to allow placement of the transparent ITO-μECoG array (as shown in Fig. 1c) over the ChR2-expressing areas. After the array was implanted on the surface of the brain, an optical fiber (inner/outer diameter: 62.5/125 um, Fiber Systems) was placed above the transparent array. The optical fiber was connected to a 488 nm blue laser light (PhoxX 488–60, Omicron-Laserage). Power at the fiber tip was 23 mW. The stimulation consisted of 5 ms light pulses applied with different repetition rates (50 and 150 Hz) over the total of one second. The 1 s pulse train was repeated every five seconds providing 4 seconds of post-stimulus recording.
2.2.2. Non-human primate stimulation and recording setup
AAV5-CamKIIa-C1V1-EYFP viral vector was infused into both somatosensory (S1: 100 µL via two sites) and motor cortices (M1: 50 µL via a single site) of a male rhesus macaque monkey; for details see (Yazdan-Shahmorad et al. 2013a). Following infusion, a soft transparent artificial dura was implanted on top of the infusion sites to protect the brain and provide a window for monitoring the spread of expression (Diester et al., 2011, Ruiz et al., 2013). Eight weeks following injection, surface illumination revealed the presence of florescent reporter across large areas of S1 and M1.
Stimulation and recording were performed three months post injection while the animal was head-fixed sitting in a primate chair. Initially the animal was anesthetized with Ketamine-Dexmedetomidine. The artificial dura was removed and the 96-channel µECoG array was positioned on the surface of the brain. The sparse platinum electrode array (Fig. 4) covered C1V1 expressing areas of both S1 and M1. For high quality recordings, the stimulation and recording were initiated as the animal recovered from anesthesia. A blue laser (PhoxX 488–60, Omicron-Laserage) was used to stimulate C1V1 channels. The light was delivered via an optical fiber (inner/outer diameter: 62.5/125 um, Fiber Systems) that was placed over the array on top of the C1V1-expressing areas. Power at the fiber tip was 20 mW. The stimulation consisted of 1 ms light pulses at two different repetition rates (10 and 150 Hz) applied for a total of one second. As in 2.2.1, the 1 s pulse trains were alternated with 4 s recording blocks without light stimulation.
2.2.3. Mouse stimulation and recording setup
We performed an experiment in an anesthetized transgenic mouse expressing channel rhodopsin in parvalbumin positive inhibitory interneurons (Ai32/PV+-Cre mice). The mouse was anesthetized with ketamine-xylazine, provided with supplementary oxygen to reduce the risk of hypoxia and cerebral edema, thermostatically regulated, and monitored throughout the experiment. Once anesthetized and stereotaxically secured, a craniotomy was created over the right auditory cortex. Electrophysiological data were acquired at a sampling rate of approximately 11kHz via a multi-channel amplifier optically connected to a digital signal processor (Tucker-Davis Technologies [TDT], Alachua, FL).
The high-density platinum μECoG (Fig. 6a) was placed epidurally over the auditory cortex, and grounded to the animal’s temporalis muscle, which also served as the reference. Each contact on the grid had an impedance of approximately 15 kΩ (measured in physiological saline), and an exposed electrode diameter of 40 µm, with a 200 µm inter-electrode pitch.
White noise bursts (N = 60 bursts, 100ms, frequency content from 1–50 kHz) were played back through a DVD player (Sony), attached to a TDT amplifier and played through an electrostatic speaker placed near the left ear of the animal (80 dB SPL, A-scale).
We used an LED (105 μm inner diameter, 125μm outer diameter, 0.2 NA) to illuminate the cortical surface through a perforation located in the center of the μECoG grid (470 nm light, 70 mW). The light turned on 300 ms before each white-noise burst to allow steady-state activation of PV+ neurons to be achieved; illumination was extinguished at the offset of the sound.
2.3. Analysis of neural data
2.3.1. Analysis of rat and NHP data
Time-frequency spectral analysis on the μECoG recordings was performed using multitaper spectral methods (http://chronux.org). The μECoG spectrum was estimated on a 600 ms window with 5 Hz resolution using five Slepian data tapers. After calculating the spectrograms, they were z-scored to baseline as follows: a 500 ms window (−1000 to - 500 ms before the onset of stimulation) was defined as the baseline, the mean of the baseline was subtracted from the spectrograms, and the result divided by the standard deviation of baseline for each frequency component of the spectrogram. The z-scored spectrograms were then averaged across trials.
Maps of μECoG power were generated for high gamma (60–200 Hz) across the array. To generate these maps, the power of the signal in the high gamma frequency range was calculated for each electrode in the array for a 30 ms section following the onset of stimulation. The maps were generated by linear interpolation of the values recorded on adjacent electrodes.
The shielding and grounding of our recording system used for these experiments was sufficient that we did not see any significant 60 Hz noise in the μECoG recordings. However, in NHP we occasionally observed periods with increased overall noise levels across regions of a μECoG array, likely due to intermittently compromised tissue coupling as the electrolyte film between electrode and cortex began to dry out. Such data were removed before further analysis.
2.3.2. Analysis of mouse data
We calculated the amplitude of the entire recorded field potential time series for each channel from 3–1100 Hz using a constant-Q wavelet transform. The analytic amplitude for each frequency band was normalized relative to ‘baseline’ statistics (derived from the activity recorded from 400–600 ms after the onset of the sound) by z-scoring. The z-scored activity for each frequency band was then averaged across the 60 bursts. Auditory responses were calculated as the average z-scored activity in a ±10 ms window surrounding the first peak after the onset of the stimulus, detected for each recording channel individually.
3. Results
We fabricated and tested two distinct types of μECoG arrays: arrays of platinum electrodes encapsulated in Parylene C (Pt μECoG) (Fig. 4a), and arrays of transparent ITO electrodes encapsulated in Parylene C (ITO μECoG) (Fig. 1c). The Pt μECoG arrays were designed to be sparse to maximize unobstructed optical access to the underlying brain, and are suitable for larger animal models. As shown below, ITO μECoG are useful for smaller animal models (where space constraints make contiguous metal-free areas impractical) and provide complete optical access (even through the electrodes). Both types of electrodes allow optical access in the space between electrodes since Parylene C is transparent to visible and NIR light.
3.1. ITO μECoG records electrophysiological signals with minimal photovoltaic interference from illumination
3.1.1. ITO is transparent at relevant wavelengths
The transmittance, normalized with respect to the substrate, and averaged over the visible spectrum, was found to exceed 90% (Fig. 2a). This high level of transparency enabled us to optically access neural tissue located directly below ITO electrodes and interconnects using light sources located above the ITO μECoG array.
Figure 2.

Optoelectrical properties of transparent μECoG array. a) The transmittance of the ITO film deposited onto Parylene C averages over 90% across the entire visible spectrum. b) When scanned with a femtosecond laser, ITO electrodes do not show photovoltaic artifacts above the noise level, unlike metallic (gold tracks) portions of the device (control). c) The electrochemical impedance spectrum reveals that the nature of the ITO-electrode interface is mainly capacitive. The spectrum is fit by a Randles Cell model with impedance <1 MΩ at 1kHz, which is low enough to allow recording with commercially available electrophysiology amplifiers. © [2011] IEEE. Modified, with permission, from conference proceedings (Ledochowitsch et al. 2011b).
3.1.2. Minimal photovoltaic artifact is generated during stimulation
Unlike metals, where mobile electrons mediate electrical conductivity, conduction in ITO is mediated by oxygen vacancies (mobile ionic ‘holes’ within the lattice of ions). These carriers feature a large band-gap (2.6 – 3.65 eV, depending on material composition), which results both in the transparency of the material and in its insensitivity to photons in the visible and IR spectrum (since incoming photons at those wavelengths have less energy than the bandgap) (Mryasov & Freeman 2001). Illuminating metal (gold) traces (as control) resulted in large amplitude light-induced electrical artifacts while ITO electrodes show no such voltage transients when exposed to light (Fig. 2b).
3.1.3. Electrodes on the array have suitable impedances for electrophysiology
The sheet resistance of ITO on the array was determined using a VEECO FPP-5000 4-point-probe to be 43.7 Ω/☐. We measured the electrode-electrolyte interface impedance by EIS and fitted the data (χ2Red = 0.712, where χ2Red is the reduced chi-squared statistic (Andrae et al. 2010)) to a Randles Cell model (Randles 1947; Löffler et al. 2012): the MATLAB package Zfit (Dellis 2010) was used to estimate the line resistance Rs = 3.79 kΩ, charge transfer resistance Rp = 245 MΩ, and the constant phase element (CPE) parameters n = 0.858, P = 1.59 nFs−0.142 (Fig. 2c). Notably, the ITO electrode impedance measured at 1kHz was <1 MΩ, which is acceptable for low-noise electrophysiology. Most commercial systems, such as the TDT equipment used in our studies, require electrode impedances to be on the order of or below 1 MΩ at 1 kHz. The electrode impedance must be small compared to the amplifier’s input impedance to avoid measurable loss of spike amplitude loss due to voltage division. Additionally, low electrode resistance is desirable because thermal (Johnson-Nyquist) noise scales with the square root of the electrode resistance (Lempka et al. 2011).
3.2. . Strategies for avoiding photovoltaic artifacts in μECoG recordings due to simultaneous optical stimulation
We tested the combination of μECoG recordings with optogenetics stimulation in three different species with different configurations. We were able to show reliable light-modulated electrical recordings in all configurations.
3.2.1. Transparent ITO μECoG arrays allow simultaneous stimulation and full-area recording without optical artifact in rat cortex
We first tested our ability to perform optogenetics stimulation via surface illumination in a rat model, using the transparent ITO μECoG array (Fig. 3). Array placement and illuminated locations are indicated in Fig. 3a. Fig. 3b shows the band pass-filtered (60–200 Hz) evoked activity following each pulse for 500 repetitions. Fig 3c shows the same evoked activity on the time scale of the trial duration. In addition, the z-scored spectrograms of the recorded neural activity are shown in Fig. 3d. During 50 Hz stimulation we observed significant (p<0.001) changes in high gamma power, reflecting an increase in neural activity following the light stimulation (Fig. 3bcd left). To ensure that this effect was due to light-evoked neural activity, and not due to photovoltaic artifact, we compared the effect of 50 Hz pulse trains to that of 150 Hz pulse trains. We did not see a significant response (p>0.3) in the ECoG signal following 150 Hz stimulation (Fig. 3bcd right), as expected given that the off-kinetics of the ChR2 is approximately 18 ms (Yizhar et al. 2011).
Figure 3.
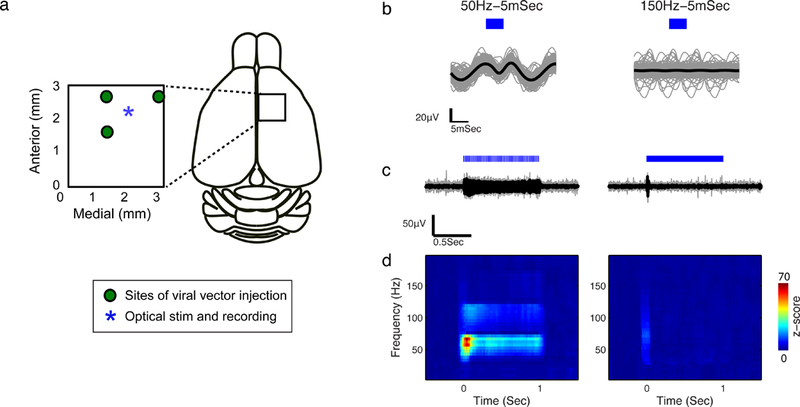
In vivo μECoG recording during optical stimulation in rat cortex. a) Location of viral vector injection, stimulation and recording sites. b) Filtered evoked activity (60–200Hz) following each 5 ms pulse; black line is the mean response; blue rectangle indicates the start and duration of laser stimulation pulses. The data shown in this figure are from 10 stimulation trials; in each trial a 1 s long pulse train was delivered via fiber optic, at either a 50 (left column) or a 150 Hz (right column) pulse repetition rate. c) Filtered evoked activity (60–200Hz) during each of the 1 s pulse trains; black line shows the average of 10 trials; blue lines indicate the stimulation pulses. d) Z-scored spectrograms of μECoG recordings averaged across the 10 trials.
3.2.2. Sparse μECoG allows recording with simultaneous light delivery via cranial window in non-human primate
In order to record large-scale activity in macaque cortex, we designed a 96-channel μECoG array with an area of 96 mm2 and maximized contiguous optically transparent area between recording electrodes (Fig. 4). The array was implanted over somatosensory (S1) and motor (M1) cortices of a rhesus macaque monkey.
Figure 4.

μECoG used in NHP model. a) Image of the 96-channel array. The large (400 μm × 600 μm) perforations are designed to allow viral injections and insertion of electrodes or optical fibers for intracortical stimulation and recording. b) μECoG covering primary motor (M1) and primary somatosensory (S1) cortices in NHP.
Here we validated the neural origin of the evoked responses by exploiting the opsin’s off-kinetics (34 ms in C1V1 per (Yizhar et al. 2011a)). Comparison between responses to 1ms pulses with repetition rates slower (10 Hz) and faster (150 Hz) than C1V1 off-kinetics are shown in Fig. 5a. Similar to responses obtained in the rat experiments (Fig. 3), we saw reliable synchronized responses to 10 Hz pulses (Fig. 5a, left), and a weaker, less-synchronized response to the 150 Hz pulse trains (Fig. 5a, right), with both responses localized in the high-gamma band (60–200 Hz; Fig. 5a, bottom row). Furthermore, for each of these stimuli, we calculated the delay between the onset of stimulation and the peak response, which occurred during the inter-pulse interval. The delay in peak response for 10 Hz was 3.51±0.84 ms (mean±std). The low-jitter delay showed the reliability of light-evoked activity at 10 Hz. In contrast, the delay was 4.14±3.39 ms for 150Hz stimulation; the larger jitter here is a numerical consequence of our inability to exactly detect the response timing due to the fact that 150 Hz stimulation does not reliably drive neural activity.
Figure 5.

In vivo μECoG recording during pulsed optical stimulation in NHP cortex compared with deliberately induced photovoltaic artifact. The data shown in this figure are from 50 stimulation trials; in each trial, a 1 s long pulse train was delivered via fiber optic, at either a 10 (left column of each panel) or a 150 Hz (right column of each panel) pulse repetition rate. a) Stimulation that evoked a neural responses; b) Stimulation directed at a platinum electrode, illustrating the photovoltaic artifact. First row: Filtered (60–200Hz) evoked activity in the time domain following single pulses of light (500 repetitions); black line is mean response; blue line indicates the start and duration of light pulses. Second row: Filtered (60–200Hz) evoked activity in the time domain for 1 s pulse trains (50 repetitions); black line is the mean response; blue lines indicate stimulation pulses. Third row: z-scored spectrograms of μECoG recordings averaged across all 50 trials. c) Spatial distribution of light evoked power in the high gamma band (average of 200 trials) across the μECoG array. The colormap represents average high gamma power evoked by trains of 1 ms pulses at 10 Hz for light-evoked neural responses (left panel) and light-induced artifact (right panel). The traces show the average time-domain response for each electrode. The locations of viral vector injection (white circles) and stimulation (white star) are marked on the maps. The black line indicates the central sulcus. Based on the result of our epi-fluorescent imaging (not shown), the opsin expressing areas in M1 and S1 span the whole extent of the μECoG array. A wide spatial distribution of cortical activity evoked by 10 Hz pulse trains is evident (left panel). Conversely, we see a more spatially confined distribution of signal of much larger power for light-induced artifact. Note the 50x difference in scale between the left and right panels.
We next compared these physiological responses to deliberate light-induced artifacts, obtained by directing stimulation at a single platinum electrode on the array, while it was in contact with the brain. The amplitude of the light-induced artifact is more than five times higher than the biological responses (compare with the responses shown in Fig. 5a), and these artifacts are highly reliable for both 10 Hz and 150 Hz stimulation (Fig. 5b): the response delay for the artifact was 2.27±0.37 ms and 2.27±0.19 ms for 10 Hz and 150 Hz pulses respectively. The comparatively short latency with very low jitter is consistent with artifacts of a non-biological origin.
μECoG in conjunction with optogenetics is particularly useful for the localization of neural sources (Richner et al. 2014). Here, we used μECoG to investigate the spatial distribution of light-evoked activity (Fig. 5c, left panel). We observed a diffuse spatial distribution of activity across the array, with a gradual and anisotropic decrease in the amplitude of the response as a function of distance from the stimulation site. This widespread physiological response can be contrasted with the concentrated localization and much larger power of a deliberately induced photovoltaic artifact (Fig. 5c, right panel). (Readers might note that the response in Fig. 5c left includes a region in anteriolateral S1 that overlaps with the site of the photovoltaic artifact in Fig. 5c right; this overlap appears to be coincidental, as the response in the left-hand panel does appear to be a physiological response in the extended network, as shown in supplementary Fig. 1.)
The spatial confinement indicates that the photovoltaic artifact is mostly limited to the immediate vicinity of the stimulated electrode, while opsin-mediated physiological response is more consistent with the presence of complex network activity. These results provide further evidence for the ability to distinguish physiological responses from artifact and more generally highlight the power of combining focal optical stimulation with spatially distributed μECoG recordings.
3.3. Cell-type specific manipulation of μECoG activity during sensory stimulation in a mouse
It has been proposed in (Pashaie et al. 2014) that μECoG in conjunction with optogenetics could be particularly powerful when a specific cell-type is selectively placed under optical control. To demonstrate this approach in practice, we performed an auditory experiment in an anesthetized Ai32/PV+-Cre transgenic mouse, where presentation of acoustic white noise was combined with optical stimulation of parvalbumin-positive interneurons only (specificity, which cannot be achieved with purely electrical microstimulation). We found that epidural Pt μECoG (Fig. 6a) was able to record robust, large amplitude auditory evoked potentials from the mouse auditory cortex. Fig. 6b shows the z-scored spectrum of neural responses aligned to the onset of the sound at two recording sites, and a diagram of the stimulus. White noise sound bursts were found to evoke short-latency auditory responses (Fig. 6b) at many sites, and the spectral structure of the response was non-monotonic across frequencies and heterogeneous across space (Fig. 6d, first column).
Figure 6.

Optogenetic stimulation of PV+ inhibitory interneurons combined with simultaneous epidural μECoG recordings over mouse auditory cortex. a) Photograph of the μECoG array over mouse auditory cortex with a fiber optic (traced by black arrow; arrowhead pointing at the tip) over a central perforation, b) Average spectrograms of neural potentials (z-scored relative to baseline) evoked by white noise playback at an electrode located directly under the fiber optic (top), and at an electrode 800 μm away (bottom). c) Same as in b), but with optical activation of PV+ inhibitory neurons. The evoked response at the site immediately under the fiber optic exhibited a reduction across most of the spectrum, while the response at the distal electrode exhibited a more complex spectral profile. (d-e) Effects of optical activation on auditory responses were heterogeneous across frequencies and electrodes. d) Spatial maps of neural activity at four frequency bands. The neural potentials for each electrode (z-scored relative to baseline) evoked by white-noise playback (first column), white noise combined with optical activation of PV+ inhibitory interneurons (second column), and the difference between the two (third column). Each row corresponds to distinct frequency bands. e) We quantified the effect of optical activation by taking the difference between auditory-evoked responses alone, and the auditory-evoked responses with optical stimulation at each electrode; the distribution of these responses is shown (black: average across electrodes; red: maximum value across electrodes; blue: minimum across electrodes).
We next paired the white-noise playback with optical stimulation by illuminating the cortical surface through a perforation located in the center of the μECoG grid (Fig. 6a). At an electrode close to the site of optical stimulation of PV+ inhibitory neurons, we found that white noise evoked auditory responses were greatly attenuated across the entire spectrum (compare the top panels between Figs. 6b and 6c). This likely reflects diminished auditory responses resulting from tonic activation of the PV+ inhibitory population (Li et al. 2013). In contrast, at an electrode 800 μm away from the site of optical stimulation of PV+ neurons, we found a complex, non-monotonic modulation of the response spectrum, with an apparent reduction in activity in the lower and very high-frequencies, but an increase in the high-gamma range (compare the bottom panels between Figs. 6b and 6c, and see Fig. 6d). On average, across all electrodes on the grid, we found that activating PV+ interneurons in the center of the grid resulted in broadband reduction of auditory evoked potentials (Fig. 6e, black line). However, this spatial average was composed of a complex combination of increases in activity at a few electrodes and decreases at other electrodes with different spectral signatures (Fig. 6d-e). While the detailed interpretation of spectro-spatio-temporal structure of stimulus evoked responses and their manipulation by optogenetic targeting of various cell types is outside the scope of this paper, our data clearly show the value of cell-type specific optogenetic intervention in conjunction with high-resolution μECoG recording.
4. Discussion
We introduced a large-scale neural interface combining optogenetics and μECoG array technologies in mouse, rat, and non-human primate. This interface is bi-directional in the sense that it allows both manipulation and observation of neural activity. Furthermore, it provides optical access to and neural recordings from a much larger cortical area (96 mm2 in NHPs, and 40 mm2 in rats (see Fig. 1c and Fig. 4a)) in comparison to penetrating electrodes arrays, which are either limited to the site of recoding (e.g. linear electrode arrays) or cover a small cortical area (e.g. 16 mm2 for Blackrock arrays). This interface constitutes a powerful tool that potentially allows for recordings from the surface of many cortical areas (Bosman et al. 2012; Bastos et al. 2014), and can provide real-time dynamic closed-loop stimulation on the basis of the brain state.
Tremendous progress has been made in recent years to achieve all-optical readout of neural activity through methods such as intrinsic imaging, fluorescence imaging of voltage/Ca2+ sensitive dyes, or genetically encoded proteins. Subcellular resolution has been achieved via multiphoton microscopy (Nikolenko et al. 2008), and meso-scale cortical areas (on the order of 25 mm2) have been imaged in wide-field mode (Homma et al. 2009). Single cell-resolved optical techniques have the tremendous advantage that there is little ambiguity as to which neuron is generating the signal. However, voltage-sensitive dyes can only be used in acute, terminal experiments, and their signal-to-noise ratio is limited (Chemla and Chavane 2010). Intrinsic imaging (Chen et al. 2005; Kalatsky et al. 2005) can be used to map receptive fields but lacks the temporal resolution required to capture neural dynamics. Ca2+-imaging using the newest transgenic lines expressing GCaMP6-derivatives, offers superb spatial resolution and signal-to-noise ratio but is still too slow to resolve high frequency neural dynamics (Chen et al. 2013). In summary, optical recording of neural activity constitute a powerful, and rapidly evolving set of techniques, which are complementary to large-scale electrophysiology.
4.1. Reducing artifacts in μECoG recordings during optical stimulation
Artifact-free recording during stimulation is critical for most applications, particularly those evaluating the effect of ongoing stimulation on neural activity.
The photoelectric effect requires illumination of the electrode with UV radiation (or equivalent multi-photon interaction) to overcome the electrode conductor’s work function. In the case of photovoltaic effect (i.e. Becquerel effect) on the other hand, charge carriers do not need to exit the conductor completely but are merely promoted into higher energy states present at the electrode-electrolyte interface (Honda 2004). Hence it is the photovoltaic effect that is problematic at the longer wavelengths typically encountered when electrophysiology is combined with optical interrogation of neural circuits.
As we show, this artifact can be minimized either by the use of large band-gap, degenerate semiconductors such as ITO, which is impervious to photovoltaics, or by simply avoiding the illumination of the conductor altogether through targeted array design, potentially in conjunction with careful light shielding and/or sophisticated light patterning. We note that after the initial submission of this manuscript, an alternative material, graphene, has been proposed by Park et al. as a transparent conductor for neural recordings from the cortical surface (Park et al. 2014). An in-depth comparison of the materials science differences between graphene and ITO with references is provided in Appendix A.3. To summarize: unlike ITO, graphene is not at all impervious to the photovoltaic effect so that its use adds mostly manufacturing complexity, and offers little practical advantage in the context of transparent μECoG.
4.1.2. Controlling for photovoltaic artifacts in μECoGs
In this paper, we have demonstrated several techniques to distinguish light-induced neural responses in the μECoG signal from photovoltaic artifacts at the electrode-electrolyte interface, and we review them further here. First, it is thought that high-gamma power in the μECoG signal reflects the firing rate or synchronization in the underlying neural population (Ray et al. 2008; Yazdan-Shahmorad et al. 2013). We observed a significant increase in high gamma activity recorded with μECoG arrays following optical stimulation of ChR2-expressing neurons in rat and C1V1-expressing neurons in NHP, both consistent physiological responses.
Second, we demonstrated that the limited frequency response of opsins (Yizhar et al. 2011a) can serve as a useful control to disambiguate light-induced artifacts from signals of neural origin. While low frequency stimulation produced reliable stimulus-evoked activity, the responses to high frequency stimulation were much smaller in amplitude and more variable, despite the fact the 150 Hz stimulation delivered 15 times greater total energy than the 10 Hz stimulation (Figs. 3 and 5). Response latency is also a useful measure in this context. It was shown previously that neurons are able to spike in response to pulsed light with average latencies of about 3 ms in NHPs (Diester et al. 2011; Ohayon et al. 2013). Here we observed similar 3.5 ms peak response latency for low frequency stimulation in NHP, with slower and more variable response latency for high frequency stimulation, which is consistent with evoked neural activity.
By comparison, for deliberately induced photovoltaic artifacts (Fig. 5b), light-triggered responses were much larger and of stereotypic shape, and occurred reliably, independently of stimulation frequency. The response latency was particularly diagnostic, with the photovoltaic artifacts exhibiting very short (approximately 2.2 ms) low-jitter latencies, which were independent of stimulation frequency. Finally, while the physiological response was widely distributed across cortex, the spatial distribution of light-induced artifact was limited to the site of stimulation and the adjacent recording sites (likely due to capacitive coupling between adjacent interconnects). Thus, multiple electrical signatures can be used to effectively distinguish light-induced neural responses from photovoltaic artifact.
4.2. Cell type specific optical activation during sensory stimulation
In addition to the ability to record neuronal responses evoked by optical stimulation, our results demonstrate μECoG recordings of auditory potentials evoked from the playback of white noise bursts, consistent with a recent report by Escabi et al. (2014). The spectral structure of some of the auditory evoked potentials was complex, with peaks at multiple disjoint frequencies. These recordings were acquired epidurally, demonstrating the ability to record sensory evoked responses from the mouse cortex without damaging the blood-brain barrier.
We used transgenic mouse models to target channel rhodopsin to a genetically identified neuronal population (in this case, PV+ inhibitory interneurons), and combined optical activation with sensory stimulation. In contrast to the negligible effects on baseline activity, we observed that optical activation of PV+ neurons could greatly modulate the auditory response evoked by playback of white noise bursts. The composition of these effects was heterogeneous across both space and frequency. The source of this heterogeneity is unclear, but likely reflects the fact that the 1.6 mm2 μECoG used here spans multiple auditory cortical areas in the mouse.
4.3. Outlook
4.3.1. Research Applications
The tools presented in this manuscript pave the path to studying circuits, systems and their connectivity across large cortical areas, as well as the effect of highly targeted intervention on large-scale cortical processing. For instance, using the proposed interface, a specific group of neurons can be silenced, and their role in the underlying neural networks investigated at the whole-brain scale. Alternatively, the circuit response to various stimulation parameters could be evaluated, revealing network characteristics that may help to understand the organization of each cortical region and their communications with the neighboring areas. Additionally, the compact form-factor of the devices enables monitoring and measuring behavioral and neural changes simultaneously to link behavior and perception to recorded neural activity.
4.3.2. Clinical Applications.
ECoG-based brain-machine interfaces (Ledochowitsch et al. 2013; Rouse et al. 2013) have considerable potential for neuroprosthetic and neurorehabilitation applications, in part because ECoG electrodes do not penetrate the cortical surface, thereby reducing the risk of brain tissue damage. It is well established in literature that the number and quality of single units recorded by penetrating microelectrodes decreases over time (Polikov et al. 2005). In contrast, to the best of our knowledge, no such long-term signal quality loss has been seen in the studies reporting chronic μECoG use (see examples below). While not many such studies have been published, there is good reason to think that these results will generalize. A considerable number of hypotheses have been put forward to explain unit loss with time: micromotion (Lee et al. 2005; Gilletti and Muthuswamy 2006), foreign-body immune response exacerbated by large object size (Thelin et al. 2011) or mechanical impedance mismatch (Nguyen et al. 2014), just to name a few. Since for flexible ECoG, many of these mechanisms are minimal or irrelevant, we expect less signal degradation over time. The Fries lab, for instance, was able to record stable μECoG signals from a chronically implanted NHP for over 8 months (Bosman et al. 2012; Bastos et al. 2014). We observed that not only has the signal not degraded, it has actually improved with time, as tissue grew predominantly above the array, apparently improving the electrical coupling at the electrode/tissue interface (Yazdan-Shahmorad et al. 2015). This observation is consistent with (Schendel et al. 2014) who reported a similar effect in chronically implanted rat μECoG. In addition, μECoG measures population activity (in contrast to unit spike data, which reflect single cell activity), which is commonly believed to offer a better prospect of long-term recording stability (Margalit et al. 2003; Henle et al. 2010; Flint et al. 2012, 2013).
A new flavor of truly bi-directional brain machine interfaces is emerging with the goal of providing somatosensory feedback for prosthetic devices using patterned intracortical microstimulation (ICMS) (Romo et al. 1998; Lebedev & Nicolelis 2006; Fitzsimmons et al. 2007; ODoherty et al. 2009). Delivering such feedback via more selective optical stimulation instead, monitored with μECoG recordings, would potentially provide a more therapeutic outcome with reduced side effects.
Supplementary Material
Highltghts.
We combined optogenetics with μECoG in mouse, rat, and macaque monkey.
Optical stimulation was targeted to inhibitory as well as to excitatory neurons.
Photovoltaic artifacts were clearly distinguishable from evoked neural activity.
Artifacts could be minimized using transparent indium tin oxide electrodes.
We discuss a broad palette of applications for μECoG combined with optogenetics
Acknowledgements
The authors thank the staff of the U.C. Berkeley Marvell Nanolab (http://nanolab.berkeley.edu/).
This work was supported by American Heart Association postdoctoral fellowship (AY), Defense Advanced Research Projects Agency (DARPA) Reorganization and Plasticity to Accelerate Injury Recovery (REPAIR; N66001–10-C-2010), and the UC Berkeley-UCSF Center for Neural Engineering and Prosthetics (CNEP) as well as by several grants from the NIH. We thank Quynh Anh Nguyen, Jon Levy and Alexander Jackson for testing the virus in cell culture, Jonathan Nassi and John Reynolds from the Salk Institute, John Bringas, Adrian Kells and Krystof Bankiewicz from UCSF for technical advice, Karen J. MacLeod, Juliana Milani and Blakely Andrews for their help with animal care, and Joseph O’Doherty and Josh Chartier for their help with the primate experiments.
Appendix A
A.1. ITO μECoG arrays microfabricated in a custom cleanroom process
Cross-sectional views for all major fabrication steps are represented in Fig. A.1. In the first step of the process a 3 μm thin layer of Parylene C (poly(para-chloro-xylylene) was deposited on a 4” silicon carrier wafer using a (Specialty Coating Systems) Parylene System Model 2010. Enclosing the wafer holder inside an ultra-fine stainless steel mesh (McNichols, square weave, stainless steel type 304, 325 mesh, 0.0014” Wire, 0.0017” opening) was key to avoiding particulate contamination during Parylene deposition.
Figure A1.

Wafer-level fabrication of μECoG array with transparent electrodes. a) Cross-sectional diagrams of the wafer-level fabrication flow: Parylene C (blue) was deposited onto a carrier wafer (black), followed by lift-off of overlapping metal (yellow) and ITO features (green), Parylene encapsulation, via etch through a thick photoresist mask (red), and release from the carrier wafer. b) Micrograph shows ITO electrodes, ITO leads, and the overlap-zone between metal and ITO. © [2011] IEEE. Reprinted, with permission, from conference proceedings (Ledochowitsch et al. 2011b).
The conductor was patterned in a bi-layer lift-off process. A 1.3 μm thick layer of G-line photoresist (OCG 825) was spin-coated at 5000 RPM onto the Parylene. The wafer was soft-baked at 90 °C for 60 s and flood-exposed (Karl Suss MA6 0.14 J/cm2). A layer of I-line photoresist (OiR 10i 1.1 μm thick) was then spin-coated at 4100 RPM and soft-baked at 90 °C. The wafer was exposed to broadband UV at a dose of 0.06 J/cm2 and developed in OPD 4262 for 60 s. A 20 s etch in oxygen plasma (80 sccm and 200 W RF power) was performed in a Plasma-Therm PK-12 RIE tool to de-scum the surface and improve adhesion for metal deposition. Fabrication of the hybrid devices required two separate deposition and lift-off steps: a stack of two metal layers (10 nm Cr / 100 nm Au) was e-beam evaporated. The metal was lifted-off by soaking in acetone for 10 min. After a second lithographic step, ITO was sputtered from an In2O3:SnO2 (10 wt% SnO2) target in Edwards Auto 306 DC and RF Sputter Coater in argon (Ar) at a pressure of 2.2 mTorr (base pressure: 4•10−5 Torr) and a DC power density of 1 W/cm2, yielding a 110 nm thick layer (sputter time: 33 min, deposition rate: 3.3 nm/min). Lift-off was performed followed by another de-scum etch, as described above. A thin adhesion layer of ϒ-MPS (ϒ-methacryloxypropyltrimethoxysilane) was deposited via AMST Molecular Vapor Deposition System MVD100 and covered by another 3 μm thick Parylene C layer. Vias and device outline were patterned in two separate photolithography steps followed by oxygen plasma etching (200 W, 73 mTorr, in Plasma-Therm PK-12 RIE; in 15 × 30 s intervals with 30 s cool-down periods). Finally, the devices were released from the silicon carrier wafer in a mild solution of detergent in deionized water. A micrograph of a portion of an electrode array just before release from the carrier water is shown in the micrograph in Fig. A1 b.
A.2. ITO μECoG arrays were packaged using anisotropic conductive film (ACF) bonding
A fan-out printed circuit board (PCB) with 3-mil-trace/space (PCB Pool) was used to connect a 1D array of ACF bonding pads (pad dimensions: 100 μm × 2500 μm, 200 μm pitch) to two surface-mount low-profile connectors (Hirose DF30FC-34DS-0.4V).
After lift-off from the carrier wafer, the devices were bonded to the PCB using an ACF thermo-compression process. ACF (3M 5552R, 2 mm wide) was pre-bonded to the corresponding PCB bond pad array using an Ohashi HBM-10 tabletop bonder equipped with a 2.5 mm wide bond head (1 s, 90 °C, 5 kg/cm2). Devices were aligned under a stereomicroscope via a custom alignment system comprising two vacuum chucks mounted on θxyz-micropositioners, and tacked to the ACF film with a soldering iron. The final thermo-compression was performed using the same bonder (Ohashi HBM-10; 20 s, 200 °C, 40 kg/cm2).
A.3. ITO and graphene: choosing transparent conductors for μECoG
Park et al. have recently reported the use of graphene as a transparent conductor for neural recordings from the cortical surface (Park et al. 2014). Graphene is a highly unusual and promising material for a number of applications (Geim and Novoselov 2007). In fact, at room temperature, graphene is the best electronic conductor known to man (Gibney 2014). Few-layer graphene has a very small (0–250 meV), electrically tunable bandgap (Zhang et al. 2009), and as such shows a pronounced photovoltaic effect. While Park et al. suggest that graphene features a more favorable trade-off between transparency and conductivity than non-annealed ITO, our results do not support the superiority of graphene as transparent conductor for μECoG. Specifically, with a single layer of ITO, sputtered in a commercial machine, and easily patterned by lift-off, we achieved a sheet resistance of 43.7 Ω/☐at an average transmittance of more than 90% across the entire visible spectrum. By comparison, Park et al. patterned 4 layers of graphene in a complex wet process to achieve a sheet resistance that is almost twice as high (76 Ω/☐) at a comparable level of transmittance. Keplinger et al. (2013) also support the notion that ITO features a more favorable trade-off between transparency and conductivity than graphene. The discrepancy between our results and those reported by Park et al. may stem from differences in the surface morphology of the ITO: Park et al. deposited ITO onto PET while we patterned directly onto Parylene C. We note that graphene does indeed maintain higher UV-transmittance than ITO, but there are currently no known specifically UV-sensitive channels (Hegemann and Möglich 2011) to take advantage of this feature. For our application of interest, we see only one clear advantage of graphene over ITO: graphene films of are much less brittle. However, since our hybrid metal-ITO concept allows fabrication of μECoGs that are appropriate for rodents, and for animals with larger brains illumination of tracks can be actively avoided, we conclude overall that substitution of graphene for ITO adds mostly manufacturing complexity, and offers little practical advantage.
Footnotes
Publisher's Disclaimer: This is a PDF file of an unedited manuscript that has been accepted for publication. As a service to our customers we are providing this early version of the manuscript. The manuscript will undergo copyediting, typesetting, and review of the resulting proof before it is published in its final citable form. Please note that during the production process errors may be discovered which could affect the content, and all legal disclaimers that apply to the journal pertain.
References
- Andrae R, Schulze-Hartung T & Melchior P Dos and donʼts of reduced chi-squared 12 (2010), http://arxiv.org/abs/1012.3754 [Google Scholar]
- Bastos AM, Vezoli J, Bosman CA, Schoffelen J-M, Oostenveld R, Dowdall JR, et al. Visual Areas Exert Feedforward and Feedback Influences through Distinct Frequency Channels. Neuron 2014. December;85(2):390–401. [DOI] [PubMed] [Google Scholar]
- Bosman CA, Schoffelen J-M, Brunet N, Oostenveld R, Bastos AM, Womelsdorf T, et al. Attentional stimulus selection through selective synchronization between monkey visual areas. Neuron 2012. September 6;75(5):875–88. [DOI] [PMC free article] [PubMed] [Google Scholar]
- Chemla S, Chavane F. Voltage-sensitive dye imaging: Technique review and models. J Physiol Paris 2010. January;104(1–2):40–50. [DOI] [PubMed] [Google Scholar]
- Chen LM, Friedman RM, Roe AW. Optical imaging of SI topography in anesthetized and awake squirrel monkeys. J Neurosci 2005/08/19 ed. 2005;25(33):7648–59. [DOI] [PMC free article] [PubMed] [Google Scholar]
- Chen T-W, Wardill TJ, Sun Y, Pulver SR, Renninger SL, Baohan A, et al. Ultrasensitive fluorescent proteins for imaging neuronal activity. Nature 2013. July 18;499(7458):295–300. [DOI] [PMC free article] [PubMed] [Google Scholar]
- Crone NE, Sinai A, Korzeniewska A. High-frequency gamma oscillations and human brain mapping with electrocorticography. Prog Brain Res 2006/10/31 ed. 2006;159:275–95. [DOI] [PubMed] [Google Scholar]
- Dellis J-L. Zfit [Internet]. 2010. Available from: http://www.mathworks.com/matlabcentral/fileexchange/19460-zfit
- Diester I, Kaufman MT, Mogri M, Pashaie R, Goo W, Yizhar O, et al. An optogenetic toolbox designed for primates. Nat Neurosci 2011/02/01 ed. 2011;14(3):387–97. [DOI] [PMC free article] [PubMed] [Google Scholar]
- Escabi MA, Read HL, Viventi J, Kim D-H, Higgins NC, Storace D, et al. A high-density, high-channel count, multiplexed µECoG array for auditory-cortex recordings. J Neurophysiol 2014. June 11;112(6):1566–83. [DOI] [PMC free article] [PubMed] [Google Scholar]
- Fitzsimmons NA, Drake W, Hanson TL, Lebedev MA, Nicolelis MA. Primate reaching cued by multichannel spatiotemporal cortical microstimulation. J Neurosci 2007/05/25 ed. 2007;27(21):5593–602. [DOI] [PMC free article] [PubMed] [Google Scholar]
- Flint RD, Lindberg EW, Jordan LR, Miller LE, Slutzky MW. Accurate decoding of reaching movements from field potentials in the absence of spikes. J Neural Eng 2012. August;9(4):046006. [DOI] [PMC free article] [PubMed] [Google Scholar]
- Flint RD, Wright ZA, Scheid MR, Slutzky MW. Long term, stable brain machine interface performance using local field potentials and multiunit spikes. J Neural Eng 2013. October;10(5):056005. [DOI] [PMC free article] [PubMed] [Google Scholar]
- Geim AK, Novoselov KS. The rise of graphene. Nat Mater 2007. March;6(3):183–91. [DOI] [PubMed] [Google Scholar]
- Gibney E Graphene conducts electricity ten times better than expected. Nature 2014. February 6;2–4. [Google Scholar]
- Gilletti A, Muthuswamy J. Brain micromotion around implants in the rodent somatosensory cortex. J Neural Eng 2006. September 1;3(3):189–95. [DOI] [PubMed] [Google Scholar]
- Gradinaru V, Thompson KR, Zhang F, Mogri M, Kay K, Schneider MB, et al. Targeting and readout strategies for fast optical neural control in vitro and in vivo. J Neurosci 2007. December;27(52):14231–8. [DOI] [PMC free article] [PubMed] [Google Scholar]
- Hegemann P, Möglich A. Channelrhodopsin engineering and exploration of new optogenetic tools. Nat Methods Nature Publishing Group, a division of Macmillan Publishers Limited. All Rights Reserved.; 2011. January;8(1):39–42. [DOI] [PubMed] [Google Scholar]
- Henle C, Raab M, Cordeiro JG, Doostkam S, Schulze-Bonhage A, Stieglitz T, et al. First long term in vivo study on subdurally implanted Micro-ECoG electrodes, manufactured with a novel laser technology. Biomed Microdevices 2010. September 14;13(1):59–68. [DOI] [PubMed] [Google Scholar]
- Homma R, Baker BJ, Jin L, Garaschuk O, Konnerth A, Cohen LB, et al. Wide-field and two-photon imaging of brain activity with voltage- and calcium-sensitive dyes. Methods Mol Biol 2009. January;489:43–79. [DOI] [PubMed] [Google Scholar]
- Honda K Dawn of the evolution of photoelectrochemistry. J. Photochem. Photobiol. A Chem 2004. p. 63–8. [Google Scholar]
- Kalatsky VA, Polley DB, Merzenich MM, Schreiner CE, Stryker MP. Fine functional organization of auditory cortex revealed by Fourier optical imaging. Proc Natl Acad Sci U S A 2005;102:13325–30. [DOI] [PMC free article] [PubMed] [Google Scholar]
- Keplinger C, Sun J-Y, Foo CC, Rothemund P, Whitesides GM, Suo Z. Stretchable, transparent, ionic conductors. Science 2013. August 30;341(6149):984–7. [DOI] [PubMed] [Google Scholar]
- Kwon KY, Sirowatka B, Weber A, Li W. Opto- μECoG Array: A Hybrid Neural Interface With Transparent μECoG Electrode Array and Integrated LEDs for Optogenetics. IEEE Trans Biomed Circuits Syst 2013. October;7(5):593–600. [DOI] [PubMed] [Google Scholar]
- Lebedev MA, Nicolelis MA. Brain-machine interfaces: past, present and future. Trends Neurosci 2006/07/25 ed. 2006;29(9):536–46. [DOI] [PubMed] [Google Scholar]
- Ledochowitsch P, Félus RJ, Gibboni RR, Miyakawa A, Bao A, Maharbiz MM. Fabrication and Testing of a Large Area, High Density Parylene MEMS μECoG Array. MEMS ‘11. 2011a. [Google Scholar]
- Ledochowitsch P, Koralek AC, Moses D, Carmena JM, Maharbiz MM. Sub-mm functional decoupling of electrocortical signals through closed-loop BMI learning. Conf Proc IEEE Eng Med Biol Soc 2013. January;2013:5622–5. [DOI] [PubMed] [Google Scholar]
- Ledochowitsch P, Olivero E, Blanche T, Maharbiz MM. A transparent muECoG array for simultaneous recording and optogenetic stimulation. Conf Proc IEEE Eng Med Biol Soc 2012/01/19 ed. 2011b;2011:2937–40. [DOI] [PubMed] [Google Scholar]
- Lee H, Bellamkonda R V, Sun W, Levenston ME. Biomechanical analysis of silicon microelectrode-induced strain in the brain. J Neural Eng 2005. December;2(4):81–9. [DOI] [PubMed] [Google Scholar]
- Lempka SF, Johnson MD, Moffitt MA, Otto KJ, Kipke DR, McIntyre CC. Theoretical analysis of intracortical microelectrode recordings. J Neural Eng 2011. August;8(4):045006. [DOI] [PMC free article] [PubMed] [Google Scholar]
- Li L, Li Y, Zhou M, Tao HW, Zhang LI. Intracortical multiplication of thalamocortical signals in mouse auditory cortex. Nat Neurosci Nature Publishing Group, a division of Macmillan Publishers Limited. All Rights Reserved.; 2013. September;16(9):1179–81. [DOI] [PMC free article] [PubMed] [Google Scholar]
- Löffler S, Xie Y, Klimach P, Richter A, Detemple P, Stieglitz T, et al. Long term in vivo stability and frequency response of polyimide based flexible array probes. Biomed Tech (Berl) 2012. September 6; [Google Scholar]
- Margalit E, Weiland JD, Clatterbuck RE, Fujii GY, Maia M, Tameesh M, et al. Visual and electrical evoked response recorded from subdural electrodes implanted above the visual cortex in normal dogs under two methods of anesthesia. J Neurosci Methods 2003. March 15;123(2):129–37. [DOI] [PubMed] [Google Scholar]
- Nguyen JK, Park DJ, Skousen JL, Hess-Dunning AE, Tyler DJ, Rowan SJ, et al. Mechanically-compliant intracortical implants reduce the neuroinflammatory response. J Neural Eng 2014. October;11(5):056014. [DOI] [PMC free article] [PubMed] [Google Scholar]
- Nikolenko V, Watson BO, Araya R, Woodruff A, Peterka DS, Yuste R. SLM Microscopy: Scanless Two-Photon Imaging and Photostimulation with Spatial Light Modulators. Front Neural Circuits 2008. January;2:5. [DOI] [PMC free article] [PubMed] [Google Scholar]
- ODoherty JE, Lebedev MA, Hanson TL, Fitzsimmons NA, Nicolelis MAL. A brain-machine interface instructed by direct intracortical microstimulation. Front Integr Neurosci. Frontiers Research Foundation; 2009;3(September):1–10. [DOI] [PMC free article] [PubMed] [Google Scholar]
- Ohayon S, Grimaldi P, Schweers N, Tsao DY. Saccade modulation by optical and electrical stimulation in the macaque frontal eye field. J Neurosci 2013/10/18 ed. 2013;33(42):16684–97. [DOI] [PMC free article] [PubMed] [Google Scholar]
- Park D-W, Schendel AA, Mikael S, Brodnick SK, Richner TJ, Ness JP, et al. Graphene-based carbon-layered electrode array technology for neural imaging and optogenetic applications. Nat Commun Nature Publishing Group; 2014. January 20;5:5258. [DOI] [PMC free article] [PubMed] [Google Scholar]
- Pashaie R, Anikeeva P, Lee JH, Prakash R, Yizhar O, Prigge M, et al. Optogenetic brain interfaces. IEEE Rev Biomed Eng. IEEE; 2014. January;7:3–30. [DOI] [PubMed] [Google Scholar]
- Polikov VS, Tresco PA, Reichert WM. Response of brain tissue to chronically implanted neural electrodes. J Neurosci Methods 2005. October;148(1):1–18. [DOI] [PubMed] [Google Scholar]
- Randles JEB. Kinetics of rapid electrode reactions. Discuss Faraday Soc. The Royal Society of Chemistry; 1947. January 1;1:11. [Google Scholar]
- Ray S, Crone NE, Niebur E, Franaszczuk PJ, Hsiao SS. Neural correlates of high-gamma oscillations (60–200 Hz) in macaque local field potentials and their potential implications in electrocorticography. J Neurosci. 2008/11/07 ed. 2008;28(45):11526–36. [DOI] [PMC free article] [PubMed] [Google Scholar]
- Richner TJ, Thongpang S, Brodnick SK, Schendel AA, Falk RW, Krugner-Higby LA, et al. Optogenetic micro-electrocorticography for modulating and localizing cerebral cortex activity. J Neural Eng IOP Publishing; 2014. February 1;11(1):016010. [DOI] [PMC free article] [PubMed] [Google Scholar]
- Rodger D, Fong A, LI W, Ameri H, Ahuja A, Guttierez C, et al. Flexible parylene-based multielectrode array technology for high-density neural stimulation and recording. Sensors Actuators B Chem 2008. June 16;132(2):449–60. [Google Scholar]
- Romo R, Hernandez A, Zainos A, Salinas E. Somatosensory discrimination based on cortical microstimulation. Nature 1998/04/16 ed. 1998;392(6674):387–90. [DOI] [PubMed] [Google Scholar]
- Rouse AG, Williams JJ, Wheeler JJ, Moran DW. Cortical adaptation to a chronic micro-electrocorticographic brain computer interface. J Neurosci 2013. January 23;33(4):1326–30. [DOI] [PMC free article] [PubMed] [Google Scholar]
- Ruiz O, Lustig BR, Nassi JJ, Cetin A, Reynolds JH, Albright TD, et al. Optogenetics through windows on the brain in the nonhuman primate. J Neurophysiol 2013. September;110(6):1455–67. [DOI] [PMC free article] [PubMed] [Google Scholar]
- Schendel AA, Nonte MW, Vokoun C, Richner TJ, Brodnick SK, Atry F, et al. The effect of micro-ECoG substrate footprint on the meningeal tissue response. J Neural Eng IOP Publishing; 2014. August 1;11(4):046011. [DOI] [PMC free article] [PubMed] [Google Scholar]
- Thelin J, Jörntell H, Psouni E, Garwicz M, Schouenborg J, Danielsen N, et al. Implant Size and Fixation Mode Strongly Influence Tissue Reactions in the CNS. Sugihara I, editor. PLoS One 2011. January 26;6(1):e16267. [DOI] [PMC free article] [PubMed] [Google Scholar]
- Yazdan-Shahmorad A, Diaz-Botia C, Hanson T, Ledochowitsch P, Maharabiz MM, Sabes PN. Demonstration of a setup for chronic optogenetic stimulation and recording across cortical areas in non-human primates. SPIE BIOS San Francisco, California, USA; 2015. p. Feb 7–12. [Google Scholar]
- Yazdan-Shahmorad A, Hanson T, Tian N, He J, Sabes P. A novel technique for infusion of optogenetics viral vectors in nonhuman primates (NHPs) cortex using MR-guided convection enhanced delivery (CED). 6th Int IEEE EMBS Conf Neural Eng. San Diego; 2013a. p. Nov 5–8. [Google Scholar]
- Yazdan-Shahmorad A, Kipke DR, Lehmkuhle MJ. High gamma power in ECoG reflects cortical electrical stimulation effects on unit activity in layers V/VI. J Neural Eng 2013/10/09 ed. 2013b;10(6):66002. [DOI] [PMC free article] [PubMed] [Google Scholar]
- Yizhar O, Fenno LE, Davidson TJ, Mogri M, Deisseroth K. Optogenetics in neural systems. Neuron 2011. July 14;71(1):9–34. [DOI] [PubMed] [Google Scholar]
- Zhang Y, Tang T-T, Girit C, Hao Z, Martin MC, Zettl A, et al. Direct observation of a widely tunable bandgap in bilayer graphene. Nature Macmillan Publishers Limited. All rights reserved; 2009. June 11;459(7248):820–3. [DOI] [PubMed] [Google Scholar]
Associated Data
This section collects any data citations, data availability statements, or supplementary materials included in this article.