

ABSTRACT
Multifunctional SND1 (staphylococcal nuclease and tudor domain containing 1) protein is reportedly associated with different types of RNA molecules, including mRNA, miRNA, pre-miRNA, and dsRNA. SND1 has been implicated in a number of biological processes in eukaryotic cells, including cell cycle, DNA damage repair, proliferation, and apoptosis. However, the specific molecular mechanism regarding the anti-apoptotic role of SND1 in mammalian cells remains largely elusive. In this study, the analysis of the online HPA (human protein atlas) and TCGA (the cancer genome atlas) databases showed the significantly high expression of SND1 in liver cancer patients. We found that the downregulation or complete depletion of SND1 enhanced the apoptosis levels of HepG2 and SMMC-7721 cells upon stimulation with 5-Fu (5-fluorouracil), a chemotherapeutic drug for HCC (hepatocellular carcinoma). SND1 affected the 5-Fu-induced apoptosis levels of HCC cells by modulating the expression of UCA1 (urothelial cancer associated 1), which is a lncRNA (long non-coding RNA). Moreover, MYB (MYB proto-oncogene, transcription factor) may be involved in the regulation of SND1 in UCA1 expression. In summary, our study identified SND1 as an anti-apoptotic factor in hepatocellular carcinoma cells via the modulation of lncRNA UCA1, which sheds new light on the relationship between SND1 protein and lncRNA.
KEYWORDS: SND1, UCA1, apoptosis, hepatocellular carcinoma, MYB
Introduction
Human SND1 (staphylococcal nuclease and tudor domain containing 1), also called p100, Tudor-SN (Tudor staphylococcal nuclease), or TDRD11 (Tudor domain-containing protein 11), is a highly conserved protein found in eukaryotic cells [1]. The SND1 protein comprises an N-terminal SN (1 ~ 4) region with a tandem repeat of staphylococcal nucleases-like domains and a C-terminal TSN region with Tudor and SN5 domains [2–4]. As a multifunctional regulator, SND1 protein is implicated in a wide variety of cellular biological processes, including gene transcription, pre-mRNA splicing, cell cycle, DNA damage repair, proliferation, programmed cell death degradome, adipogenesis, and carcinogenesis [5–11].
The SND1 protein has been reported to be related to certain RNA molecules (e.g., mRNA, miRNA, and pre-miRNA) and several clinical cancers, including breast cancer, prostate cancer, and liver cancer [1,4]. It was previously reported that up-regulation of SND1 and metadherin (MTDH) increased RNA-induced silencing complex (RISC) activity and participated in the development of hepatocellular carcinoma (HCC) [12]. SND1 protein was also found to promote HCC tumorigenesis by inhibiting monoglyceride lipase (MGLL) [13]. Additionally, SND1 protein activated NF-κB and promoted the angiogenesis of HCC through miR-221 [14]. At the same time, the expression of SND1 protein in HCC cells was reported to be up-regulated under conditions of endoplasmic reticulum stress [15]. Despite this, the mechanism regarding the effect of SND1 in cellular apoptosis of HCC remains largely unclear. Previously, we reported that SND1 promoted the metastasis and proliferation of breast cancer cells by down-regulating miR-127 expression [16]. Herein, we are interested in investigating the potential molecular mechanism underlying the role of SND1-long non-coding RNA (lncRNA) association in the HCC apoptosis mediated by chemotherapy drugs.
In the present study, we provide evidence regarding the relationship between SND1 and lncRNA UCA1 (urothelial cancer associated 1), which is also involved in the anti-apoptotic mechanism of SND1 protein in the 5-Fu -induced apoptosis of HCC cells.
Results
SND1 expression and basic clinicopathological features of liver cancer patients in online datasets
Based on the enrolled liver cancer patients found in online datasets, we investigated the expression level of SND1 and its clinical significance. We observed a high expression of SND1 protein in HCC tissue samples, compared with normal liver tissue, from the immunohistochemistry analysis data on the HPA database (Figure 1(a)). The volcano plot results available on the online TCGA database also showed that the SND1 gene was significantly over-expressed (Figure 1(b)). We downloaded and processed the expression and clinical information data of 377 liver cancer patients within the TCGA-LIHC project. Six patients were excluded because of the lack of SND1 expression data. In the remaining 371 liver cancer patients, 50 patients contained the SND1 expression data in the tumor and adjacent non-tumor tissues. The significant difference between the two groups (Figure 1(c), P < 0.001) was detected by an independent-sample Student’s t-test. Similar positive result (Figure 1(d), P < 0.001) was observed, when comparing the non-tumor tissues (n = 50) and all tumor tissues in TCGA-LIHC (n = 371).
Figure 1.
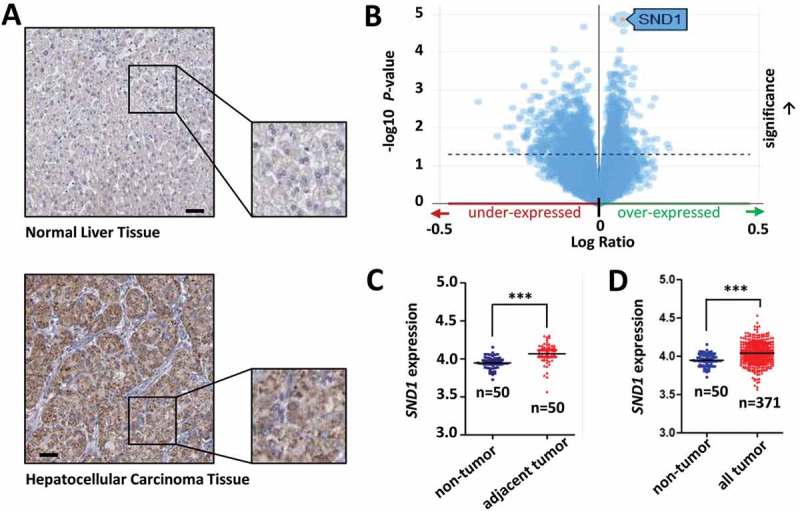
Expression of SND1 in the liver cancer patients from online datasets. (a) Immunohistochemistry analysis data for SND1 expression in normal liver tissue and hepatocellular carcinoma tissue from the HPA database. Bar value, 50 μm. (b) Volcano plot of SND1 expression in liver cancer patients from the TCGA project. (c) SND1 expression level in non-tumor (number, n = 50) and adjacent tumor tissues (n = 50) from liver cancer patients from the TCGA database. (d) SND1 expression level in non-tumor (n = 50) and all tumor tissues (n = 371) of liver cancer patients from the TCGA database. An independent-sample Student’s t-test was performed and significant differences were indicated: *** P < 0.001.
The 371 patients were divided into high-expression and low-expression groups. Then, we performed a Chi-square (χ2) test to investigate the correlation between SND1 expression and the basic clinicopathological features. As shown in Supplementary Table 1, we found no positive correlation (all P > 0.05) between SND1 expression and the basic characteristics of liver cancer patients, including gender, age, race, and ethnicity. We also performed univariate/multivariate Cox regression and Log-rank tests to analyze the difference in the overall survival curve of liver cancer patients between SND1 high-expression and low-expression groups. The results of univariate/multivariate Cox regression suggested that the SND1 expression status did not statistically affect the overall survival rate of liver cancer patients (Supplementary Table 2, P = 0.284 for univariate Cox regression; P = 0.355 for multivariate Cox regression). Furthermore, we performed a series of Kaplan-Meier survival curve analyzes, stratified by age, ethnicity, gender, and race (Supplementary Figure 1, all P value in Log-rank test > 0.05). We failed to observe a positive correlation between SND1 expression and the neoplasm histologic grade (G1 ~ 4), pathologic T (T1, T2, T3, T4, TX)/M (M0, M1, MX)/N (N0, N1, NX) stages and pathologic stage (I~ IV) (Supplementary Figure 2(a-c), all P > 0.05). Negative results were also obtained in the Kaplan-Meier survival curve analyzes that followed (Supplementary Figure 2(e-f), all P > 0.05), only apart from the MX (Supplementary Figure 2(e), P < 0.001) and NX (Supplementary Figure 2(e), P = 0.018) stages. Based on the available information from the HPA and TCGA datasets, our results suggest that SND1 is indeed highly expressed in tumor tissue, compared with normal tissue. However, the degree of high expression of SND1 does not seem to be closely related to the basic and clinicopathological features of liver cancer patients, and still needs support from more updated clinical evidence.
SND1 affects the 5-Fu-induced apoptosis level of HCC cells
Previously, we identified SND1 as a stress granule (SG)-specific protein that regulates the aggregation dynamics of SG under heat shock or oxidative stress conditions [10,17]. Very recently, we also reported that SND1 acts as a novel regulator of a DNA damage response (DDR) and is important for cell survival during DNA-damaging stress [11]. Given the function link of SND1 with stress, SND1 may be involved in the regulation of radiotherapy or chemotherapy efficacy. Nevertheless, during our TCGA database analysis, we failed to extract enough data on the drug, ablation, or radiation therapies for effective statistical analysis (data not shown).
The apoptosis of HCC cells is involved in the mechanisms of chemotherapy [18]. Herein, for the first time, we focused on the potential role of SND1 expression in the apoptosis level of HCC cells in response to 5-Fu, a chemotherapeutic drug for HCC. We constructed the HepG2 cell lines with a knockdown of the SND1 gene (shSND1-#1 and shSND1-#2) and SMMC-7721-SND1-KO (knockout) cell lines. As shown in Figure 2(a), the expression of endogenous SND1 was significantly reduced in HepG2 cells, compared to the sh-Vector control, but had no effect on the abundance of β-actin. SND1 expression was also completely depleted in the SMMC-7721-SND1-KO cells, but not in SMMC-7721-SND1-WT cells (Figure 2(a)).
Figure 2.
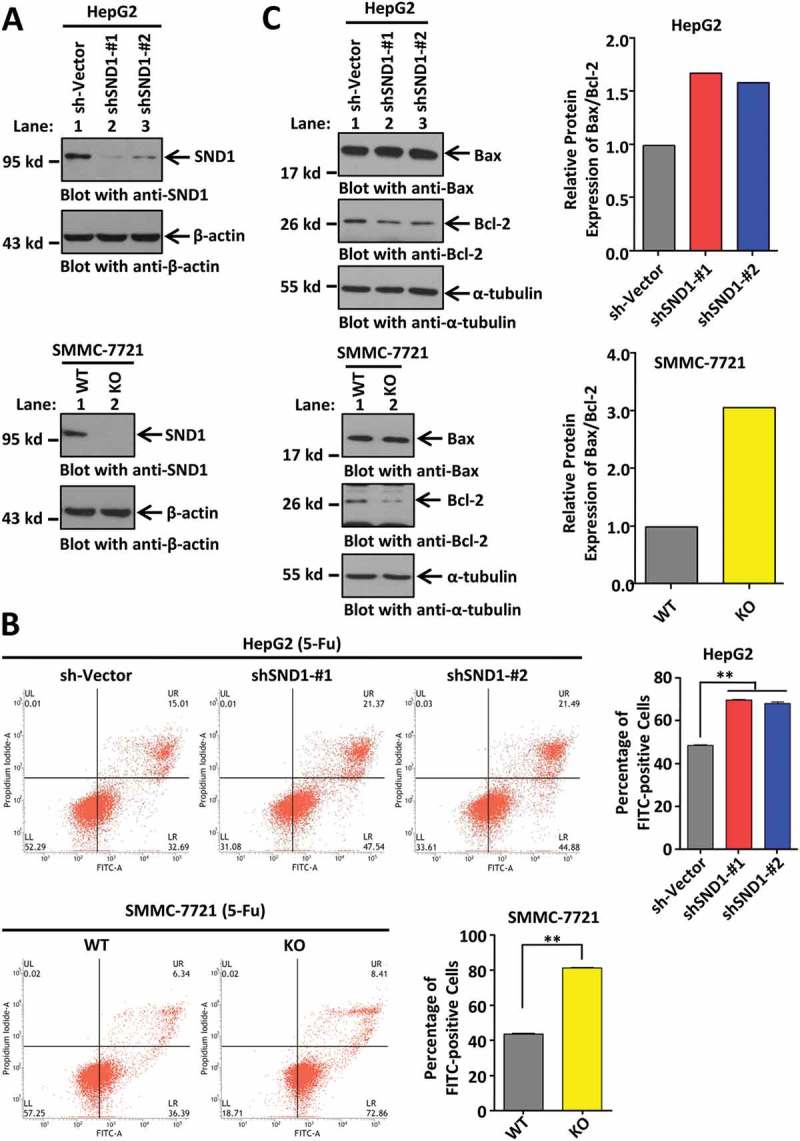
Effect of SND1 expression on the 5-Fu-induced apoptosis of HCC cell lines. (a) HepG2 cell lines with knockdown of SND1 gene (shSND1-#1 and shSND1-#2) and SMMC-7721-SND1 KO (knockout) cell lines were constructed. HepG2 sh-Vector and SMMC-7721-SND1 WT (wild-type) cell lines were used as controls. The cell lysates were subjected to SDS-PAGE and then immuno-blotted with anti-SND1 antibody (upper panel), or anti-β-actin antibody as the control (lower panel). (b) HepG2 sh-Vector, shSND1-#1, shSND1-#2 cell lines, and SMMC-7721-SND1 WT and KO cell lines were stimulated with 6 μg/mL 5-Fu. After 48 h, an apoptosis assay was performed by Annexin V-FITC/propidium iodide staining and flow cytometry. The percentage of FITC-positive cells was analyzed using ANOVA-SNK test (HepG2, **P < 0.01) or by independent sample Student’s t-test (SMMC-7721, **P < 0.01). (c) Expression of Bax and Bcl-2 proteins was detected by western blotting assays using anti-Bax and anti-Bcl-2 antibodies. α-tubulin was loaded as the control. Band density was digitized by Image J 2X software and the Bax/Bcl-2 ratio was calculated. The value of sh-vector or WT group was set to 1.
Under normal conditions, flow cytometry data indicated that, compared with the control group, the downregulation of SND1 in HepG2 cell lines did not statistically affect the cellular apoptosis (Supplementary Figure 3(a), P > 0.05). However, the complete depletion of SND1 enhanced the percentage of apoptotic SMMC-7721 cells (Supplementary Figure 3(b), P < 0.05). When HepG2 or SMMC-7721 cells were stimulated by treatment with 6 μg/mL 5-Fu, the expression of SND1 protein was not remarkably influenced (Supplementary Figure 4). Nevertheless, both the downregulation and complete depletion of SND1 efficiently increased the apoptosis levels of HepG2 and SMMC-7721 cells upon stimulation with 5-Fu (Figure 2(b)). Additionally, we observed similar results in the apoptosis assay on treatment with 5 μg/mL cisplatin (Supplementary Figure 5), suggesting that the potential anti-apoptotic role of SND1 may be similar under stimulation with different chemotherapeutic drugs.
Moreover, we selected the Bax/Bcl-2 ratio to reflect the apoptosis level of cells under treatment with 5-Fu. Western blotting assays were performed to detect the expression of pro-apoptotic Bax and anti-apoptotic Bcl-2 proteins. As shown in Figure 2(c), an increased Bax/Bcl-2 ratio value was observed, when SND1 expression was knocked down or out. Consistently, there is a positive correlation between SND1 expression and the 5-Fu-mediated chemosensitivity of HCC cells.
LncRNA UCA1 is involved in the association between SND1 and 5-Fu-induced HCC apoptosis
To further investigate the potential molecular mechanism underlying the role of SND1 in 5-Fu-induced HCC apoptosis, we performed an RNA microarray analysis upon treatment with 5-Fu, when SND1 expression in HepG2 cells was down-regulated or not. As shown in Figure 3(a), a total of 2,180 up-regulated (bright red signal) and 1,228 down-regulated (bright green signal) genes were detected. We performed a quantitative real-time PCR (qPCR) assay (Figure 3(b)) to confirm the down-regulation of several potential cellular survival or apoptosis-associated genes, including matrix metallopeptidase 1 (MMP1), lectin, galactoside-binding, soluble, 4 (LGALS4), carboxypeptidase A4 (CPA4), tetraspanin 1 (TSPAN1), and lncRNA urothelial cancer associated 1 (UCA1) in shSND1-#1 HepG2 cells, but not sh-Vector HepG2 cells. Here, we are interested in lncRNA UCA1, due to the lack of reports regarding SND1 and lncRNA. We further confirmed that the expression of lncRNA UCA1 was significantly decreased when SND1 expression was either down-regulated in HepG2 cells or completely depleted in SMMC-7721 cells, under 5-Fu treatment (Figure 3(c)). In addition, we constructed the stable UCA1 knockdown of HepG2 and SMMC-7721 cell lines (Figure 3(d)). The down-regulation of lncRNA UCA1 failed to affect the expression of SND1 (Figure 3(e)).
Figure 3.
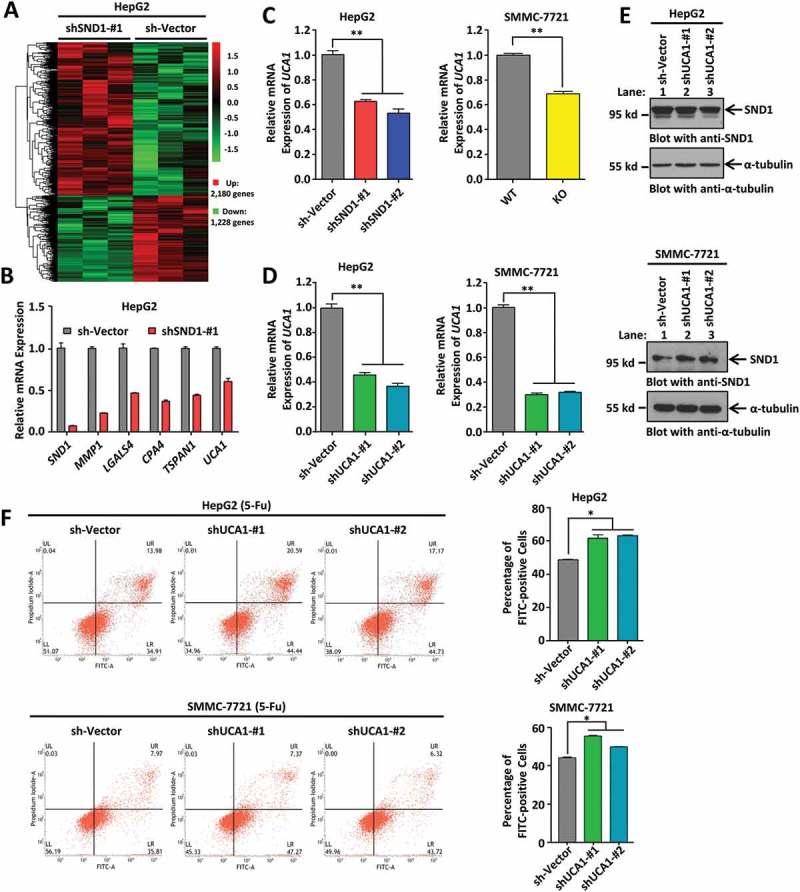
Downregulation of lncRNA UCA1 enhanced 5-Fu-induced apoptosis of HCC cell lines. (a) HepG2 sh-Vector and shSND1-#1 cell lines were treated with 6 μg/mL 5-Fu. After 48 h, a microarray analysis was performed. The hierarchical cluster analysis of significantly differentially expressed genes is presented: bright red, high expression; black, no significant change; bright green, low expression. (b) A few genes changed in microarray analysis, including SND1, MMP1, LGALS4, CPA4, TSPAN1, and lncRNA UCA1, were measured by qPCR assays. (c) Expression of UCA1 was detected in HepG2 sh-Vector, shSND1-#1, and shSND1-#2 cell lines, and SMMC-7721-SND1 WT and KO cell lines on treatment with 6 μg/mL 5-Fu by qPCR assay. ANOVA-SNK test (HepG2, **P < 0.01) and independent-sample Student’s t-test (SMMC-7721, **P < 0.01) were performed. (d) HepG2 or SMMC-7721 cell lines with sh-Vector, shUCA1-#1 and shUCA1-#2 were constructed. The expression of UCA1 was detected by qPCR assay and analyzed by ANOVA-SNK test (**P < 0.01). (e) Expression of SND1 protein was also measured by western blotting assays. α-tubulin was loaded as the control. (f) After stimulation with 6 μg/mL 5-Fu, apoptosis assay was performed by Annexin V-FITC/propidium iodide staining and flow cytometry. The percentage of FITC-positive cells shown were analyzed by ANOVA-SNK test (*P < 0.05).
We found that, under normal conditions, the downregulation of UCA1 slightly affected the apoptosis levels of HepG2 cells (Supplementary Figure 6(a), P < 0.05), but not SMMC-7721 cells (Supplementary Figure 6(b), P > 0.05). Cellular stimulation of 6 μg/mL 5-Fu led to enhanced expression of UCA1 (Supplementary Figure 7) in HepG2 and SMMC-7721 cells, and a slightly increased cytoplasmic fraction of UCA1 within HepG2 cells (Supplementary Figure 8). Under treatment with 5-Fu, an increased apoptosis level was detected in both HepG2 and SMMC-7721 cells with shUCA1-#1 and shUCA1-#2 compared with the sh-Vector control (Figure 3(f)).
In order to study whether lncRNA UCA1 is involved in the effect of SND1 expression on the apoptosis levels of HCC cells, we performed a rescue assay. As shown in Figure 4(a), the reduced expression levels of UCA1 in the HepG2 shSND1-#1 and shSND1-#2 cell lines, and in the SMMC-7721-SND1-KO cell lines were rescued by the ectopic expression of UCA1. We found that ectopic expression of UCA1 did not influence the expression of SND1 in either HepG2 or SMMC-7721 cells (Figure 4(b)). Nevertheless, we observed that the rescued expression of lncRNA UCA1 in the shSND1-#1 and shSND1-#2 HepG2 cell lines or in the SMMC-7721-SND1-KO cells led to a decreased percentage of apoptotic cells upon stimulation with 5-Fu (Figure 4(c)).
Figure 4.
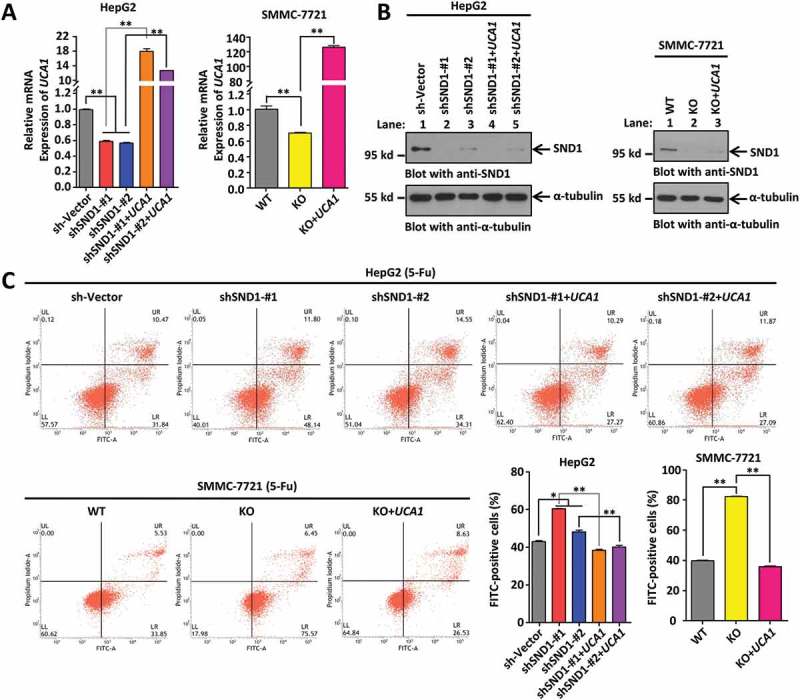
Ectopically expressed lncRNA UCA1 restores the increased apoptosis of HCC cell lines by depletion of SND1 in response to 5-Fu. (a) HepG2 sh-Vector, shSND1-#1, shSND1-#2 cell lines, and SMMC-7721-SND1 WT and KO cell lines were infected with Lenti-virus of UCA1 to establish cell lines with ectopic expression of UCA1. The expression of UCA1 was detected by qPCR and statistically analyzed by ANOVA-SNK test (**P < 0.01). (b) The expression of SND1 protein was detected by western blotting assays. α-tubulin was loaded as the control. (c) After stimulation with 6 μg/mL 5-Fu, the apoptosis assay was performed by Annexin V-FITC/propidium iodide staining and flow cytometry. The percentage of FITC-positive cells were shown and analyzed by ANOVA-SNK test (*P < 0.05, **P < 0.01).
In addition, we performed a nude mouse subcutaneous xenograft tumor experiment in vivo (n = 6) using constructed HepG2 sh-Vector, shSND1-#1, shSND1-#1+ UCA1, and shUCA1-#1 stable cell lines. As shown in Figure 5(a), cells were inoculated subcutaneously into nude mice and injected intraperitoneally with 30 mg/Kg 5-Fu twice. Tumor size (mm3) and tumor weight (g) in mice were measured. The mice were sacrificed 15 days after the second injection and the tumor was removed for testing. We observed that the tumors in mice with knock-down of SND1 (Figure 5(a), b) or UCA1 (d) were significantly smaller than those in mice with the sh-Vector control (a). Ectopically expressed lncRNA UCA1 (Figure 5(a), c) restored the reduced tumor size caused by depletion of SND1 (b). Specific measurement data are shown in Figure 5(b-d). All the above data suggest that SND1 affects the 5-Fu-induced apoptosis levels of HCC cells by regulating the expression of lncRNA UCA1.
Figure 5.
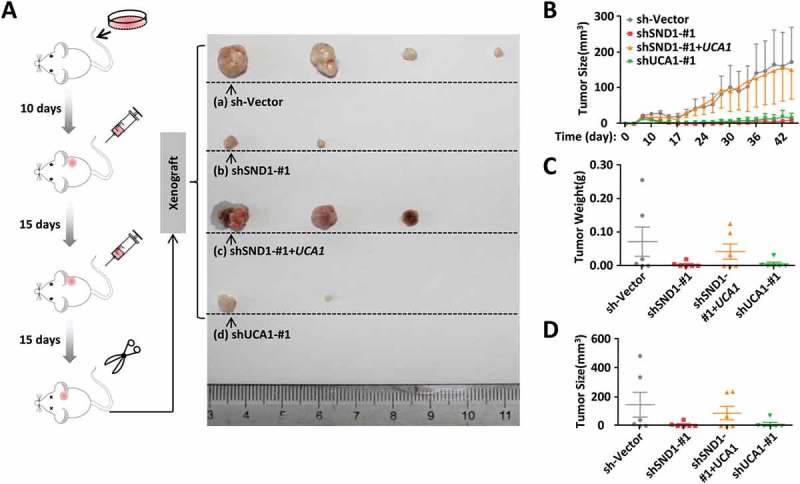
Effect of SND1 and lncRNAUCA1 expression on the in vivo tumor formation ability of nude mice under the stimulation of 5-Fu. (a) HepG2 sh-Vector, shSND1-#1, shSND1-#1+ UCA1, and shUCA1-#1 cell lines were inoculated subcutaneously into nude mice. After 10 days, 30 mg/kg 5-Fu was injected intraperitoneally once every 15 days. A schematic diagram of the xenograft is shown (n = 6 per group). The tumors from each group were arranged from large to small, and the largest four tumors are shown (b ~ d). Tumor size (mm3) and tumor weight (g) were measured.
SND1 may regulate UCA1 expression via a transcriptional activator MYB
Next, we investigated the regulation mechanism between SND1 and lncRNA UCA1. As shown in Figure 6(a), we constructed plasmids of the GLuc-UCA1 promoter of either full-length [FL, −2000 bp ~ TSS (transcription start site)] or different truncations (#1 of −1500 bp ~ TSS, #2 of −1000 bp ~ TSS, #3 of −500 bp ~ TSS, #4 of −2000 ~-500 bp) and performed GLuc-ON Promoter Reporter assays. As shown in Figure 6(b), the high expression of SND1 by means of the transfection of the Flag-SND1 plasmid resulted in an increased relative Gluc activity of GLuc-UCA1 promoter full-length. The results of the GLuc-ON Promoter Reporter assay in Figure 6(c) show that over-expression of SND1 could result in an increased relative Gluc activity of all truncations of the lncRNA UCA1 promoter. The data in Figure 4(a) also show that both the downregulation and the complete depletion of SND1 can decrease the expression level of UCA1. This suggests that SND1 protein is capable of regulating the expression of lncRNA UCA1.
Figure 6.
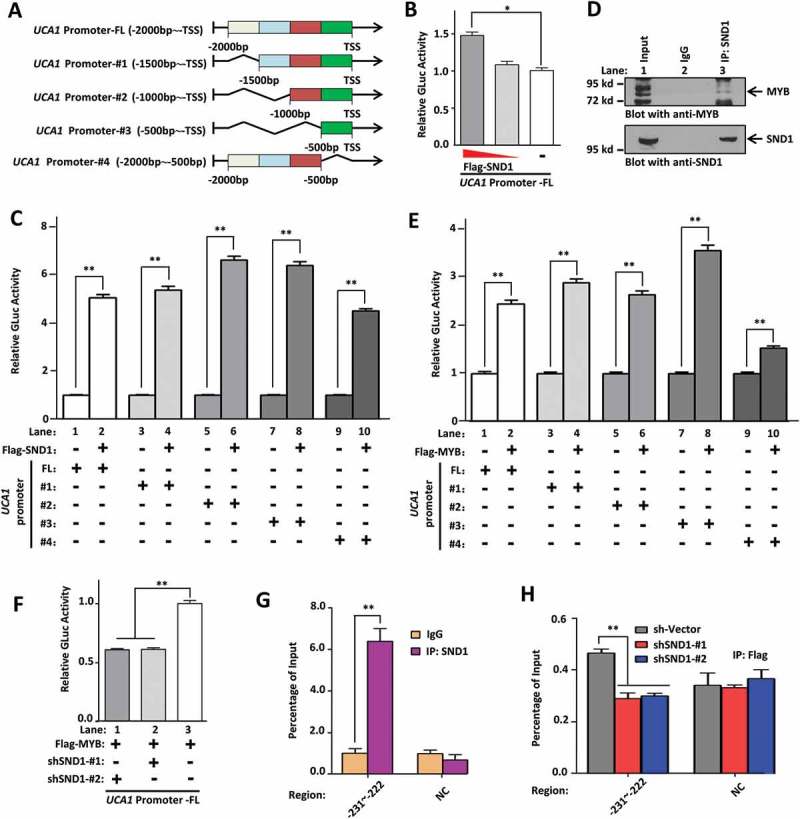
SND1 regulates the expression of UCA1 through MYB. (a) Plasmids of the GLuc-UCA1 promoter of either full-length (FL, −2000 bp ~ TSS) or different truncations (#1 of −1500 bp ~ TSS, #2 of −1000 bp ~ TSS, #3 of −500 bp ~ TSS, #4 of −2000 ~-500 bp) were constructed. (b) HepG2 cells were co-transfected with the GLuc-UCA1 promoter FL and different doses of Flag-SND1 plasmid. The relative GLuc activity was detected and analyzed using the ANOVA-SNK test (*P < 0.05). (c, e) SMMC-7721 cells were co-transfected with either Flag-MYB, Flag-SND1, or Flag-Vector plasmid, together with GLuc-UCA1 promoter FL or different truncations (#1~#4). An independent-sample Student’s t-test was performed, and significant differences were indicated: ** P < 0.01. (d) The total cell lysate of HepG2 cells was immuno-precipitated with either mouse anti-SND1 antibody or mouse IgG antibody as the negative control. The precipitated proteins were subjected to SDS-PAGE and blotted with anti-MYB antibody (upper panel). The same filter was stripped and re-blotted with anti-SND1 antibody (lower panel). (f) Cells were co-transfected with Flag-MYB, GLuc-UCA1 promoter FL, together with shSND1 #1, shSND1 #2, or sh-Vector plasmids. The relative GLuc activity was measured and analyzed by ANOVA-SNK test (**P < 0.01). (g) A ChIP assay was performed with anti-SND1 or anti-IgG antibodies. The primers of ‘-231 ~ −222’ bp and negative control(NC) were used for the PCR assay. (h) HepG2-Flag-MYB cell lines were transfected with sh-Vector, shSND1-#1 or shSND1-#2 plasmids. A ChIP assay was performed with anti-Flag antibody. The primers of ‘-231~-222’ bp and NC were also used for the PCR assay. An ANOVA-SNK test was performed and significant differences were indicated: ** P < 0.01.
Promoter transcription factor predictive analysis (data not shown) suggested that the MYB protein, reported to bind SND1 protein in vitro [19], may function as a transcription factor for lncRNA UCA1. We performed a co-immunoprecipitation (Co-IP) assay to confirm the in vivo binding relationship in HepG2 cells (Figure 6(d)). We also found that over-expression of MYB enhanced the expression of UCA1 in both HepG2 and SMMC-7721 cell lines (Supplementary Figure 9), and led to an increase in the relative Gluc activity of the FL or different truncation regions of the lncRNA UCA1 promoter, especially the ‘-500 bp ~ TSS’ region (#3, lane 7–8) (Figure 6(e)). After the predictive analysis of JASPAR, a database of transcription factor binding profiles (data not shown), two potential regions of ‘-111~-102’ bp and ‘-231~-222’ bp within ‘-500 bp ~ TSS’ region, were obtained. We therefore performed an EMSA assay using anti-MYB antibody and biotinylated/unlabeled probes targeting these two specific regions. As shown in Supplementary Figure 10(a), for the probe ‘-231~-222’, we observed the signal for a DNA-protein complex in lane 2–4, but not lane 1, and a supershift band with strong signal in lane 4. Nevertheless, no signal was detected for the probe ‘-111~-102’ as shown in Supplementary Figure 10(b). These results suggest a potential in vitro binding relationship between the MYB protein and the ‘-231~-222’ bp region within the promoter of UCA1.
In addition, we found that the down-regulated expression of SND1 significantly reduced the MYB-induced Gluc activity enhancement of the UCA1 full-length promoter (Figure 6(f)). To further study the association between the SND1 and UCA1 promoter, we performed a chromatin immunoprecipitation assay (ChIP) using either anti-SND1 or anti-IgG as negative controls (NC). As shown in Figure 6(g), targeting the ‘-231~-222’ bp region was detectable in the anti-SND1 group, but not IgG group. No difference for the negative control region was observed in either the anti-SND1 or IgG group (Figure 6(g)). Furthermore, down-regulation of SND1 reduced the binding of the ‘-231~-222’ bp region in the MYB protein (Figure 6(h)). These results suggest that SND1 regulates the expression of lncRNA UCA1 through MYB.
Discussion
LncRNA UCA1 was first identified as a potential biomarker of human bladder cancer [20]. Later studies supported the idea that UCA1 is aberrantly expressed in many clinical tumors, such as pancreatic cancer, ovarian cancer, lung cancer, gastric cancer, liver cancer, melanoma, and osteosarcoma, and has effects on a series of biological processes, including in tumorigenesis in terms of the proliferation, apoptosis, and metastasis of tumor cells [21–24]. For example, UCA1 promotes the progression of bladder carcinoma cells through the up-regulation of the cAMP response element-binding protein (CREB) expression and phosphoinositide 3-kinase/protein kinase B (PI3K/AKT) pathway [25], or lung cancer by modulating the miR-193a/high mobility group box 1 (HMGB1) axis [26]. Additionally, UCA1 may be implicated in the cisplatin resistance of bladder cancer cells in a wingless-type MMTV integration site family member 6 (Wnt 6)-dependent manner [27], in human ovarian cancer cells by modulating expression of SRSF protein kinase 1 (SRPK1) gene [28], or in pancreatic cancer by regulating the expression of miR-96 and forkhead box O3 (FOXO3) gene [29]. In this study, we focused on the correlation between UCA1 and chemosensitivity of liver cancer.
Surgery, chemotherapy, and radiation therapy are currently the main approaches for the clinical treatment of HCC, the most common type of liver cancer [30]. The decreased sensitivity of HCC to systemic chemotherapy is the main reason for the poor efficacy of chemotherapy during clinical HCC treatment [31]. UCA1 is reported to be associated with the progression of HCC by modulating the fibroblast growth factor receptor 1 (FGFR1)/extracellular regulated protein kinases (ERK) signaling pathway and the expression of miR-216b [32]. However, the specific role of UCA1 in the sensitivity of HCC chemotherapy remains elusive. Herein, we investigated whether SND1-UCA1 is associated with the chemosensitivity of HCC cells for the first time. Our data revealed that, in response to the chemotherapy agent 5-Fu, the expression of lncRNA UCA1 was closely linked to the apoptosis status of both HepG2 and SMMC-7721 cells, also involving the regulation effect of SND1-MYB.
SND1 protein interacts with and acts as the transcriptional coactivator of interleukin-4 (IL-4)-induced signal transducer and as the activator of transcription 6 (STAT6) [33], but not as the signal transducer and activator of transcription 1 (STAT1) [34]. SND1 protein also functions as a co-activator of e2f transcription factor 1 (E2F1) to regulate the G1/S transition of the cell cycle [9]. In this study, we illustrated that the MYB transcription factor may contribute to the regulatory effects of SND1 on the expression of lncRNA UCA1. The multifunctional MYB transcription factor in eukaryotic cells is known to modulate the expression of targeting genes by binding to certain specific DNA sequences [35,36]. In this report, the ‘-231~-222’ bp region, rather than the ‘-111~-102’ bp region, within the promoter of UCA1 in HCC cells served as the main binding site for the MYB transcription factor. Previously, the SND1 protein was reported to enhance MYB activity cooperating with Pim-1 kinase in hematopoietic cells [37]. In this study, the association between the ‘-231~-222’ bp transcription factor binding sites and MYB in HCC cells was decreased by down-regulation of the expression of the co-activator protein SND1. It is possible that SND1 could up-regulate the expression of lncRNA UCA1 by acting as the co-activator of MYB.
In our GLuc-ON promoter reporter assay, we observed the distinct effects of an over-expressed SND1 or MYB on the different lncRNA UCA1 promoter truncations. When comparing to Flag-Vector control group, a relatively higher relative Gluc activity was still detected in the ‘-2000 bp ~-500bp’ truncation. In addition, it should be noted that the MYB protein is not highly expressed in the HCC cell line. Besides MYB, other transcription factors, such as CCAAT/enhancer binding protein alpha (C/EBPα), ETS proto-oncogene 2 (Ets-2), or hypoxia inducible factor 1 alpha (HIF-1α), was also predicted. Therefore, we were unable to rule out the regulatory role of other SND1-associated transcription factors in the expression of lncRNA UCA1. More data are needed to investigate and elucidate this issue.
A previous study reported that SND1 protein interacted with MTDH and inhibited the oncogene-induced apoptotic response in breast cancer cells [38]. The SND1 protein was also reported to be a substrate of metacaspase mcII-Pa in plants, which can be cleaved by caspase-3 during apoptosis in mammals, thereby influencing the regulation activity of SND1 in the pre-mRNA splicing process [39]. The silencing of the SND1 gene could lead to an increased apoptosis level of non-small cell lung cancer (NSCLC) cells under treatment with cisplatin [40]. Here, we further reported that SND1 is capable of curbing the apoptosis levels of HCC cells by modulating the expression of lncRNA UCA1 in response to 5-Fu stimulation. It is possible that highly expressed SND1 drives the chemoresistance of HCC to various chemotherapy agents to a certain extent. It is worthwhile to analyze the role of the SND1-MYB-UCA1 axis in drug resistance during chemotherapy in hepatocellular carcinoma patients. Perhaps SND1 enhances the chemoresistance of hepatocellular carcinoma by regulating MYB-UCA1. The SND1-MYB-UCA1 axis may be a potential prognostic molecular marker or therapeutic target for hepatocellular carcinoma patients with drug resistance.
Very recently, we found that, upon ionizing irradiation, the SND1 protein could be accumulated at sites of DNA damage and help in chromatin relaxation via the recruitment of the SWI/SNF-related matrix-associated actin-dependent regulator of chromatin A5 (SMARCA5), an ATP-dependent chromatin remodeler, and the histone acetyltransferase GCN5. Cell survival was consequently promoted by the activation role of SND1 in ATM kinase and downstream DNA repair signaling pathways [11]. The regulation role of SND1 in chromatin relaxation and DNA repair processes may also partly contribute to the complicated anti-apoptotic mechanism of SND1-MYB-UCA1, which requires further evidence.
Taken together, this study provides new insights into the functional link between SND1 and lncRNA. SND1 affects the 5-Fu-induced apoptosis levels of HCC cells by regulating the expression of lncRNA UCA1. Furthermore, the effect of the SND1-MYB complex on the modulation of UCA1 expression may also be involved in the anti-apoptotic role of SND1 in hepatocellular carcinoma cells.
Materials and methods
Cell culture and transfection
Human embryonic kidney 293t (HEK 293t) cell line and hepatocellular carcinoma (HCC) cell line HepG2 were purchased from American Type Culture Collection (ATCC, Manassas, VA, USA) and cultured according to the manufacturer’s instructions. HCC cell line SMMC-7721, provided by Dr. Zhi Yao, was grown in Dulbecco’s modified Eagle’s medium (DMEM, 06-1055-57-1ACS, Gibco) with 10% fetal bovine serum (FBS, Gibco). The cells were transfected using Lipofectamine 2000 transfection reagent (11668-027, Invitrogen), according to the manufacturer’s protocol.
Plasmids and stable cell construction
Two shRNAs targeting the SND1 gene cloned into a TRC2-pLKO-Puro vector (shSND1-#1 and shSND1-#2) were purchased from Sigma-Aldrich (TRCN0000245142 and TRCN0000245144). Two published shRNAs against UCA1 (Supplementary Table 3) [41,42] were cloned into the TRC2-pLKO-Puro vector with AgeI and EcoRI sites to obtain two plasmids, namely shUCA1-#1 and shUCA1-#2.
GLuc-ONTM Promoter Reporter Clones (pEZX-PG04, GeneCopoeia) were generously gifted by Dr. Li Zhao (Tianjin Medical University, Tianjin). Full-length and different truncations of the UCA1 promoter were cloned into a pEZX-PG04 vector with SpeI and AgeI sites.
A pLVX-IRES-Puro vector (632183, Clontech) was generously gifted by Dr. Lei Shi (Tianjin Medical University, Tianjin). For the pLVX-IRES-Puro-UCA1 plasmid, full-length UCA1 cDNA (NR_015379.2) was cloned into the pLVX-IRES-Puro vector with EcoRI and BamHI sites. The cDNA sequence of the SND1 gene (NM_014390.3) was cloned into the pLVX-IRES-Puro vector with a Flag sequence at the 5ʹ end with EcoRI and BamHI sites to obtain a pLVX-IRES-Puro-Flag-SND1 plasmid. The coding sequence of MYB cDNA (NM_001130173.1) was cloned into the pLVX-IRES-Puro vector with a Flag sequence at the 5ʹ end with XhoI and NotI sites to obtain a pLVX-IRES-Puro-Flag-MYB plasmid.
Lenti-virus particles were produced from the cell culture supernatant after co-transfection of the above lentiviral expression plasmid and two envelope expressing plasmids in HEK293t cells. HepG2 or SMMC-7721 cells were infected with lenti-virus for 48 h and treated with 2 μg/mL puromycin for seven days. Thus, positive stable cell lines were obtained. In addition, a SMMC-7721-SND1-knockout (KO) stable cell line was generated via a modified CRISPR/Cas9 double-nicking gene editing system [43–45].
Database analysis
Immunohistochemistry analysis data on the expression of SND1 in normal liver tissue and hepatocellular carcinoma tissue were obtained from the online HPA database (https://www.proteinatlas.org/pathology). A volcano plot of SND1 expression in liver hepatocellular carcinoma patients was obtained from the TCGA database (https://cancergenome.nih.gov/). Data of liver cancer patients within the TCGA-LIHC project from TCGA database were downloaded using the GDC (NCI’s genomic data commons) data transfer tool, and processed by ActivePerl 5.24.2 (http://www.perl.org/) and R software version 3.4.3 (https://www.r-project.org/). The edgeR package was used to normalize the expression of SND1 gene, based on the raw count data. Then, logarithm base 10 (log10) was utilized to transform the data for the following analyzes. The liver cancer patients were divided into high-expression and low-expression groups, according to the median value of SND1 expression. Based on the available vital and other information (e.g. age, ethnicity, gender, race, neoplasm histologic grades, pathologic T/M/N stages, pathologic stages I~ IV, drug, ablation, or radiation therapy) of the liver cancer patients, IBM SPSS Statistics 20 Software was used to perform the Kaplan-Meier overall survival curves analysis.
Quantitative real-time PCR assay (qPCR)
Total RNA was isolated from cells using TRIzol (15596-026, Invitrogen). Primers were synthesized by the GENEWIZ company (China). The synthetization of cDNA was achieved using the RevertAid First Strand cDNA Synthesis Kit (K1622, Thermo Fisher Scientific). PCRs were performed using the FastStart Universal SYBR Green Master Mix (Roche Diagnostics) on a StepOne Real-Time PCR System (Applied Biosystems), as described previously [8]. The detailed primer sequence information is listed in Supplementary Table 3.
Western blotting assay
A western blotting assay was performed as previously described [9]. The following antibodies were used: anti-α-tubulin (1:5000, T5168, Sigma-Aldrich), anti-β-actin (1:5000, A5441, Sigma-Aldrich), anti-Bax (1:2000, 50599-2-Ig, Proteintech Group, Inc.), anti-Bcl-2 (1:1000, 12789-1-AP, Proteintech Group), anti-MYB (1:500, 17800-1-AP, Proteintech Group). Mouse monoclonal anti-SND1 antibody was used as described previously [10,43]. Image J 2X software (NIMH, Bethesda, MD, USA) was used to digitize the band density.
Apoptosis assay
Cells were harvested and stimulated using either 6 μg/mL 5-Fu (F100149, Aladdin) or 5 μg/mL cisplatin (P4394, Sigma-Aldrich). An Annexin-V FITC Apoptosis Detection Kit (AD10, Dojindo Laboratories) was then used to stain the cells, according to the manufacturer’s protocol. The percentage of FITC-positive apoptotic cells was analyzed by flow cytometry (BD Biosciences FACSVerse, Becton Dickinson).
RNA microarray detection
HepG2 stable cell lines of shSND1-#1 and pLKO-Vector were treated with 6 μg/mL 5-Fu. Then, 48 h after treatment, we extracted and purified total RNA using TRIzol reagent (Life Technologies) and RNeasy mini kit (Qiagen). Next, we synthesized the cDNA using an Ambion WT Expression Kit (Affymetrix), and obtained the cRNA by using a GeneChip WT Terminal Labeling and Controls Kit (Affymetrix, Inc.). Affymetrix Human Transcriptome Array 2.0 was then utilized to hybridize the fragmented cRNA product. After washing and staining in the GeneChip Fluidics Station 450, we used the Affymetrix® GeneChip Command Console (AGCC) and robust multichip analysis (RMA) algorithms to scan the arrays and analyze the data, under the Affymetrix default settings and normalization procedures (global scaling). The log2 RMA signal intensity data was obtained. Student’s t test was utilized for the identification of differentially expressed genes between the shSND1-#1 and sh-Vector groups. The threshold of significant P value less than 0.05 and fold change (FC) larger than 1.2 was applied. After the submission of our data, we obtained a gene expression omnibus (GEO) accession number, ‘GSE114447’, from the national center for biotechnology information (NCBI).
Co-immunoprecipitation (Co-IP) assay
A Co-IP assay was performed as previously described [10]. Briefly, total cell lysates were extracted with RIPA lysis buffer (50mM Tris, pH 7.4, 150 mM NaCl, 1% Nonidet P-40, 0.5% sodium deoxycholate) supplemented with phenylmethanesulfonylfluoride fluoride (PMSF) and protease inhibitor cocktails (PIC, 04693124001, Roche Applied Science). Then, 500 μg of total cell lysates were incubated with a mouse anti-SND1 antibody, mouse anti-IgG antibody (sc-2025, Santa Cruz Biotechnology), as a negative control, followed by incubation with Pierce Protein A/G agarose (20422, Thermo Fisher Scientific). The bound proteins were analyzed by SDS-PAGE and blotted with anti-MYB antibody (Proteintech Group).
Electrophoretic mobility shift assay (EMSA)
Cells treated with 5-Fu were harvested and ruptured with CP buffer (10 mM Tris-HCl, pH 8.0, 10 mM KCl, 1.5 mM MgCl2, 1 mM DTT, 1% Nonidet P-40) supplemented with PMSF and PIC. After maintaining on ice for 10 min, centrifugation was performed to select the nuclear precipitates, which were suspended in NE buffer (20 mM Tris-HCl, pH 8.0, 200 mM NaCl, 1.5 mM MgCl2, 0.2 mM EDTA, 1 mM DTT, 5% glycerol) and supplemented with PMSF and PIC. The nuclear lysates were obtained through sonication and centrifugation. Biotinylated probes and unlabeled probes were synthesized by the GENEWIZ company. Supplementary Table 3 shows the detailed probe information. Anti-MYB antibody (1 μL, Proteintech Group) was used. EMSA experiments were performed using a Chemiluminescent EMSA Kit (GS009, Beyotime), according to the manufacturer’s protocol.
GLuc-ON promoter reporter assay
Cells were co-transfected with the plasmids of the GLuc-UCA1 promoter (full-length or different truncations), Flag-SND1 or Flag-MYB. GLuc-UCA1 promoter Full-length was co-transfected with plasmids of Flag-MYB and pLKO-shSND1 (#1 or #2). The gaussia luciferase (GLuc) and secreted alkaline phosphatase (SEAP) assays were performed using a Secrete-Pair Dual Luminescence Assay Kit (SPDA-D010, GeneCopoeia), according to the manufacturer’s protocols. The relative GLuc activity was normalized to SEAP activity. The sequence information is shown in Supplementary Table 3.
Chromatin immunoprecipitation assay (ChlP)
A ChIP assay was performed as described previously [8]. Cell nuclear lysates (100 μg) were incubated with antibodies and Magna ChIP Protein A + G Magnetic Beads (16–663, Millipore) or with anti-Flag M2 Affinity Gel (A2220, Sigma-Aldrich). The purified immunoprecipitated DNA samples were obtained with a QIAquick PCR Purification Kit (28104, Qiagen) and measured by qPCR assay with specific primers (shown in supplementary Table 3).
Tumor implantation and treatment in nude mice
Six-week-old male athymic pathogen-free nude mice were used. To establish xenografts, 5 × 10⁶ cells (in 150 μL PBS) of HepG2 pLKO-Vector, shSND1-#1, shSND1-#1+ UCA1, or shUCA1-#1 stable cell lines were separately subcutaneously injected into the right flank area of the mice. Ten days after injection, 5-Fu (30 mg/kg) was administered by intraperitoneal injection twice every 15 days. All mice were monitored for activity, body weight, and tumor growth. At the end of the experiments, mice were sacrificed, and the weight and size of the xenograft tumors were measured. All mouse procedures were approved by the committee on the use and care of animals of Tianjin Medical University.
Nuclear-cytoplasmic distribution analysis
Cytoplasmic and nuclear RNAs in HepG2 with or without 5-Fu treatment were isolated and purified using a PARIS kit (AM1921, Life Technology), according to the manufacturer’s protocol. The RNAs were reverse-transcribed, and the expression level of the UCA1 gene was measured by qPCR assay. The glyceraldehyde-3-phosphate dehydrogenase (GAPDH) gene was used as the cytoplasmic control and U6 RNA was used as the nuclear control. The detailed primer sequence information is shown in Supplementary Table 3.
Statistical analysis
Student’s t test and one-way analysis of variance (ANOVA) followed by a multiple mean comparisons Student-Newman-Keuls (SNK) test were performed to compare the difference between the experimental groups. Univariate/multivariate Cox regression and Log-rank test were performed for survival analysis. A Chi-square (χ2) test was performed to analyze the correlation between SND1 expression and the clinicopathological features of the liver cancer patients in the TCGA database. A P value lower than 0.05 was indicative of a statistically significant difference. IBM SPSS Statistics 20 Software was utilized for the above statistical analysis.
Funding Statement
This work was supported by the National Natural Science Foundation of China [31670759]; National Natural Science Foundation of China [31571380]; National Natural Science Foundation of China [81572882]; National Natural Science Foundation of China [31701182]; Tianjin Research Program of Application Foundation and Advanced Technology [15JCQNJC09900]; Excellent Talent Project of Tianjin Medical University;Innovation Team Development Plan of the Ministry of Education [IRT13085]; National Science Foundation for Distinguished Young Scholars of China [31125012].
Acknowledgments
This work was supported by grants from the National Science Foundation for Distinguished Young Scholars of China (31125012 to J.Y.), Innovation Team Development Plan of the Ministry of Education (IRT13085 to J.Y.), National Natural Science Foundation of China (31670759 to J.Y., 31571380 to X.G., 81572882 to Z.Y., 31701182 to C.S.), Excellent Talent Project of Tianjin Medical University (to J.Y.), Tianjin Research Program of Application Foundation and Advanced Technology (15JCQNJC09900 to X.G.). We would like to thank Dr. Lei Shi, Dr. Li Zhao and Dr. Xudong Wu (Tianjin Medical University, Tianjin) for material support and technical assistance. We also thank the technical support of Beijing Cnkingbio Biotechnology Co.LTD for the microarray analysis and Editage (https://www.editage.com/) for providing English language editing service.
Disclosure statement
No potential conflict of interest was reported by the authors.
Supplementary material
Supplemental data for this article can be accessed here.
References
- [1].Gutierrez-Beltran E, Denisenko TV, Zhivotovsky B, et al. Tudor staphylococcal nuclease: biochemistry and functions. Cell Death Differ. 2016;23(11):1739–1748. [DOI] [PMC free article] [PubMed] [Google Scholar]
- [2].Yang J, Valineva T, Hong J, et al. Transcriptional co-activator protein p100 interacts with snRNP proteins and facilitates the assembly of the spliceosome. Nucleic Acids Res. 2007;35(13):4485–4494. [DOI] [PMC free article] [PubMed] [Google Scholar]
- [3].Shaw N, Zhao M, Cheng C, et al. The multifunctional human p100 protein ‘hooks’ methylated ligands. Nat Struct Mol Biol. 2007;14(8):779–784. [DOI] [PubMed] [Google Scholar]
- [4].Jariwala N, Rajasekaran D, Srivastava J, et al. Role of the staphylococcal nuclease and tudor domain containing 1 in oncogenesis (review). Int J Oncol. 2015;46(2):465–473. [DOI] [PMC free article] [PubMed] [Google Scholar]
- [5].Duan Z, Zhao X, Fu X, et al. Tudor-SN, a novel coactivator of peroxisome proliferator-activated receptor gamma protein, is essential for adipogenesis. J Biol Chem. 2014;289(12):8364–8374. [DOI] [PMC free article] [PubMed] [Google Scholar]
- [6].Gao X, Zhao X, Zhu Y, et al. Tudor staphylococcal nuclease (Tudor-SN) participates in small ribonucleoprotein (snRNP) assembly via interacting with symmetrically dimethylated Sm proteins. J Biol Chem. 2012;287(22):18130–18141. [DOI] [PMC free article] [PubMed] [Google Scholar]
- [7].Yang J, Valineva T, Hong J, et al. Transcriptional co-activator protein p100 with snRNP proteins and facilitates the E of the spliceosorne. Nucleic Acids Res. 2007;35(13):4485–4494. [DOI] [PMC free article] [PubMed] [Google Scholar]
- [8].Yu L, Liu X, Cui K, et al. SND1 acts downstream of TGFbeta1 and upstream of Smurf1 to promote breast cancer metastasis. Cancer Res. 2015;75(7):1275–1286. [DOI] [PubMed] [Google Scholar]
- [9].Su C, Zhang C, Tecle A, et al. Tudor staphylococcal nuclease (Tudor-SN), a novel regulator facilitating G1/S phase transition, acting as a co-activator of E2F-1 in cell cycle regulation. J Biol Chem. 2015;290(11):7208–7220. [DOI] [PMC free article] [PubMed] [Google Scholar]
- [10].Gao X, Ge L, Shao J, et al. Tudor-SN interacts with and co-localizes with G3BP in stress granules under stress conditions. FEBS Lett. 2010;584(16):3525–3532. [DOI] [PMC free article] [PubMed] [Google Scholar]
- [11].Fu X, Zhang C, Meng H, et al. Oncoprotein Tudor-SN is a key determinant providing survival advantage under DNA damaging stress. Cell Death Differ. 2018;25:1625–1637. [DOI] [PMC free article] [PubMed] [Google Scholar]
- [12].Yoo BK, Santhekadur PK, Gredler R, et al. Increased RNA-induced silencing complex (RISC) activity contributes to hepatocellular carcinoma. Hepatology. 2011;53(5):1538–1548. [DOI] [PMC free article] [PubMed] [Google Scholar]
- [13].Rajasekaran D, Jariwala N, Mendoza RG, et al. Staphylococcal nuclease and tudor domain containing 1 (SND1 protein) promotes hepatocarcinogenesis by inhibiting monoglyceride lipase (MGLL). J Biol Chem. 2016;291(20):10736–10746. [DOI] [PMC free article] [PubMed] [Google Scholar]
- [14].Santhekadur PK, Das SK, Gredler R, et al. Multifunction protein staphylococcal nuclease domain containing 1 (SND1) promotes tumor angiogenesis in human hepatocellular carcinoma through novel pathway that involves nuclear factor kappaB and miR-221. J Biol Chem. 2012;287(17):13952–13958. [DOI] [PMC free article] [PubMed] [Google Scholar]
- [15].Armengol S, Arretxe E, Enzunza L, et al. The promoter of cell growth- and RNA protection-associated SND1 gene is activated by endoplasmic reticulum stress in human hepatoma cells. BMC Biochem. 2014;15:25. [DOI] [PMC free article] [PubMed] [Google Scholar]
- [16].Zhao X, Duan Z, Liu X, et al. MicroRNA-127 is downregulated by Tudor-SN protein and contributes to metastasis and proliferation in breast cancer cell line MDA-MB-231. Anat Rec (Hoboken). 2013;296(12):1842–1849. [DOI] [PubMed] [Google Scholar]
- [17].Gao X, Fu X, Song J, et al. Poly(A)(+) mRNA-binding protein Tudor-SN regulates stress granules aggregation dynamics. FEBS J. 2015;282(5):874–890. [DOI] [PubMed] [Google Scholar]
- [18].Lohitesh K, Chowdhury R, Mukherjee S.. Resistance a major hindrance to chemotherapy in hepatocellular carcinoma: an insight. Cancer Cell Int. 2018;18:44. [DOI] [PMC free article] [PubMed] [Google Scholar]
- [19].Dash AB, Orrico FC, Ness SA. The EVES motif mediates both intermolecular and intramolecular regulation of c-Myb. Genes Dev. 1996;10(15):1858–1869. [DOI] [PubMed] [Google Scholar]
- [20].Wang XS, Zhang Z, Wang HC, et al. Rapid identification of UCA1 as a very sensitive and specific unique marker for human bladder carcinoma. Clin Cancer Res. 2006;12(16):4851–4858. [DOI] [PubMed] [Google Scholar]
- [21].Fang Q, Chen X, Zhi X. Long non-coding RNA (LncRNA) urothelial carcinoma associated 1 (UCA1) increases multi-drug resistance of gastric cancer via downregulating miR-27b. Med Sci Monit. 2016;22:3506–3513. [DOI] [PMC free article] [PubMed] [Google Scholar]
- [22].Xue M, Li X, Chen W. [Bioinformatics analysis and identification of transcriptional regulation of human UCA1 gene]. Nan Fang Yi Ke Da Xue Xue Bao. 2013;33(11):1596–1599. [PubMed] [Google Scholar]
- [23].Xue M, Chen W, Li X. Urothelial cancer associated 1: a long noncoding RNA with a crucial role in cancer. J Cancer Res Clin Oncol. 2016;142(7):1407–1419. [DOI] [PMC free article] [PubMed] [Google Scholar]
- [24].Li J, Gao J, Kan A, et al. SNHG and UCA1 as prognostic molecular biomarkers in hepatocellular carcinoma: recent research and meta-analysis. Minerva Med. 2017;108(6):568–574. [DOI] [PubMed] [Google Scholar]
- [25].Yang C, Li X, Wang Y, et al. Long non-coding RNA UCA1 regulated cell cycle distribution via CREB through PI3-K dependent pathway in bladder carcinoma cells. Gene. 2012;496(1):8–16. [DOI] [PubMed] [Google Scholar]
- [26].Wu H, Zhou C. Long non-coding RNA UCA1 promotes lung cancer cell proliferation and migration via microRNA-193a/HMGB1 axis. Biochem Biophys Res Commun. 2018;496(2):738–745. [DOI] [PubMed] [Google Scholar]
- [27].Fan Y, Shen B, Tan M, et al. Long non-coding RNA UCA1 increases chemoresistance of bladder cancer cells by regulating Wnt signaling. FEBS J. 2014;281(7):1750–1758. [DOI] [PubMed] [Google Scholar]
- [28].Wang F, Zhou J, Xie X, et al. Involvement of SRPK1 in cisplatin resistance related to long non-coding RNA UCA1 in human ovarian cancer cells. Neoplasma. 2015;62(3):432–438. [PubMed] [Google Scholar]
- [29].Zhou Y, Chen Y, Ding W, et al. LncRNA UCA1 impacts cell proliferation, invasion, and migration of pancreatic cancer through regulating miR-96/FOXO3. IUBMB Life. 2018;70(4):276–290. [DOI] [PubMed] [Google Scholar]
- [30].Torre LA, Bray F, Siegel RL, et al. Global cancer statistics, 2012. CA Cancer J Clin. 2015;65(2):87–108. [DOI] [PubMed] [Google Scholar]
- [31].El-Serag HB. Hepatocellular carcinoma. N Engl J Med. 2011;365(12):1118–1127. [DOI] [PubMed] [Google Scholar]
- [32].Wang F, Ying HQ, He BS, et al. Upregulated lncRNA-UCA1 contributes to progression of hepatocellular carcinoma through inhibition of miR-216b and activation of FGFR1/ERK signaling pathway. Oncotarget. 2015;6(10):7899–7917. [DOI] [PMC free article] [PubMed] [Google Scholar]
- [33].Valineva T, Yang J, Silvennoinen O. Characterization of RNA helicase A as component of STAT6-dependent enhanceosome. Nucleic Acids Res. 2006;34(14):3938–3946. [DOI] [PMC free article] [PubMed] [Google Scholar]
- [34].Wang X, Liu X, Fang J, et al. Coactivator P100 protein enhances STAT6-dependent transcriptional activation but has no effect on STAT1-mediated gene transcription. Anat Rec (Hoboken). 2010;293(6):1010–1016. [DOI] [PubMed] [Google Scholar]
- [35].Uttarkar S, Frampton J, Klempnauer KH. Targeting the transcription factor Myb by small-molecule inhibitors. Exp Hematol. 2017;47:31–35. [DOI] [PubMed] [Google Scholar]
- [36].Prouse MB, Campbell MM. The interaction between MYB proteins and their target DNA binding sites. Biochim Biophys Acta. 2012;1819(1):67–77. [DOI] [PubMed] [Google Scholar]
- [37].Leverson JD, Koskinen PJ, Orrico FC, et al. Pim-1 kinase and p100 cooperate to enhance c-Myb activity. Mol Cell. 1998;2(4):417–425. [DOI] [PubMed] [Google Scholar]
- [38].Kannan N, Eaves CJ. Tipping the balance: MTDH-SND1 curbs oncogene-induced apoptosis and promotes tumorigenesis. Cell Stem Cell. 2014;15(2):118–120. [DOI] [PubMed] [Google Scholar]
- [39].Sundstrom JF, Vaculova A, Smertenko AP, et al. Tudor staphylococcal nuclease is an evolutionarily conserved component of the programmed cell death degradome. Nat Cell Biol. 2009;11(11):1347–1354. [DOI] [PubMed] [Google Scholar]
- [40].Zagryazhskaya A, Surova O, Akbar NS, et al. Tudor staphylococcal nuclease drives chemoresistance of non-small cell lung carcinoma cells by regulating S100A11. Oncotarget. 2015;6(14):12156–12173. [DOI] [PMC free article] [PubMed] [Google Scholar]
- [41].Kumar PP, Emechebe U, Smith R, et al. Coordinated control of senescence by lncRNA and a novel T-box3 co-repressor complex. Elife. 2014;3. [DOI] [PMC free article] [PubMed] [Google Scholar]
- [42].Nie W, Ge HJ, Yang XQ, et al. LncRNA-UCA1 exerts oncogenic functions in non-small cell lung cancer by targeting miR-193a-3p. Cancer Lett. 2016;371(1):99–106. [DOI] [PubMed] [Google Scholar]
- [43].Su C, Gao X, Yang W, et al. Phosphorylation of Tudor-SN, a novel substrate of JNK, is involved in the efficient recruitment of Tudor-SN into stress granules. Biochim Biophys Acta. 2017;1864(3):562–571. [DOI] [PubMed] [Google Scholar]
- [44].Ran FA, Hsu PD, Wright J, et al. Genome engineering using the CRISPR-Cas9 system. Nat Protoc. 2013;8(11):2281–2308. [DOI] [PMC free article] [PubMed] [Google Scholar]
- [45].Ran FA, Hsu PD, Lin CY, et al. Double nicking by RNA-guided CRISPR Cas9 for enhanced genome editing specificity. Cell. 2013;154(6):1380–1389. [DOI] [PMC free article] [PubMed] [Google Scholar]
Associated Data
This section collects any data citations, data availability statements, or supplementary materials included in this article.