Abstract
Background/Aims
The aim of this study was to evaluate elasticity of benign and malign focal liver lesions and surrounding parenchyma as measured by acoustic radiation force impulse (ARFI).
Materials and Methods
34 hemangiomas, 4 focal nodular hyperplasia (FNH), 10 hepatocellular carcinoma (HCC) and 22 metastatic lesions from a total of 62 patients were examined with ARFI elastography. ARFI measurements for each tumor type were expressed as mean ± standard deviation for liver mass and surrounding parenchyma. ARFI values were compared between tumor types and surrounding parencyhma.
Results
The mean stiffness values were 2.15±0.73 m/s for hemangiomas (n=34), 3.22±0.18 m/s for FNH (n=4), 2.75±0.53 m/s for HCC (n=10) and 3.59±0.51 m/s for metastasis (n=22). Although there was not a significant difference between hemangiomas and HCC lesions in ARFI values (p>0.05), hemangiomas showed significantly different ARFI values from FNH and metastases (p<0.05). Also, there were significant differences in ARFI values between malignant and benign masses. The area under the receiver-operating characteristics curves for discriminating the malignant from benign liver masses was 0.826 (p<0.001). An ARFI value of 2.32 m/s was selected as cut-off value to differentiate malignant liver masses from benign ones (sensitivity: 0.93, specificity: 0.60).
Conclusion
Although currently ARFI is not a definitive method for the primary diagnosis of focal solid liver lesions, it provides additional important information non-invasively for differential diagnosis.
Keywords: Acoustic radiation force impulse imaging, elastography, ultrasonography
INTRODUCTION
Solid liver lesions are frequently encountered during abdominal examinations. Modern imaging modalities have a major role in the accurate characterization of solid liver masses and differential diagnosis for equivocal or indeterminate lesions (1–6). For patients with such lesions, the first and foremost goal is to differentiate between malignant focal solid liver lesions and benign lesions. Effective treatment of primary or metastatic liver lesions is possible only when they are detected at an early stage.
Conventional ultrasonography (US) is the first choice of imaging modality for focal liver lesions because of its low cost and ease of use (7). Color Doppler ultrasound, tissue harmonic imaging, and the newly introduced microbubble contrast agents considerably contribute to the characterization of such lesions (2,4,6,7). Computed tomography (CT) and magnetic resonance imaging (MRI) are second-line imaging methods used to assist in accurate characterization of lesions, but their high cost and low accessibility limit their use (2–5). Both methods have a number of disadvantages, including the risk for adverse effects, such as nephrotoxicity; requirement for contrast material; and exposure to ionizing radiation during CT. Contrast-enhanced US, CT, and MRI have a high diagnostic value for the identification of the morphology and vascularity of lesions (1–6). Nevertheless, the invasive methods may still be required for definite diagnosis.
Acoustic radiation force impulse (ARFI) imaging is a non-invasive, ultrasound-based elastography method that can be integrated in a conventional ultrasound machine to measure stiffness in deep tissues (8). The ARFI technology has several advantages. Firstly, it can be readily integrated in conventional ultrasound devices, and secondly, it offers elastography with a flexible metering box at variable depth, allowing the examination of specific sites, such as focal tumor and focal fatty infiltration of the liver (9). As with transient elastography, ARFI measurements provide significant information on liver fibrosis staging in chronic hepatic diseases (10–15). Many studies show that ARFI elastography offers valuable data for the characterization of focal solid liver lesions (9,16–20).
The aim of the present study was to investigate the contribution of ARFI elastography in the discrimination of focal solid lesions of the liver.
MATERIALS AND METHODS
Patient Population
This prospective study included 64 patients who were referred from other departments for hepatic examination using the conventional ultrasound and underwent ARFI elastography upon detection of liver masses in our department from January 2016 to October 2016. Approval for conducting the study was obtained from the Institutional Ethics Committee (Decision No: 2016/248). All patients signed informed consent before participating in the study. Two patients, including one with cholangiocellular carcinoma and one with focal fatty infiltration of the liver, were excluded from the study considering that their enrollment would not add adequate information for statistical analyses. Thus, the study was conducted with a total of 62 patients, including 26 females (42%) and 36 (58%) males. The mean (±standard deviation) age was 48.11±17.28 years (range, 25–89) for the female patients and 57.63±14.19 years (range, 30–83) for the male patients. During the study, 34 hemangiomas, four focal nodular hyperplasia (FNH), 10 hepatocellular carcinoma (HCC), and 22 metastatic lesions from a total of 62 patients were examined using ARFI elastography technique.
Hemangiomas and 3 FNH cases were diagnosed using MRI, CT, and US, and the other cases, including HCC and metastasis, were predominantly diagnosed using histopathological examination.
Equipment and ARFI Elastography Technique
Acoustic radiation force impulse elastography was conducted using an ultrasound device (Acuson S2000; Siemens) with a Virtual Touch tissue quantification software package. A convex probe with a bandwidth of 6 MHz was used for the procedure. Sonographic examination was performed with patients in supine and lateral position, and during ARFI measurements, the patients were requested to hold their breath without deep inspiration. The maximum depth of ARFI penetration was 8 cm; thus, measurements were obtained from masses at an accessible location (≤8 cm). Care was taken to obtain measurements at a depth of at least 2 cm away from the liver capsule. A metering box of the region of interest (ROI) of 10x5 (mm) was used for measuring masses and liver parenchyma. ARFI measurements were taken at five different locations for each mass and at two locations around the liver parenchyma. At the time of measurement, the potential presence of degeneration, such as necrotic, cystic, hemorrhagic, or calcified portions, was not included in the ROI, taking care not to comprise any vascular structures or biliary ducts. For each patient, the mean values obtained from both the liver mass and adjacent parenchyma and standard deviation values assigned by the device were recorded.
Statistical analysis
Statistical analyses were conducted using Statistical Package for Social Sciences (SPSS) statistical software version 20 (IBM Corp.; Armonk, NY, USA). Numerical variables were expressed as mean±standard deviation or number (percentage), as appropriate. For variables, compliance with normal distribution was tested using visual (histogram vs probability graphs) and analytical methods (Shapiro-Wilk test). One-way analysis of variance (ANOVA) was used to compare lesion depths by the type of diagnosis.
Since parenchymal values and lesion dimensions were not normally distributed among the types of diagnosis, the Bonferroni-corrected Mann-Whitney U-test was used for pairwise comparisons of study groups.
A receiver operating characteristic (ROC) analysis was used to estimate the diagnostic values of ARFI elastography for the discrimination of hemangioma, metastasis, HCC, FNH, and benign-malignant lesions. In case of significant borderline values, their sensitivity and specificity were calculated. When examining the areas under the ROC curves, values with a Type I error rate of 5% were considered to indicate statistically significant diagnostic performance of the test.
RESULTS
One-way ANOVA was used to compare the lesion depths by the type of diagnosis. Lesion depth was normally distributed among the diagnostic groups, as shown by the Shapiro-Wilk test results (p>0.05). However, since variance between groups was not homogeneous (p<0.05), the values estimated by ANOVA were used for heterogeneity. Based on these estimations, the lesion depths were found to differ by the type of diagnosis (p=0.001) (Figure 1). This difference led us to conduct pairwise comparison (post hoc) tests. Based on the ANOVA test results (Table 1), lesion depth differed between hemangiomas and metastases (p=0.02). Differences in lesion depths were also observed between FNH and HCC lesions and between HCC and metastatic lesions.
Figure 1.
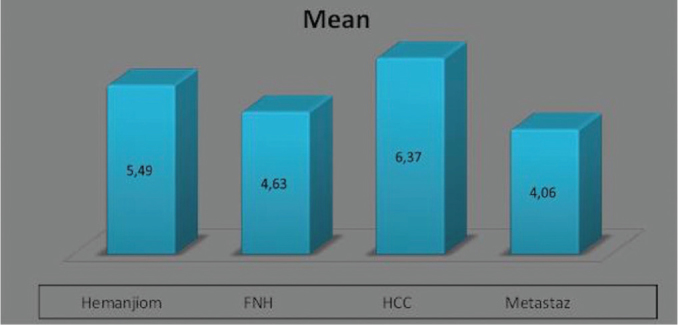
Mean lesion stiffness values by the type of *diagnosis
*FNH: focal nodular hyperplasia; **HCC: hepatocellular carcinoma
Table 1.
Pairwise comparison of groups for lesion depth; blue-shaded areas indicate lesions with a statistically significant difference in lesion depth
| Type of Diagnosis | Type of Diagnosis | p |
|---|---|---|
| Hemangioma | FNH | 0.418 |
| HCC | 0.198 | |
| Metastasis | 0.002 | |
| FNH* | Hemangioma | 0.418 |
| HCC | 0.028 | |
| Metastasis | 0.768 | |
| HCC** | Hemangioma | 0.198 |
| FNH | 0.028 | |
| Metastasis | 0.000 | |
| Metastasis | Hemangioma | 0.002 |
| FNH | 0.768 | |
| HCC | 0.000 |
FNH: focal nodular hyperplasia;
HCC: hepatocellular carcinoma
As lesion dimensions were not normally distributed among diagnostic groups (Shapiro-Wilk test, p<0.05), the Kruskal-Wallis H test was performed. Based on the test results, the lesion size values were found to differ by the type of diagnosis (p=0.005). Because of detection of difference, the Bonferroni-corrected Mann-Whitney U-test was performed for pairwise comparison of study groups. Lesion dimensions were found to differ significantly between the cases of HCC and hemangioma (p<0.001). Similarly, cases of HCC and metastasis significantly differed in the lesion size (p<0.001) (Table 2).
Table 2.
Pairwise comparison of groups for lesion size; blue-shaded areas indicate lesions with a statistically significant difference in lesion size
| Type of Diagnosis | Type of Diagnosis | p |
|---|---|---|
| Hemangioma | FNH* | 0.447 |
| HCC** | Hemangioma | 0.001 |
| Metastasis | Hemangioma | 0.926 |
| FNH | HCC | 0.106 |
| FNH | Metastasis | 0.429 |
| HCC | Metastasis | 0.005 |
FNH: focal nodular hyperplasia;
HCC: hepatocellular carcinoma
The mean parenchymal ARFI values were 1.20±0.47 m/s in patients with hemangioma, 2.35±0.74 m/s in those with HCC, 1.38±0.34 m/s in those with FNH, and 1.88±0.57 m/s in those with metastatic lesions (Figure 2).
Figure 2.
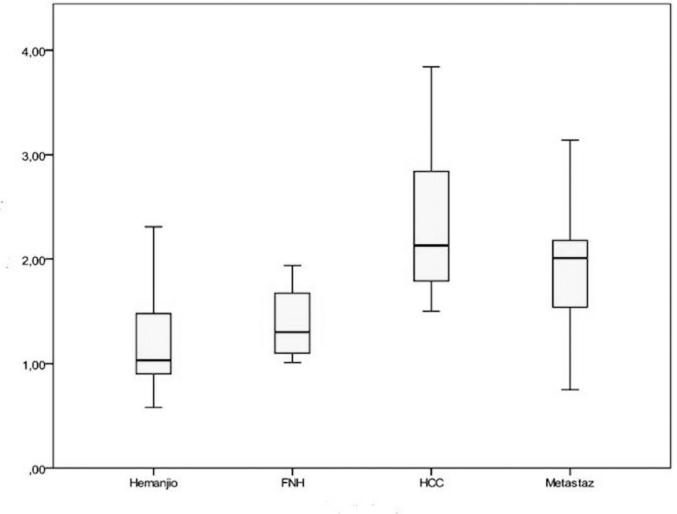
Parenchymal values (m/s) obtained using ARFI by the type of diagnosis
*FNH: focal nodular hyperplasia; **HCC: hepatocellular carcinoma
Normal distribution was not found for parenchymal values among diagnostic types (Shapiro-Wilk test, p<0.05); thus, the Kruskal-Wallis H test was conducted. The test results showed differences in parenchymal values by the type of diagnosis (p=0.001). Due to these differences, the Bonferroni-corrected Mann-Whitney U-test was performed for pairwise comparison of groups, whose results showed differences in parenchymal values between the cases of HCC and those of hemangioma (p=0.001). Likewise, parenchymal values differed between the cases of metastasis and hemangioma (p=0.001) (Table 3).
Table 3.
Pairwise comparison of parenchymal values among the diagnostic types; blue-shaded areas indicate lesions with a statistically significant difference in parenchymal values
| Type of Diagnosis | Type of Diagnosis | p |
|---|---|---|
| HCC* | Hemangioma | 0.001 |
| Metastasis | Hemangioma | 0.001 |
| FNH | HCC | 0.024 |
| FNH | Metastasis | 0.025 |
| HCC | Metastasis | 0.204 |
FNH: focal nodular hyperplasia;
HCC: hepatocellular carcinoma
As measured by ARFI, the mean mass lesion values were 2.15±0.73 m/s in patients with hemangioma, 2.75±0.53 m/s in those with HCC, 3.22±0.18 m/s in those with FNH, and 3.59±0.51 m/s in those with metastatic lesions (Figure 3).
Figure 3.
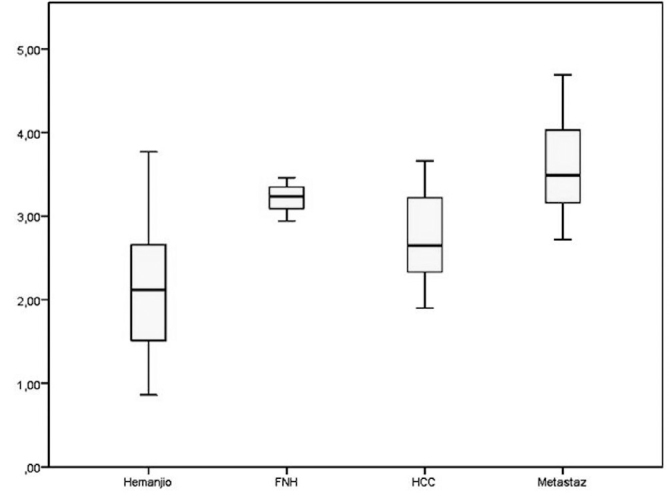
Mean mass lesion values (m/s) measured using ARFI shown by the type of diagnosis
*FNH: focal nodular hyperplasia; **HCC: hepatocellular carcinoma
The one-way ANOVA was used to compare mass lesion values among diagnostic types. The mass lesion values showed normal distribution among diagnostic groups according to the Shapiro-Wilk test (p>0.05). Also, variance between the diagnostic groups was homogeneous (Levene test, p>0.05). The ANOVA test results demonstrated differences in the mass lesion values by the type of diagnosis (p=0.001). Due to the detection of differences, a pairwise comparison (post hoc) test was performed. Tukey honestly significant difference test results showed differences in the mass lesion values between the cases of hemangioma and FNH (p=0.014) (Table 4).
Table 4.
Pairwise comparison of mass lesion values among the diagnostic groups; blue-shaded areas indicate lesions with a statistically significant difference in mass lesion values
| Type of Diagnosis | Type of Diagnosis | p |
|---|---|---|
| Hemangioma | FNH | 0.014 |
| HCC | 0.054 | |
| Metastasis | 0.000 | |
| FNH* | Hemangioma | 0.014 |
| HCC | 0.620 | |
| Metastasis | 0.748 | |
| HCC** | Hemangioma | 0.054 |
| FNH | 0.620 | |
| Metastasis | 0.008 | |
| Metastasis | Hemangioma | 0.000 |
| FNH | 0.748 | |
| HCC | 0.008 |
FNH: focal nodular hyperplasia;
HCC: hepatocellular carcinoma
The mean parenchymal values measured using ARFI were 1.22±0.47 m/s in the patients with benign lesions and 2.06±0.66 m/s in those with malignant lesions.
An ROC analysis was conducted with parenchymal values, which showed that the area under the receiver operating characteristics curves for discriminating the malignant tumors from benign tumors was 0.82 (p<0.001). This value is very close to 1 and indicates that the parenchymal values are sufficient to establish the tumor type (p<0.001) (Figure 4). Based on the ROC analysis, the parenchymal cut-off value was 1.49 m/s (sensitivity: 0.84, specificity: 0.78).
Figure 4.
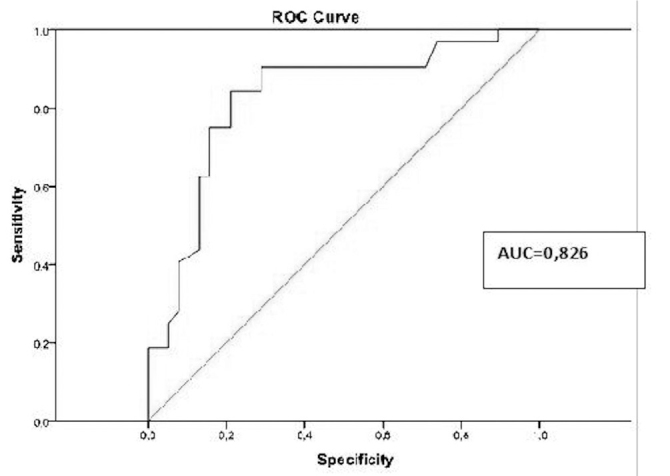
ROC curve from the surrounding parenchyma values measured using ARFI in patients with benign or malignant masses
The mean ARFI values were 2.26±0.78 m/s for benign mass lesions and 3.31±0.65 m/s for malignant mass lesions.
An ROC analysis conducted on the mass lesion values for benign/malignant tumor types showed that the area under the ROC curve was 0.83, which is again very close to 1, and the mass lesion values were considered to accurately indicate the tumor type (p<0.001) (Figure 5). In the ROC analysis, a cut-off value of 2.32 m/s (sensitivity: 0.93, specificity: 0.60) was found for mass lesions.
Figure 5.
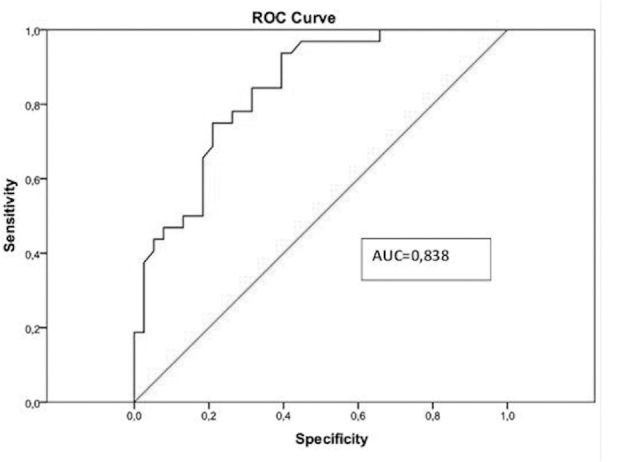
ROC curve from mean mass ARFI values for benign/malignant lesions.
DISCUSSION
Acoustic radiation force impulse elastography emerged as a new non-invasive modality that can provide useful information on stiffness (elasticity) of various tissues, such as pancreas, spleen, and kidney, and liver. Unlike the older elastography techniques, this novel method allows evaluation of deep tissue elasticity (stiffness) using shear wave velocities without the need for external compression owing to the virtual touch tissue quantification (21). ARFI elastography has a unique advantage of being integrated into a conventional ultrasound device and can provide real-time information during a conventional US examination (9,16).
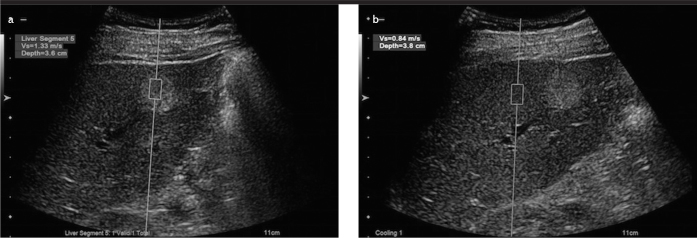
Hemangiomas comprise multiple vascular channels filled with blood; hence, they can be considered as soft lesions. However, some hemangiomas display rather high ARFI values. This is because hemangiomas with higher ARFI values have a greater amount of fibrotic septa and exhibit pathological patterns, such as sclerosis, thrombosis, or calcification, of the vessels within the lesion. Gallotti et al. (19) reported mean ARFI values of 2.30±0.95 m/s for hemangiomas. Also, Frulio et al. (22) found ARFI values of 2.14±0.49 m/s for hemangiomas. Similarly, the present study showed mean ARFI values of 2.15±0.73 m/s for hemangiomas, which is consistent with the findings of the aforementioned studies. Additionally, although hemangiomas are soft lesions, they showed higher ARFI values compared to those measured from the surrounding parenchyma (Figure 6, 7).
Figure 6. a, b.
ARFI value (m/s) measured at a mass lesion from a patient with hemangioma (a); parenchymal ARFI value (m/s) measured at a depth closest to the lesion (b)
Figure 7. a, b.
ARFI value (m/s) measured at a hyperechoic mass lesion from another patient with hemangioma (a); parenchymal ARFI value (m/s) measured at a depth closest to the lesion (b)
In the same study, Gallotti et al. (19) found mean ARFI values of 2.75±0.95 m/s for FNH, whereas Frulio et al. (22) reported corresponding values of 3.14±0.63 m/s. Consistent with previous studies, we found mean ARFI values of 3.22±0.18 m/s for FNH. Both our study and prior studies showed that FNH lesions display the highest ARFI values, second to metastatic lesions. This suggests that FNH is stiffer than other liver lesions. Additionally, the ARFI values for FNH were higher than those measured from their surrounding parenchyma (Figure 8).
Figure 8. a, b.
ARFI value (m/s) obtained from a mass lesion of a patient diagnosed with FNH. Note the significantly high value was obtained from the lesion (a); parenchymal ARFI value (m/s) measured at a depth closest to the lesion (b)
Gallotti et al. (19) reported mean ARFI values of 2.17±0.85 m/s for HCC lesions, whereas Frulio et al. (22) reported mean values of 2.40±1.01 m/s. In the present study, the mean ARFI values were 2.75±0.53 m/s for HCC lesions, which are consistent with previous studies, albeit slightly higher (Figure 9). This can be explained by the significantly heterogeneous internal structure of HCC lesions. Also, in about 40% of HCC lesions studied, the ARFI values were lower compared to their surrounding parenchyma. This is because HCC masses develop in the setting of chronic liver disease associated with diffuse hepatic fibrosis.
Figure 9. a, b.
ARFI value (m/s) obtained from a mass lesion (blurred appearance) of a patient diagnosed with HCC (a); parenchymal ARFI value (m/s) measured at a depth closest to the lesion (b)
Note that HCC mass had a lower value compared with the surrounding parenchyma in the setting of chronic liver disease
In the study by Gallotti et al. (19), the mean ARFI values were 2.87±1.13 m/s for metastatic lesions, and Frulio et al. (22) reported mean values of 3.00±1.36 m/s for these lesions. In the present study, the mean ARFI values for metastatic lesions were 3.59±0.51 m/s and represented the highest ARFI values among all tumor types (Figure 10). These values are higher than those reported in literature and partially consistent with previous studies. When we compared metastatic lesions with each other as a separate group, breast carcinoma metastasis were found to have somewhat higher ARFI values compared to other metastatic lesions, including adenocarcinoma metastasis. This can be considered in future studies. Additionally, values obtained from metastatic lesions were higher compared to their surrounding parenchyma.
Figure 10. a, b.
ARFI value (m/s) measured at a metastatic hypoechoic liver lesion from a patient with breast cancer (a); parenchymal ARFI value (m/s) measured at a depth closest to the lesion (b)
In the present study, there was a statistically significant difference between the ARFI values of hemangiomas and the ARFI values of FNH and metastasis (p<0.05) but not significantly different compared to the ARFI values of HCC (p>0.05). The ARFI values of FNH and metastasis were higher than those of other lesions without any statistically significant difference (p>0.05). However, HCC and metastatic lesions showed a statistically significant difference in the ARFI values (p<0.05).
In a study by Shuang-Ming et al. (23), the cut-off value for distinguishing benign lesions from malignant lesions was determined to be 2.22 m/s. In a meta-analysis conducted by Ying et al. (24), sensitivity of 86% and specificity of 89% was reported for the discrimination of benign and malignant lesions, which were significantly high. In the present study, the ARFI cutoff value for benign/malignant discrimination was approximately 2.32 m/s based on the ROC analysis (p<0.001), with an estimated sensitivity of 93% and specificity of 60%, which were significant.
In the current study, the small number of lesions, except hemangioma, HCC, and metastasis, partly limited our ability to test the statistical significance. Other limitations of the study include the inability of ARFI elastography to assess lesions at an inaccessible location (deeper than 8 cm), the difficulty in evaluating lesions in the left hepatic lobe due to the interference of the heart beat and poor compliance of patients to hold their breath without deep inspiration during sonographic examinations.
Acoustic radiation force impulse elastography is increasingly used as a novel modality and several studies were conducted to examine its role in the differential diagnosis of focal liver lesions.
While ARFI elastography fails to discriminate between the hemangiomas and HCC lesions, which constitute the majority of solid liver masses, it can be considered successful for distinguishing FNH from metastases.
Coupled with rather high rates of sensitivity (93%) and specificity (60%), ARFI elastography provides valuable information for the discrimination of benign and malignant liver masses.
Despite being a nondefinitive diagnostic method and the presence of variable results reported by previous studies, ARFI elastography provides additional data for discrimination between benign and malignant liver masses as suggested by the results of the present study.
Footnotes
Ethics Committee Approval: Ethics committee approval was received for this study from the Institutional Ethics Committee of Gaziantep University (Decision No: 2016/248).
Informed Consent: Written informed consent was obtained from the patients who participated in this study.
Peer-review: Externally peer-reviewed.
Author Contributions: Concept -F.G.Y.; Design -F.G.Y.; Supervision -F.G.Y.; Resource -F.G.Y.; Materials -E.A.; Data Collection and/or Processing -E.A.; Analysis and/or Interpretation -E.A., F.G.Y.; Literature Search -E.A.; Writing -E.A.; Critical Reviews -F.G.Y.
Conflict of Interest: The authors have no conflict of interest to declare.
Financial Disclosure: The authors declared that this study has received no financial support.
REFERENCES
- 1.Assy N, Nasser G, Djibre A, et al. Characteristics of common solid liver lesions and recommendations for diagnostic workup. World J Gastroenterol. 2009;15:3217–27. doi: 10.3748/wjg.15.3217. [DOI] [PMC free article] [PubMed] [Google Scholar]
- 2.Trillaud H, Bruel JM, Valette PJ, et al. Characterization of focal liver lesions with SonoVue-enhanced sonography: international multicenter-study in comparison to CT and MRI. World J Gastroenterol. 2009;15:3748–56. doi: 10.3748/wjg.15.3748. [DOI] [PMC free article] [PubMed] [Google Scholar]
- 3.Vilgrain V. Advancement in HCC imaging: diagnosis, staging and treatment efficacy assessments: hepatocellular carcinoma: imaging in assessing treatment efficacy. J Hepatobiliary Pancreat Sci. 2010;17:374–9. doi: 10.1007/s00534-009-0230-3. [DOI] [PubMed] [Google Scholar]
- 4.Hohmann J, Albrecht T, Hoffmann CW, Wolf KJ. Ultrasonographic detection of focal liver lesions: increased sensitivity and specificity with microbubble contrast agents. Eur J Radiol. 2003;46:147–59. doi: 10.1016/S0720-048X(02)00053-0. [DOI] [PubMed] [Google Scholar]
- 5.Numminen K, Isoniemi H, Halavaara J, et al. Preoperative assessment of focal liver lesions: multidetector computed tomography challenges magnetic resonance imaging. Acta Radiol. 2005;46:9–15. doi: 10.1080/02841850510016108. [DOI] [PubMed] [Google Scholar]
- 6.Quaia E, Calliada F, Bertolotto M, et al. Characterization of focal liver lesions with contrast-specific US modes and a sulfur hexafluoride-filled microbubble contrast agent: diagnostic performance and confidence. Radiology. 2004;232:420–30. doi: 10.1148/radiol.2322031401. [DOI] [PubMed] [Google Scholar]
- 7.Dietrich CF. Comments and illustrations regarding the guidelines and good clinical practice recommendations for contrast-enhanced ultrasound (CEUS) update. Ultraschall Med. 2008;29:188–202. doi: 10.1055/s-2008-1027799. [DOI] [PubMed] [Google Scholar]
- 8.Fahey BJ, Nightingale KR, Nelson RC, Palmeri ML, Trahey GE. Acoustic radiation force impulse imaging of the abdomen: demonstration of feasibility and utility. Ultrasound Med Biol. 2005;31:1185–98. doi: 10.1016/j.ultrasmedbio.2005.05.004. [DOI] [PubMed] [Google Scholar]
- 9.Fahey BJ, Nelson RC, Bradway DP, Hsu SJ, Dumont DM, Trahey GE. In vivo visualization of abdominal malignancies with acoustic radiation force elastography. Phys Med Biol. 2008;53:279–93. doi: 10.1088/0031-9155/53/1/020. [DOI] [PMC free article] [PubMed] [Google Scholar]
- 10.Friedrich-Rust M, Wunder K, Kriener S, et al. Liver fibrosis in viral hepatitis: noninvasive assessment with acoustic radiation force impulse imaging versus transient elastography. Radiology. 2009;252:595–604. doi: 10.1148/radiol.2523081928. [DOI] [PubMed] [Google Scholar]
- 11.Lupsor M, Badea R, Stefanescu H, et al. Performance of a new elastographic method (ARFI technology) compared to unidimensional transient elastography in the noninvasive assessment of chronic hepatitis C. Preliminary results. J Gastrointestin Liver Dis. 2009;18:303–10. [PubMed] [Google Scholar]
- 12.Fierbinteanu-Braticevici C, Andronescu D, Usvat R, Cretoiu D, Baicus C, Marinoschi G. Acoustic radiation force imaging sonoelastography for noninvasive staging of liver fibrosis. World J Gastroenterol. 2009;15:5525–32. doi: 10.3748/wjg.15.5525. [DOI] [PMC free article] [PubMed] [Google Scholar]
- 13.Sporea I, Sirli RL, Deleanu A, et al. Acoustic radiation force impulse elastography as compared to transient elastography and liver biopsy in patients with chronic hepatopathies. Ultraschall Med. 2011;32:46–52. doi: 10.1055/s-0029-1245360. [DOI] [PubMed] [Google Scholar]
- 14.Takahashi H, Ono N, Eguchi Y, et al. Evaluation of acoustic radiation force impulse elastography for fibrosis staging of chronic liver disease: a pilot study. Liver Int. 2010;30:538–45. doi: 10.1111/j.1478-3231.2009.02130.x. [DOI] [PubMed] [Google Scholar]
- 15.Rifai K, Cornberg J, Mederacke I, et al. Clinical feasibility of liver elastography by acoustic radiation force impulse imaging. Dig Liver Dis. 2011;43:491–7. doi: 10.1016/j.dld.2011.02.011. [DOI] [PubMed] [Google Scholar]
- 16.Cho SH, Lee JY, Han JK, Choi BI. Acoustic radiation force impulse elastography for the evaluation of focal solid hepatic lesions: preliminary findings. Ultrasound Med Biol. 2010;36:202–8. doi: 10.1016/j.ultrasmedbio.2009.10.009. [DOI] [PubMed] [Google Scholar]
- 17.Heide R, Strobel D, Bernatik T, Goertz RS. Characterization of focal liver lesions with acoustic radiation force impulse elastometry. Ultraschall Med. 2010;31:405–9. doi: 10.1055/s-0029-1245565. [DOI] [PubMed] [Google Scholar]
- 18.Davies G, Koenen M. Acoustic radiation force impulse elastography in distinguishing hepatic haemangiomata from metastases: preliminary observations. Br J Radiol. 2011;84:939–43. doi: 10.1259/bjr/97637841. [DOI] [PMC free article] [PubMed] [Google Scholar]
- 19.Gallotti A, D’Onofrio M, Romanini L, Cantisani V, Pozzi Mucelli R. Acoustic Radiation Force Impulse ultrasound imaging of solid focal liver lesions. Eur J Radiol. 2012;81:451–5. doi: 10.1016/j.ejrad.2010.12.071. [DOI] [PubMed] [Google Scholar]
- 20.Shuang-Ming T, Ping Z, Ying Q, Li-Rong C, Ping Z, Rui-Zhen L. Usefulness of acoustic radiation force impulse imaging in the differential diagnosis of benign and malignant liver lesions. Acad Radiol. 2011;18:810–5. doi: 10.1016/j.acra.2011.01.026. [DOI] [PubMed] [Google Scholar]
- 21.Gallotti A, D’Onofrio M, Mucelli RP. Acoustic Radiation Force Impulse technique in ultrasound with Virtual Touch tissue quantification of the upper abdomen. Radiol Med. 2010;115:889–97. doi: 10.1007/s11547-010-0504-5. [DOI] [PubMed] [Google Scholar]
- 22.Frulio N, Laumonier H, Carteret T, et al. Evaluation of liver tumors using acoustic radiation force impulse elastography and correlation with histologic data. J Ultrasound Med. 2013;32:121–30. doi: 10.7863/jum.2013.32.1.121. [DOI] [PubMed] [Google Scholar]
- 23.Shuang-Ming T, Ping Z, Ying Q, Li-Rong C, Ping Z, Rui-Zhen L. Usefulness of acoustic radiation force impulse imaging in the differential diagnosis of benign and malignant liver lesions. Acad Radiol. 2011;18:810–5. doi: 10.1016/j.acra.2011.01.026. [DOI] [PubMed] [Google Scholar]
- 24.Ying L, Lin X, Xie ZL, Tang FY, Hu YP, Shi KQ. Clinical utility of acoustic radiation force impulse imaging for identification of malignant liver lesions: a meta-analysis. Eur Radiol. 2012;22:2798–805. doi: 10.1007/s00330-012-2540-0. [DOI] [PubMed] [Google Scholar]


