

Abstract
Osteoporosis is a prevalent bone condition, characterised by low bone mineral density and increased fracture risk. Currently, the gold standard for identifying osteoporosis and increased fracture risk is through quantification of bone mineral density using dual energy X-ray absorption. However, many studies have shown that bone strength, and consequently the probability of fracture, is a combination of both bone mass and bone ‘quality’ (architecture and material chemistry). Although the microarchitecture of both non-fracture and osteoporotic bone has been previously investigated, many of the osteoporotic studies are constrained by factors such as limited sample number, use of ovariectomised animal models, and lack of male and female discrimination. This study reports significant differences in bone quality with respect to the microarchitecture between fractured and non-fractured human femur specimens. Micro-computed tomography was utilised to investigate the microarchitecture of femoral head trabecular bone from a relatively large cohort of non-fracture and fracture human donors. Various microarchitectural parameters have been determined for both groups, providing an understanding of the differences between fracture and non -fracture material. The microarchitecture of non-fracture and fracture bone tissue is shown to be significantly different for many parameters. Differences between sexes also exist, suggesting differences in remodelling between males and females in the fracture group. The results from this study will, in the future, be applied to develop a fracture model which encompasses bone density, architecture and material chemical properties for both female and male tissues.
Keywords: micro computed tomography (μ-CT), osteoporosis, aging, microarchitecture, trabecular bone, femoral head
Osteoporosis (OP) is a prevalent bone condition around the world, characterised by low bone mineral density and increased fracture risk. It is estimated that 1 in 3 women and 1 in 5 men are at risk of an osteoporotic fracture (https://www.iofbonehealth.org/facts-statistics). The probabilities increase proportionally with an aging population as osteoporosis is more likely to affect the elderly. The economic impact of osteoporosis is well known i.e. the UK’s National Health Service (NHS) spends > £2.0 billion per annum on OP hip fractures and their associated costs (https://thebms.org.uk/2010/10/breaking-point-osteoporosis-report/), but more impor-tantly it has a social impact resulting in the loss of mobility and an increased chance of mortality. Hip, vertebrae and wrist fractures are commonly associated with osteoporosis. In the year 2000, there were estimated 9 million new osteoporotic related fractures of which, 1.6 million were at the hip, 1.7 million were at the wrist and 1.4 were clinical vertebral fractures (www.iofbonehealth.org/facts-statistics). However, it is widely recognised that hip fractures lead to the largest risk of loss of independence and/or death [1]. Up to 20% of individuals die within the first year of a hip replacement, although pre-existing medical conditions often exist [2]. Of those individuals who survive, less than half regain their previous level of function [2]. As osteoporosis is symptomless, silent and progressive, the need for an accurate fracture prediction model is crucial for effective patient management. Currently, the gold standard for identifying osteoporosis and increased fracture risk is through quantification of bone mineral density (BMD) [3], using dual energy X-ray absorption (DEXA) [4]. However the use of BMD to diagnose osteoporosis is not without limitation, with a study by Wainwright reporting that 54% of new hip fractures occurred in women who did not have osteoporosis according to their BMD [5]. Thus, there is a need to identify other factors which influence bone strength and consequently fracture risk.
Literature suggests bone strength is a combination of bone density and ‘bone quality’[6-9], with bone quality referring to bone architecture (i.e. macro and micro) and material chemistry. Advances in technology, in particular micro computed tomography (μ-CT), have enabled new methods for accurately describing bone quality. For example, there have been a number of studies which investigate the change in trabecular microarchitecture with age using µ-CT [10-13]. These studies tend to have large specimen numbers (n > 90) but do not consider bone which has fractured due to diseases such as osteoporosis or osteoarthritis. A small number of studies (possibly due to the difficulty of obtaining human bone, especially osteoporotic specimens) have shown microarchitectural properties of bone potentially offer a superior way to differentiate between diseased bone which has fractured when compared to healthy controls (non - fractured tissue) [14-16]. Bone chemistry is more complex, with studies often providing contradicting results and conclusions [9, 17-21]. Unfortunately, many of the studies which investigate the quality of osteoporotic bone are limited by relatively low sample numbers, where n ≤ 15 for these studies [22-26]. Further, previous studies have often assumed a common remodelling mechanism for males and females. Thus groups of samples are not differentiated according to sex [10, 27, 28], which may lead to confounding findings. There is some recent evidence that, with aging, trabecular bone loss occurs through thinning of the trabeculae in males, whilst in females, perforation of trabeculae occurs, arguably this is due to sex hormone deficiencies [8, 29-32]. However, it may be argued this observation is due to the trabeculae initially being thinner in males and/or the resorption of the trabeculae occurs more aggressively and for longer in females due to menopause.
Using micro computed tomography (µ-CT), this study reports age-related microarchitectural changes in trabecular bone collected from the femoral head of 83 non-fracture individuals, within a wide age range of 20 - 93 years. The results differentiate between males and females, crucial for understanding any potential hormone dependent changes and developing a reliable fracture predictive model. Importantly, this study also compares non-fractured specimens to the microarchitecture of trabecular bone obtained from individuals who suffered a femoral neck fracture. The results provide an insight into quantified trabecular changes to bone modelling and remodelling caused not only by age and disease but also by sex. Previous CT studies have either examined mixed populations i.e. with no osteoporosis diagnosis [27, 33] or investigated osteoporotic tissue utilising specimens from females only [22-26, 34]. Other studies have exploited ovariectomised animal models [35-37] and often small osteoporotic sample numbers are employed [22, 25, 26, 38]. Therefore, we report herein the results of an aging study that enables a male/ female comparison, and also a fracture/non-fracture comparison for both males and females. Crucially, this is one of the first studies of its kind to compare male and female specimens from both non-fracture and fracture tissue, in order to investigate the potential modelling and remodelling differences between sexes. The findings of this work are fundamental to the development of new diagnostic tests for osteoporosis, as they provide a bench mark for the microarchitectural parameters which should be considered when developing a fracture risk model.
MATERIALS AND METHODS
Bone Specimens
A sample set of 37 femoral heads were collected from osteoporotic patients who had suffered trauma fractures at the femoral neck and consequently required endoprosthetic hip replacement surgery. Ethical approval for the collection and use of these specimens was provided by Gloucestershire NHS trust REC (see acknowledge-ments). Non-fracture femoral head specimens were collected from 83 cadavers within the Melbourne Femur Collection. The donors died of natural or accidental causes, with no known diseases. Ethical approval for the collection and use of these specimens was provided by The University of Melbourne. The UK and Australian specimens were selected as they were the most accessible human samples in sufficient numbers to our research group. All individuals were Anglo-Celtic and followed western lifestyles. For both the fracture and non-fracture specimens, the donors were randomly selected. Population characteristics for both fracture and non-fracture specimens are provided in table 1.
Table 1.
Population characteristics for fracture and non-fracture groups, differentiated according to sex.
| Fracture
|
Non - Fracture
|
|||
|---|---|---|---|---|
| Male | Female | Male | Female | |
| Donors | 7 | 30 | 44 | 39 |
| Number of Specimens | 23 | 58 | 44 | 39 |
| Age Range (yrs) | 74 - 84 | 59 - 91 | 21 - 93 | 20 - 90 |
| Age Mean (yrs) | 76.90 ± 2.72 | 82.47 ± 6.43 | 64.75 ± 19.00 | 66.18 ± 17.92 |
| Weight Range (kg) | 70 - 83 | 41 - 79 | 53 - 106 | 40 - 121 |
| Weight Mean (kg) | 76.36 ± 7.35 | 61.28 ± 8.95 | 78.59 ± 15.32 | 66.79 ± 19.77 |
| Height Range (cm) | 178 - 179 | 155 - 173 | 157 - 192 | 145 - 169 |
| Height Mean (cm) | 178.13 ± 0.65 | 163.91 ± 5.23 | 173.91 ± 8.53 | 159.63 ± 6.76 |
Sample Preparation
Trabecular bone was obtained and analysed for this study from the femoral head. Fracture and non-fracture specimens were obtained by a combination of trephine coring and mechanical cutting. The specimens were sampled randomly to avoid any orientational bias. Overall the strategy was to select random samples with respect to femoral head location although each sample was cut to include tissue from at least two quadrants of the head. For further information regarding sample preparation refer to [39]. The volume of the specimens ranged from approximately 1 - 3.5 cm3. Whilst archived the samples were stored at -70°C and were stored at -20°C during data collection. Prior to imaging, the specimens were cleaned using a high pressure warm water jet to remove bone marrow from within the trabecular spaces.
Micro Computed Tomography (μCT)
The specimen microarchitecture was examined with micro computed tomography (μCT). Each specimen was scanned using a Nikon CT H225 (X-Tek Systems Ltd, Tring, Hertfordshire, UK) cone beam μCT scanner operated at 35 kV, and 115 μA. The geometric magnification produced a voxel dimension range of 15 - 25 μm for the fracture and non-fracture group specimens. Noise reduction and beam hardening corrections were applied to the data and VG Studio Max 2.2 (Volume Graphics GmbH, Heidelberg, Germany) utilised to visualise and quantify several microarchitectural features. These included trabecular thickness (TbTh), spacing (TbSp) and number (TbN), surface area (BS), material volume (BV) and total volume (TV). QRM µ-CT-HA (QRM GmbH, 91096 Möhrendorf, Germany) calibration phantoms, which differed in known volumetric tissue mineral density (vTMD) values, were scanned and reconstructed under the same conditions as the specimens. The mean grey scale values taken from the attenuation histograms for these phantoms were then used to construct a calibration curve of volumetric tissue mineral density (vTMD) values and grey scales. This allowed calculation of tissue mineral density values for the trabecular specimens. vTMD values were then used to determine volumetric bone mineral density values (vBMD) according to:-.
vTMD refers to the density measurement restricted to within the volume of calcified bone tissue, and excludes any surrounding soft tissue, whereas vBMD is the combined density in a well-defined volume. BoneJ© [40] was employed at a second stage to calculate additional microarchitectural parameters such as structure model index (SMI), which gives an indication of the trabecular geometry, with 0 suggesting a plate like structure, 3 signifying rod like trabeculae, 4 a sphere and < 0, concave. The authors recognise there are some limitations to SMI values as highlighted by Salmon et al. (2015). SMI calculations exploit the changes in surface curvature which occur as a structure varies from spherical, to cylindrical to planer [41]. SMI calculations are based on the assumption that the entire bone surface is convex and that the curvature differential is positive at all points on the surface. However, it has been argued that the intricate connections within the trabecular continuum could be predominantly concave in nature, which could potentially produce regions of negative differential [41]. This is highlighted by Salmon et al. who state ‘because SMI is set up to report a single figure summarising an entire bone surface, an SMI of 0 (ostensibly plate-like) can result from a surface that has an SMI of +1 on its convex portions and -1 on its concave portions’ [41].
Statistical Analysis
Linear regression analysis was carried out to statistically assess the correlation between the various microarchitecture parameters and age for the non-fracture group. The magnitude of the trend was estimated over a 5-year period. A general linear model ANOVA statistical analysis was also undertaken to determine significant differences between the parameters measured for age matched fracture and non-fracture groups. Anderson-Darling tests were carried out to determine whether the data values are normally distributed.
RESULTS
Micro-CT (µ-CT) three-dimensional rendered images from each group, non-fractured and fractured, are provided in Figure 1. The average values and associated errors of the microarchitectural properties derived from the µ-CT reconstructions are presented in table 2. Results of the statistical testing applied to each characteristic parameter are summarised within tables 3 and 4. The p values and R2 values calculated from linear regression statistical analysis to quantify the correlation between the microarchitecture parameters and age for the non-fracture group, are provided in table 4. The rate of change in the parameters for the non-fracture group over a period of 5 years, are also provide in table 4.
Figure 1.
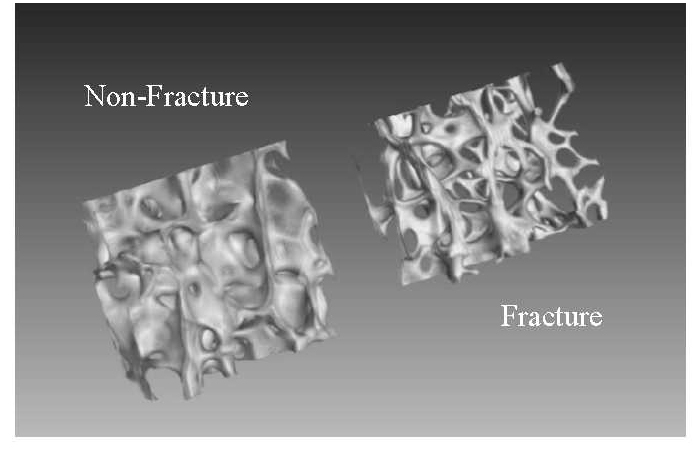
Micro-CT (µ-CT) three-dimensional rendered images from non-fracture (left) and fracture (right) female specimens of the same age (84 yrs).
Table 2.
Average values (in bold) and the associated errors (SEM) for the microarchitectural parameters for fracture and non-fracture groups.
| Fracture
|
Non - Fracture
|
|||
|---|---|---|---|---|
| Females | Males | Females | Males | |
| BV/TV | 0.18 ± 0.01 | 0.18 ± 0.01 | 0.30 ± 0.01 | 0.32 ± 0.01 |
| BS/BV (mm-1) | 16.06 ± 0.40 | 17.84 ± 0.53 | 10.83 ± 0.24 | 10.10 ± 0.22 |
| TbTh (mm) | 0.13 ± 0.004 | 0.11 ± 0.003 | 0.19 ± 0.004 | 0.20 ± 0.005 |
| TbN (mm-1) | 1.42 ± 0.03 | 1.60 ± 0.05 | 1.60 ± 0.02 | 1.57 ± 0.03 |
| TbSp (mm) | 0.60 ± 0.02 | 0.52 ± 0.02 | 0.44 ± 0.01 | 0.45 ± 0.01 |
| SMI | 1.81 ± 0.06 | 1.85 ± 0.07 | 1.14 ± 0.05 | 1.15 ± 0.06 |
| BMD (g cm-3) | 0.30 ± 0.01 | 0.31 ± 0.02 | 0.50 ± 0.02 | 0.52 ± 0.02 |
| TMD (g HA cm-3) | 1.61 ± 0.01 | 1.65 ± 0.01 | 1.64 ± 0.01 | 1.62 ± 0.01 |
Table 3.
P-values for age matched ANOVA analysis of fracture (F) and non-fracture (NF) groups differentiated according to sex, for each microarchitectural parameter.
| ANOVA
|
||||
|---|---|---|---|---|
| Non - Fracture vs Fracture (Age Matched)
| ||||
| Male n = 21 (NF); n = 21 (F) |
Female n = 22 (NF); n = 47 (F) |
|||
|
| ||||
| p - value | Mean difference | p - value | Mean difference | |
| BV/TV | < 0.01 | 0.10 ± 0.02 | < 0.01 | 0.10 ± 0.01 |
| BS/BV (mm-1) | < 0.01 | -7.15 ± 0.63 | < 0.01 | -4.81 ±0.51 |
| TbTh (mm) | < 0.01 | 0.07 ± 0.01 | < 0.01 | 0.05 ± 0.01 |
| TbN (mm-1) | * | -0.12 ± 0.06 | < 0.05 | -0.15 ± 0.05 |
| TbSp (mm) | * | 0.03 ± 0.03 | < 0.01 | -0.14 ± 0.03 |
| SMI | < 0.01 | -0.60 ± 0.12 | < 0.01 | -0.60 ± 0.10 |
| BMD (g cm-3) | <0.01 | 0.15 ± 0.03 | < 0.01 | 0.18 ± 0.02 |
| TMD (g HA cm-3) | * | -0.04 ± 0.02 | < 0.05 | 0.05 ± 0.01 |
indicates a p value > 0.05. n refers to the number of specimens. The mean difference between the non-fracture and fracture groups is also reported.
Table 4.
P-values and R2 calculated from linear regression statistical analysis when comparing the various microarchitecture parameters and age for non-fracture males and females.
| Linear Regression Analysis
|
||||||
|---|---|---|---|---|---|---|
| Non - Fracture Correlations with Age
| ||||||
| Male | Female | |||||
|
| ||||||
| p -value | R2 | Δ (per 5 yrs) | p -value | R2 | Δ (per 5 yrs) | |
| BV/TV | < 0.01 | 0.19 | -0.007 ± 0.002 | < 0.01 | 0.22 | -0.007 ± 0.002 |
| BS/BV (mm-1) | * | 0.04 | * | < 0.05 | 0.11 | 0.136 ± 0.065 |
| TbTh (mm) | * | 0.01 | * | < 0.05 | 0.13 | -0.003 ± 0.001 |
| TbN (mm-1) | < 0.01 | 0.31 | -0.028 ± 0.006 | < 0.05 | 0.15 | -0.016 ± 0.006 |
| TbSp (mm) | < 0.01 | 0.29 | 0.012 ± 0.002 | < 0.01 | 0.23 | 0.009 ± 0.003 |
| SMI | * | 0.01 | * | * | 0.09 | * |
| BMD (g cm-3) | < 0.01 | 0.19 | -0.012 ± 0.004 | < 0.05 | 0.14 | -0.010 ± 0.004 |
| TMD (g HA cm-3) | * | 0.02 | * | * | 0.01 | * |
denotes a p value > 0.05. For those parameters were a significant trend was observed, the rate of change (∆) per 5 years is also reported.
Volumetric Bone Mineral Density (vBMD)
With age, the trend line correlation coefficients for BMD were relatively small (R2 = 0.19 and R2 = 0.14 respectively for non-fracture males and females), but significant (p < 0.01) for both sexes (Fig. 2, Table 4). The gradient of the trend line indicated a decrease in BMD with age for non-fracture males and females, with a rate of change per 5 years of -0.012 ± 0.004 and -0.010 ± 0.004 g cm-3 respectively (Table 4). No significant difference was observed between the two sexes in the non-fracture group. vBMD values for the fracture group were significantly lower (p < 0.01) than the non-fracture group for both sexes (Fig. 2, Table 3).
Figure 2.
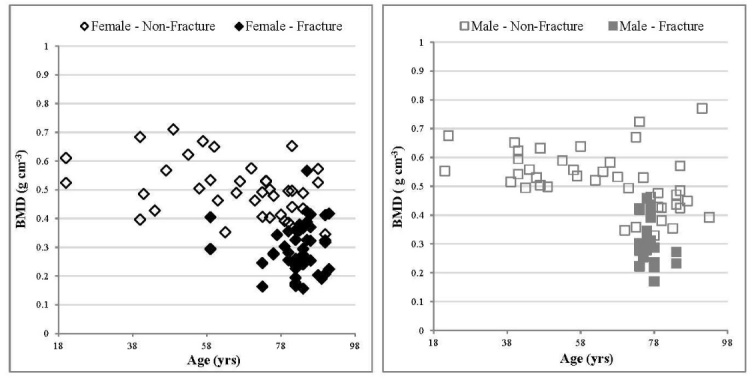
Relationship between BMD values and age, comparing fracture and non-fracture groups, female specimens (left) and male specimens (right). With age, a significant correlation was observed for both non-fracture males and females. The linear trend correlation coefficients for non-fracture males and females were p < 0.01, R2 = 0.19 and p < 0.05, R2 = 0.14 respectively. Errors have been excluded from the graphs for clarity. For the non-fracture group, each data point represents one donor. For the fracture group each data point represents an individual specimen several of which may arise from a single donor.
Bone Volume Fraction (BV/TV)
As with BMD, the age trend line correlation coefficients for bone volume to total volume (BV/TV) were relatively small (R2 = 0.19 and R2 = 0.22 respectively for non-fracture males and females), but significant (p < 0.01) for both sexes (Table 4). The gradient of the trend line indicates a decrease in BV/TV with age for non-fracture males and females, with a rate of change per 5 years of -0.007 ± 0.002 for both sexes (Table 4). No significant difference was observed between the two sexes in the non-fracture group. When age matched, BV/TV values for the fracture group were significantly lower (p < 0.01) than the non-fracture group for both sexes (Table 3). No significant difference between the fracture males and females was observed for BV/TV.
Trabecular Thickness (TbTh)
No significant correlation between age and trabecular thickness (TbTh) was observed for the male specimens in the non-fracture group (p > 0.05). However, although the trend line correlation coefficients for TbTh were relatively small for non-fracture female specimens (R2 = 0.13), they were significant (p < 0.05) (Fig. 3, Table 4). The gradient of the trend line indicates a decrease in TbTh with age for non-fracture females, with a rate of change per 5 years of -0.003 ± 0.001 mm (Table 4). A significant difference was observed between the two sexes in the non-fracture group for TbTh (p < 0.05), with an average of 0.20 ± 0.005 mm for males and 0.19 ± 0.004 mm for females. The TbTh values for the fracture group are significantly lower for both sexes than the non-fracture group (p < 0.01) as reported in tables 2 and 3.
Figure 3.
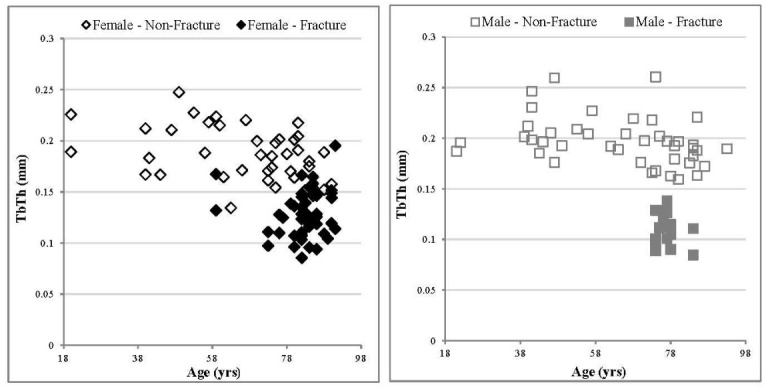
Relationship between TbTh values and age, comparing fracture and non-fracture groups, female specimens (left) and male specimens (right). There was no significant correlation with age for non-fracture males, whereas a significant correlation for non-fracture females was observed. The linear trend correlation coefficients for non-fracture females were p < 0.05, R2 = 0.13. Errors have been excluded from the graphs for clarity. For the non-fracture group, each data point represents one donor. For the fracture group each data point represents an individual specimen several of which may arise from a single donor.
Trabecular Number (TbN)
The relatively small correlation coefficients for non-fracture males and females (R2 = 0.31 and R2 = 0.15 respectively) were significant (p < 0.05) for both sexes. (Fig. 4, Table 4). The gradient of the trend line indicates a decrease in TbN with age for non-fracture males and females, with a rate of change per 5 years of -0.028 ± 0.006 and -0.016 ± 0.006 mm-1 respectively (Table 4). No significant difference between the non-fracture males and females was observed. For this parameter, values for the female specimens in the fracture group were significantly lower than their equivalent age matched specimens in the non-fracture group (p < 0.05, Table 2 & 3). This was not the case for the males, where no significant difference was observed between the non-fracture and fracture groups.
Figure 4.

Relationship between TbN values and age, comparing fracture and non-fracture groups, female specimens (left) and male specimens (right). With age, a significant correlation was observed for both non-fracture males and females. The linear trend correlation coefficients for non-fracture males and females were p < 0.01, R2 = 0.19 and p < 0.05, R2 = 0.15 respectively. Errors have been excluded from the graphs for clarity. For the non-fracture group, each data point represents one donor. For the fracture group each data point represents an individual specimen several of which may arise from a single donor.
Specific Surface Area (BS/BV) & Structure Model Index (SMI)
For the non-fracture male specimens, there was no significant correlation in specific surface area values, (bone surface / bone volume, BS/BV), with age (p > 0.05). Although the trend line correlation coefficients for BS/BV were relatively small for non-fracture female specimens (R2 = 0.11), they were significant (p < 0.05) (Table 4). The gradient of the trend line indicates an increase in BS/BV with age for non-fracture females, with a rate of change per 5 years of 0.136 ± 0.065 mm-1 (Table 4). Further, a significant difference in this parameter was observed between non-fracture males and females, with female specimens exhibiting on average, larger BS/BV values (p < 0.05, Table 2). BS/BV values for both males and females are significantly greater in the fracture group in comparison to the age matched non-fracture specimens (Table 2). This finding was also observed for the structure model index (SMI) values. No significant correlation was observed between SMI and age for the non-fracture groups (p > 0.05).
Volumetric Tissue Mineral Density (vTMD)
For both males and females in the non-fracture group, there was no significant correlation in volumetric tissue mineral density (vTMD) values, (which provide density measurements restricted to the volume of calcified bone tissue), with age (Fig. 5, Table 4). No significant different was observed between the female and male non-fracture group (Tables 2 & 3). Interestingly, vTMD values from female specimens in the fracture group were found to be significantly lower than their age matched non-fracture counterparts (p < 0.05, Tables 2 & 3), whereas no significant difference were observed between the male groups.
Figure 5.

Relationship between TMD values and age, comparing fracture and non-fracture groups, female specimens (left) and male specimens (right). With age, no significant correlation was observed for non-fracture males and females (p > 0.05). Errors have been excluded from the graphs for clarity. For the non-fracture group, each data point represents one donor. For the fracture group each data point represents an individual specimen several of which may arise from a single donor.
The authors recognise an increased probability of type I errors in studies where large number of statistical tests are performed. However, this study mitigates against this by carrying out general linear model ANOVA analysis. As highlighted in table 3, all microarchitectural parameters are significantly different between age matched fracture and non-fracture females (p < 0.05); whilst for males all parameters except TbN, TbSp and vTMD are significantly different (p < 0.01).
DISCUSSION
Overall, the characteristic values were similar to those presented previously for osteoporotic and non-fracture human tissues [10, 12, 22, 23, 25, 26, 33, 42]. A potential confounding element of the study was comparing tissue from UK donors to those of Australian donors. We carefully considered the legitimacy of comparing specimens from Australian and UK populations. All donors were Anglo-Celtic with a common western lifestyle. Unfortunately, no directly comparable previous UK non-fractured femoral head characteristics are available. However, we found no significant differences in mean values of CT characteristics between our Australian non-fracture group and a pooled population (3 US and 5 European) from previous studies of femoral head features [27, 33, 42-47]. Further, the incidence of hip fracture is the same in both UK and Australian populations. Although age alone was considered for this study, there could potentially be other uncontrolled confounding influences such as body mass index (BMI), calcium supplements, diet and physical activity. Future work investigating the affect these confounders may have on the microarchitecture is required.
The values for vBMD presented in this study agree with previous studies [48, 49]. Repeated findings are that vBMD decreases with age due to loss of trabeculae and osteoporotic patients have significantly lower vBMD values than their non-fracture counterparts, due to the loss of mineral mass [50]. Although BMD measured by DEXA is currently the gold standard for determining fracture risk, the magnitude of vBMD population variability at any age (see Fig. 2) strongly indicates why 54% of new hip fractures occur in woman with normal BMD values [5]. For example, several individuals within the non-fracture group have a significantly lower vBMD than the mean for that age group. This highlights the need for a more comprehensive fracture prediction model which incorporates microarchitecture parameters associated with bone.
This study supports the generally held view that bone loss is observed with increasing age [10, 12, 48]. The architectural parameters reported here suggest that this is caused by a steady loss and/thinning of the trabeculae within non-fracture patients. With increasing age, trabeculae become more rod like in geometry as indicated by increasing SMI values, assuming that this material system acts conventionally as predicated by SMI (see previous section regarding the limitations of SMI analysis), resulting in a greater specific surface area (>BS/BV). The majority of the microarchitecture properties between non-fracture males and females were not significantly different. Significant differences were observed between TbTh and specific surface area (BS/BV), with the males having slightly greater TbTh values and consequently lower BS/BV values than the females. This may suggest remodelling of bone differs between sexes for the non-fracture specimens when considering TbTh and BS/BV only and/or differences are too small to be detected given the level of precision employed. This is in contrast to a view proposed by recent studies where trabecular bone loss with age is thought to occur predominately through thinning of the trabeculae and reduced bone formation in males, whilst in females, perforation and complete removal of the trabeculae occurs leading to a loss of connectivity between trabeculae [8, 30-32]. However, this trend was observed in the fracture group specimens. This is consistent with previous results where a decline in TbN was observed in woman at the onset of menopause, which consequently caused an overall decline in estimated bone strength [13].
The fracture group microarchitecture parameters were in most cases significantly different to those of the age matched non-fracture group. The results, as previously reported [14, 15], show the loss of bone is significantly greater in the fracture groups. As reported elsewhere [51], the loss of bone appears to occur predominately through thinning of the trabeculae for the fracture male specimens, without a significant loss in the number of trabeculae. In contrast, for the fracture female specimens thinning of the trabeculae results in a reduction in the number of trabeculae. This suggests the remodelling of osteoporotic bone may differ according to sex within the fracture group. It is proposed that the origin of such a difference could be influenced by or be caused by fundamental differences in bone mineral chemistry. Further, the results suggest that in order to provide an accurate fracture predication model based on vBMD and microarchitecture parameters, it may be crucial to develop two models; one for females and one for males.
The volumetric tissue mineral density (vTMD) values, calculated from the grey scale attenuation of the µ-CT images, may be consistent with a change in bone chemistry. Many studies have investigated various parameters associated with bone mineral chemistry, although many report conflicting results. For example, hydroxyapatite (HA) crystallite size has been reported to increase [17, 24, 52, 53], decrease [39, 54] or remain constant [20] with age and in osteoporotic tissue. For the non-fracture group, this study did not demonstrate any change of vTMD with age. This may suggest that either there is no change in bone chemistry with age, or the changes are below the µ-CT detection limit for vTMD. Crucially, vTMD values for the female fracture group are significantly lower than that of the non-fracture female group. It is proposed that this is due to a change in the mineral physico-chemical properties, rather than a reduction of the mineral/collagen ratio. For example, a change in the amount of carbonate, which accounts for 4 - 8 wt. % of bone mineral [55], would modify vTMD measured values. In particular, an increase in B - type carbonate substitution (carbonate for phosphate), would result in a lower tissue mineral density. The density of stoichiometric HA has been reported as ~ 3.2 g cm-3 [56], and literature has shown this to decrease with the incorporation of increasing amounts of carbonate [57, 58]. Other ions can also substitute into the apatite lattice, causing changes to density, for example fluoride (F-), but these substitutions are thought to be at a much lower level than carbonate. This is consistent with previous research which reported a significant increase in the carbonate content of fracture tissue when compared to age matched non-fracture specimens [39].
Conversely, no significant difference was observed between the fracture male specimens and the non-fracture specimens when considering the vTMD values. However, the vTMD is significantly greater for the fracture male specimens than the female fracture specimens, which may be due to a change in the mineral chemistry and/ or the organic component in bone. A significantly smaller amount of collagen has previously been observed in osteoporotic specimens [18, 59, 60], which may result in an increase in tissue density. The density of collagen is lower than that of bone mineral, therefore a change in mineral to organic content could result in an average increase in vTMD values. Further analysis would need to be carried out to investigate the organic content, with the hypothesis that the male fracture specimens would exhibit a significant difference in the mineral to organic content compared to fracture female specimens.
The differences in the vTMD values between males and females in the fracture group, as previously hypothesised, maybe due to remodelling differences caused by different hormonal changes in men and women [8, 29-32]. These remodelling differences may indicate two distinct mechanisms for the formation of OP tissue. Male OP sufferers potentially exhibit a change in the mineral to organic content, leading to loss in ductility and an increase in mineral brittleness whereas, for female OP sufferers, a physico-chemical change in the mineral occurs due to an increase in carbonate content.
Conclusion
The main aim of this study was to provide an insight into quantified trabecular changes caused not only by age and disease but also by sex. The microarchitectural properties of trabecular bone obtained from fracture and non-fracture groups, which were differentiated according to sex, were investigated for this study. As shown through statistical analysis, all of the microarchitectural parameters for females (when age matched) were significantly different between fracture and non-fracture groups. This was also the case for the male specimens, with the exception of TbN, TbSp and vTMD, were no significant differences were observed. This may suggest for the fracture group, differences in remodelling between males and females. It has been proposed that this is due to material quality/ chemistry differences between the two sexes, collaborated to a certain extent by vTMD values. This study has also shown with age for both sexes, there is a progressive loss of bone mineral, through thinning and loss of trabeculae, although the extent of loss is significantly less than the fracture group.
This study is consistent with previous studies and suggests analysis of bone microarchitecture may provide a more robust non - invasive fracture prediction for osteoporosis diagnosis. However, currently the resolution of high resolution CT (HR-CT) used for in vivo analysis of living patients is lower than that of µ-CT and further work would be required to translate this ex vivo study through to in vivo examination using the critical parameters. Crucially, this study suggests that changes in fracture tissue are not just associated with progressive age-related deterioration in bone, with significant differences existing in the microarchitecture between age-matched non-fracture and fracture groups. This is possibly due to remodelling differences, which could potentially be investigated through bone chemistry/ quality parameters.
Acknowledgements
This programme of work is funded by an EPSRC research grant (EP/ K020196: Point-of-Care High Accuracy Fracture Risk Prediction). The authors acknowledge the support provided by the UK Department of Transport under the BOSCOS (Bone Scanning for Occupant Safety) project for which the human tissue was obtained in the Gloucester and Cheltenham NHS Trust hospitals under ethical consent (BOSCOS — Mr. Curwen CI REC ref. 01/179G). We would also like to thank the staff of the donor tissue bank at the Victorian Institute of Forensic Medicine for the collection of the Australian samples. We would also like to thank the next of kin of the deceased for their willingness to support research into the aging skeleton for the wider benefit of society.
For data supporting this study, please see the Cranfield University repository at https://doi.org/10.17862/cranfield.rd.5901427.
References
- [1].Keene GS, Parker MJ, Pryor GA (1993). Mortality and morbidity after hip fractures. BMJ, 307: 1248–1250. [DOI] [PMC free article] [PubMed] [Google Scholar]
- [2].Kanis JA, Johnell O (1999). The burden of osteoporosis. J Endocrinol Invest, 22: 583–588. [DOI] [PubMed] [Google Scholar]
- [3].Pisani P, Renna MD, Conversano F, Casciaro E, Muratore M, Quarta E et al. (2013). Screening and early diagnosis of osteoporosis through X-ray and ultrasound-based techniques. World J Radiol, 5: 398–410. [DOI] [PMC free article] [PubMed] [Google Scholar]
- [4].Wilson HC, Abel PD, Shah SIA (2015). Repeated vertebral augmentation for new vertebral compression fractures of postvertebral augmentation patients: a nationwide cohort study-how useful is the current clinical gold standard for fracture risk? Clin Interv Aging, 10: 1653–1655. [DOI] [PMC free article] [PubMed] [Google Scholar]
- [5].Wainwright SA, Marshall LM, Ensrud KE, Cauley JA, Black DM, Hillier TA et al. (2005). Hip fracture in women without osteoporosis. J Clin Endocrinol Metab, 90: 2787–2793. [DOI] [PubMed] [Google Scholar]
- [6].Faibish D, Ott SM, Boskey AL (2006). Mineral changes in osteoporosis a review. Clin Orthop Relat Res, 443: 28–38. [DOI] [PMC free article] [PubMed] [Google Scholar]
- [7].Teo JC, Si-Hoe KM, Keh JE, Teoh SH (2006). Relationship between CT intensity, microarchitecture and mechanical properties of porcine vertebral cancellous bone. Clin Biomech, 21: 235–244. [DOI] [PubMed] [Google Scholar]
- [8].Seeman E (2008). Bone quality: the material and structural basis of bone strength. J Bone Mineral Metab, 26: 1–8. [DOI] [PubMed] [Google Scholar]
- [9].Yerramshetty J, Akkus O (2013) Changes in cortical bone mineral and microstructure with aging and osteoporosis. In: Silva MJ, editor. Skeletal Aging and Osteoporosis. Biomechanics and Mechanobiology. Heidelberg: Springer, 105–131. [Google Scholar]
- [10].Ding M, Hvid I (2000). Quantification of age-related changes in the structure model type and trabecular thickness of human tibial cancellous bone. Bone, 26: 291–295. [DOI] [PubMed] [Google Scholar]
- [11].Eckstein F, Matsuura M, Kuhn V, Priemel M, Müller R, Link TM et al. (2007). Sex Differences of Human Trabecular Bone Microstructure in Aging Are Site-Dependent. J Bone Miner Res, 22: 817–824. [DOI] [PubMed] [Google Scholar]
- [12].Thomsen JS, Jensen MV, Niklassen AS, Ebbesen EN, Brüel A (2015). Age-related changes in vertebral and iliac crest 3D bone microstructure-differences and similarities. Osteoporosis Int, 26: 219–228. [DOI] [PubMed] [Google Scholar]
- [13].Shanbhogue VV, Brixen K, Hansen S (2016). Age-and Sex-Related Changes in Bone Microarchitecture and Estimated Strength: A Three-Year Prospective Study Using HRpQCT. J Bone Miner Res, 31: 1541–1549. [DOI] [PubMed] [Google Scholar]
- [14].Kijowski R, Tuite M, Kruger D, Munoz Del Rio A, Kleerekoper M, Binkley N (2012). Evaluation of trabecular microarchitecture in non-osteoporotic postmenopausal women with and without fracture. J Bone Miner Res, 27: 1494–1500. [DOI] [PMC free article] [PubMed] [Google Scholar]
- [15].Milovanovic P, Djonic D, Marshall RP, Hahn M, Nikolic S, Zivkovic V et al. (2012). Micro-structural basis for particular vulnerability of the superolateral neck trabecular bone in the postmenopausal women with hip fractures. Bone, 50: 63–68. [DOI] [PubMed] [Google Scholar]
- [16].Djuric M, Zagorac S, Milovanovic P, Djonic D, Nikolic S, Hahn M et al. (2013). Enhanced trabecular micro-architecture of the femoral neck in hip osteoarthritis vs. healthy controls: a micro-computer tomography study in postmenopausal women. Int Orthop, 37: 21–26. [DOI] [PMC free article] [PubMed] [Google Scholar]
- [17].Thompson DD, Posner AS, Laughlin WS, Blumenthal NC (1983). Comparison of bone apatite in osteoporotic and normal Eskimos. Calcified Tissue Int, 35: 392–393. [DOI] [PubMed] [Google Scholar]
- [18].Gadeleta SJ, Boskey AL, Paschalis E, Carlson C, Menschik F, Baldini T et al. (2000). A physical, chemical, and mechanical study of lumbar vertebrae from normal, ovariectomized, and nandrolone decanoate-treated cynomolgus monkeys (Macaca fascicularis). Bone, 27: 541–550. [DOI] [PubMed] [Google Scholar]
- [19].Boskey A (2003). Bone mineral crystal size. Osteoporosis Int, 14: 16–21. [DOI] [PubMed] [Google Scholar]
- [20].Rubin MA, Jasiuk I, Taylor J, Rubin J, Ganey T, Apkarian RP (2003). TEM analysis of the nanostructure of normal and osteoporotic human trabecular bone. Bone, 33: 270–282. [DOI] [PubMed] [Google Scholar]
- [21].Boskey AL, Donnelly E, Boskey E, Spevak L, Ma Y, Zhang W et al. (2016). Examining the Relationships Between Bone Tissue Composition, Compositional Heterogeneity, and Fragility Fracture: A Matched Case-Controlled FTIRI Study. J Bone Miner Res, 31: 1070–1081. [DOI] [PMC free article] [PubMed] [Google Scholar]
- [22].Zhang ZM, Li ZC, Jiang LS, Jiang SD, Dai LY (2010). Micro-CT and mechanical evaluation of subchondral trabecular bone structure between postmenopausal women with osteoarthritis and osteoporosis. Osteoporosis Int, 21: 1383–1390. [DOI] [PubMed] [Google Scholar]
- [23].Li ZC, Dai LY, Jiang LS, Qiu S (2012). Difference in subchondral cancellous bone between postmenopausal women with hip osteoarthritis and osteoporotic fracture: implication for fatigue microdamage, bone microarchitecture, and biomechanical properties. Arthritis Rheum, 64: 3955–3962. [DOI] [PubMed] [Google Scholar]
- [24].Milovanovic P, Rakocevic Z, Djonic D, Zivkovic V, Hahn M, Nikolic S et al. (2014). Nano-structural, compositional and micro-architectural signs of cortical bone fragility at the superolateral femoral neck in elderly hip fracture patients vs. healthy aged controls. Exp Gerontol, 55: 19–28. [DOI] [PubMed] [Google Scholar]
- [25].Chiba K, Burghardt AJ, Osaki M, Majumdar S (2013). Heterogeneity of bone microstructure in the femoral head in patients with osteoporosis: an ex vivo HR-pQCT study. Bone, 56: 139–146. [DOI] [PMC free article] [PubMed] [Google Scholar]
- [26].Okazaki N, Chiba K, Taguchi K, Nango N, Kubota S, Ito M et al. (2014). Trabecular microfractures in the femoral head with osteoporosis: Analysis of microcallus formations by synchrotron radiation micro-CT. Bone, 64: 82–87. [DOI] [PubMed] [Google Scholar]
- [27].Ulrich D, Van Rietbergen B, Laib A, Ruegsegger P (1999). The ability of three-dimensional structural indices to reflect mechanical aspects of trabecular bone. Bone, 25: 55–60. [DOI] [PubMed] [Google Scholar]
- [28].Bobinac D, Marinovic M, Bazdulj E, Cvijanovic O, Celic T, Maric I et al. (2013). Microstructural alterations of femoral head articular cartilage and subchondral bone in osteoarthritis and osteoporosis. Osteoarthr Cartilage, 21: 1724–1730. [DOI] [PubMed] [Google Scholar]
- [29].Manolagas SC (2000). Birth and death of bone cells: basic regulatory mechanisms and implications for the pathogenesis and treatment of osteoporosis. Endocr Rev, 21: 115–137. [DOI] [PubMed] [Google Scholar]
- [30].Seeman E (1999). The structural basis of bone fragility in men. Bone, 25: 143–147. [DOI] [PubMed] [Google Scholar]
- [31].Seeman E (2007). Bone’s material and structural strength. Curr Opin Orthop, 18: 494–498. [Google Scholar]
- [32].Gagnon C, Li V, Ebeling PR (2008). Osteoporosis in men: its pathophysiology and the role of teriparatide in its treatment. Clin Interv Aging, 3: 635–45. [DOI] [PMC free article] [PubMed] [Google Scholar]
- [33].Perilli E, Baleani M, Öhman C, Fognani R, Baruffaldi F, Viceconti M (2008). Dependence of mechanical compressive strength on local variations in microarchitecture in cancellous bone of proximal human femur. J Biomech, 41: 438–446. [DOI] [PubMed] [Google Scholar]
- [34].Sornay-Rendu E, Boutroy S, Duboeuf F, Chapurlat RD (2017). Bone Microarchitecture Assessed by HR-pQCT as Predictor of Fracture Risk in Postmenopausal Women: The OFELY Study. J Bone Miner Res, 32: 1243–1251. [DOI] [PubMed] [Google Scholar]
- [35].Kreipke TC, Rivera NC, Garrison JG, Easley JT, Turner AS, Niebur GL (2014). Alterations in trabecular bone microarchitecture in the ovine spine and distal femur following ovariectomy. J Biomech, 47: 1918–1921. [DOI] [PMC free article] [PubMed] [Google Scholar]
- [36].Hsu PY, Tsai MT, Wang SP, Chen YJ, Wu J, Hsu JT (2016). Cortical bone morphological and trabecular bone microarchitectural changes in the mandible and femoral neck of ovariectomized rats. PloS One, 11: e154367. [DOI] [PMC free article] [PubMed] [Google Scholar]
- [37].Liu H, Li W, Liu YS, Zhou YS (2016). Bone micro-architectural analysis of mandible and tibia in ovariectomised rats. Bone Joint Res, 5: 253–62. [DOI] [PMC free article] [PubMed] [Google Scholar]
- [38].Vale AC, Pereira MF, Maurício A, Amaral P, Rosa LG, Lopes A et al. (2013). Micro-computed tomography and compressive characterization of trabecular bone. Colloids Surf A Physicochem Eng Asp, 438: 199–205. [Google Scholar]
- [39].Greenwood C, Clement J, Dicken A, Evans JP, Lyburn I, Martin RM et al. (2016). Towards new material biomarkers for fracture risk. Bone, 93:55–63. [DOI] [PubMed] [Google Scholar]
- [40].Doube M, Kłosowski MM, Arganda-Carreras I, Cordeliéres F, Dougherty RP, Jackson J et al. (2010). BoneJ: free and extensible bone image analysis in ImageJ. Bone, 47:1076–9. [DOI] [PMC free article] [PubMed] [Google Scholar]
- [41].Salmon PL, Ohlsson C, Shefelbine SJ, Doube M. (2015). Structure model index does not measure rods and plates in trabecular bone. Front Endocrinol, 6:1–10. [DOI] [PMC free article] [PubMed] [Google Scholar]
- [42].Nazarian A, Muller J, Zurakowski D, Müller R, Snyder BD (2007). Densitometric, morphometric and mechanical distributions in the human proximal femur. J Biomech, 40: 2573–2579. [DOI] [PubMed] [Google Scholar]
- [43].Müller, R, Rüegsegger P (1997). Micro-tomographic imaging of non-destructive evaluation of trabecular bone architecture In: Lowet G, Rüegsegger P, Weinans H, Meunier A, editors. Bone Research in Biomechanics. Amsterdam: IOS Press, 61–80. [Google Scholar]
- [44].Hildebrand T, Laib A, Müller R, Dequeker J, Rüegsegger P (1999). Direct three-dimensional morphometric analysis of human cancellous bone: Microstructural data from spine, femur, iliac crest, and calcaneus. J Bone Miner Res, 14: 1167–1174. [DOI] [PubMed] [Google Scholar]
- [45].Öhman C, Baleani M, Perilli E, Dall’Ara E, Tassani S, Baruffaldi, F et al. (2007). Mechanical testing of cancellous bone from the femoral head: experimental errors due to off-axis measurements. J Biomech, 40: 2426–2433. [DOI] [PubMed] [Google Scholar]
- [46].Tassani S, Particelli F, Perilli E, Traina F, Baruffaldi F, Viceconti M (2011). Dependence of trabecular structure on bone quantity: a comparison between osteoarthritic and non-pathological bone. Clin Biomech, 26: 632–639. [DOI] [PubMed] [Google Scholar]
- [47].Nikodem, A (2012). Correlations between structural and mechanical properties of human trabecular femur bone. Acta Bioeng Biomech, 14: 37–47. [PubMed] [Google Scholar]
- [48].Macdonald HM, Nishiyama KK, Kang J, Hanley DA, Boyd SK (2011). Age-related patterns of trabecular and cortical bone loss differ between sexes and skeletal sites: A population-based HR-pQCT study. J Bone Miner Res, 26: 50–62. [DOI] [PubMed] [Google Scholar]
- [49].Humbert L, Whitmarsh T, Craene MD, Del Río Barquero LM, Frangi AF (2012). Technical Note: Comparison between single and multiview simulated DXA configurations for reconstructing the 3D shape and bone mineral density distribution of the proximal femur. Med Phys, 39: 5272–5276. [DOI] [PubMed] [Google Scholar]
- [50].Warming L, Hassager C, Christiansen C (2002). Changes in bone mineral density with age in men and women: A longitudinal study. Osteoporosis Int, 13: 105–112. [DOI] [PubMed] [Google Scholar]
- [51].Greenwood C, Clement JG, Dicken AJ, Evans JPO, Lyburn ID, Martin RM et al. (2015). The micro-architecture of human cancellous bone from fracture neck of femur patients in relation to the structural integrity and fracture toughness of the tissue. Bone Reports, 3: 67–75. [DOI] [PMC free article] [PubMed] [Google Scholar]
- [52].Akkus O, Adar F, Schaffler MB (2004). Age-related changes in physicochemical properties of mineral crystals are related to impaired mechanical function of cortical bone. Bone, 34: 443–453. [DOI] [PubMed] [Google Scholar]
- [53].Handschin RG, Stern WB (1995). X-ray diffraction studies on the lattice perfection of human bone apatite (Crista iliaca). Bone, 16: S355–S363 [PubMed] [Google Scholar]
- [54].Acerbo AS, Kwaczala AT, Yang L, Judex S, Miller LM (2014). Alterations in collagen and mineral nanostructure observed in osteoporosis and pharmaceutical treatments using simultaneous small-and wide-angle X-ray scattering. Calcified Tissue Int, 95: 446–456. [DOI] [PubMed] [Google Scholar]
- [55].Rey C, Renugopalakrishman V, Collins B, Glimcher MJ (1991). Fourier transform infrared spectroscopic study of the carbonate ions in bone mineral during aging. Calcified Tissue Int, 49: 251–258. [DOI] [PubMed] [Google Scholar]
- [56].Posner AS, Perloff A, Diorio AF (1958). Refinement of the hydroxyapatite structure. Acta Crystallogr, 11: 308–309. [Google Scholar]
- [57].El Feki H, Savariault JM, Salah AB, Jemal M. (2000). Sodium and carbonate distribution in substituted calcium hydroxyapatite. Solid State Sci, 2: 577–586. [Google Scholar]
- [58].Wilson RM, Elliott JC, Dowker SE, Smith RI. (2004). Rietveld structure refinement of precipitated carbonate apatite using neutron diffraction data. Biomaterials, 25: 2205–2213. [DOI] [PubMed] [Google Scholar]
- [59].Paschalis EP, Betts F, DiCarlo E, Mendelsohn R, Boskey AL (1997). FTIR microspectroscopic analysis of human iliac crest biopsies from untreated osteoporotic bone. Calcified Tissue Int, 61: 487–492. [DOI] [PubMed] [Google Scholar]
- [60].Huang RY, Miller LM, Carlson CS, Chance MR (2003). In situ chemistry of osteoporosis revealed by synchrotron infrared microspectroscopy. Bone, 33: 514–521. [DOI] [PubMed] [Google Scholar]