

Abstract
Ferritin is a ubiquitous iron storage protein utilized as a nanomaterial for labeling biomolecules and nanoparticle construction. Commercially available preparations of horse spleen ferritin, widely used as a starting material, contain a distribution of ferritins with different iron loads. We describe a detailed approach to enrich for differentially-loaded ferritin molecules by common biophysical techniques such as size exclusion chromatography and preparative ultracentrifugation, and characterize these preparations by dynamic light scattering, and analytical ultracentrifugation. We demonstrate the combination of methods to standardize an approach at determining the chemical load of nearly any particle, including nanoparticles and metal colloids. Purification and characterization of iron content in monodisperse ferritin species is particularly critical for several applications in nanomaterial science.
Introduction
Iron is an essential element necessary for human life which is stored in the ubiquitous and highly-conserved protein ferritin. The protein plays a key role in iron metabolism and its ability to sequester the element allows ferritin to be essential to iron detoxification and reserve. Regulation of iron is critical to many biological processes and deviation leads to many diseased states [1–5].
Ferritin is an iron-storage protein distributed in high concentrations in the liver and spleen but also found in the heart and kidney. Ferritins from all species have 24 protein subunits arranged in 4,3,2 symmetry to form a spherical and hollow complex with an approximately 8 nm diameter cavity capable of storing up to 4500 iron atoms [3]. The protein shell is highly conserved with a combined molar mass of around 500 kDa [4, 5], and both the apo- and iron-loaded form have been well-characterized by a wide range of spectroscopic, crystallographic, and biochemical assays, to determine their structure and function. Research efforts on ferritin were also concentrated on its mechanism and regulation in diseased states [2, 6].
Early studies focused on the stability of the protein in solution and subsequently the molar mass was determined by sedimentation equilibrium. Before statistical computer-power facilitated data analysis, both Björk et al. and Crichton et al. successfully determined the stoichiometry of horse spleen apoferritin as a 24-mer using analytical ultracentrifugation (AUC) [7, 8]. Studies also characterized both apoferritin and iron-loaded horse spleen ferritin by sedimentation velocity [9, 10], where s-values of 16.5 S and 59–69 S, respectively, were obtained [10].
Much of the recent research on ferritin transitioned from basic structure-function relationships to a nanoparticle model for metal load and colloid mixture analysis, as the protein cage of ferritin has been proven useful as a storage vessel for a multitude of minerals of other metals including gadolinium, lead, cadmium, nickel, cobalt, chromium, and gold [11–16]. Ferritin has also recently been used to create magnesium-, cobalt-, and copper-based nanoparticles for electronics with conductive and magnetic properties [17]. However, it has become increasingly apparent that control of the size and mineral load is critical to fabrication of nanomaterials such as memory devices [18] and for fluorescent labeling of biomolecules [19]. Cölfen et al. [11] previously described the difficulties associated with obtaining particle size distributions of ferritin due to protein oligomerization and density differences due to differentially-loaded iron species. To address the problem, his group combined the sedimentation coefficient distribution through AUC with size-dependent diffusion coefficient distribution from flow-field fractionation to yield additional information on the hybrid colloid. With this approach, it was hypothesized that the ferritin molar mass could be determined for each oligomer as long as sedimentation coefficients were previously determined by AUC. However, the broad nature of the sedimentation coefficient distribution due to iron loading and aggregation in the flow-field flow fractionation technique prevented a global tool to determine partial specific volume and molar mass distributions.
A separate approach was used to determine nanoparticle core weight that utilizes light scattering and viscosity to measure ferritin iron content [20]. The theory behind the determination is that the weight per nanoparticle of any component of the nanoparticle (core or polymer) can be obtained by determining the number of nanoparticles per unit volume and then using the appropriate value of weight per unit volume. However in the determination of ferritin-iron content, the paper acknowledges that both measurements do not account for iron content polydispersity and that ferritin was never purified to remove higher order aggregates. Here, we describe a standardized method for determining the maximum load of several sources of ferritin by purification of the monomeric protein by size exclusion chromatography, sizing by dynamic light scattering, isolation of maximally-loaded species by preparative centrifugation, and finally, mass determination by sedimentation velocity and sedimentation equilibrium analytical ultracentrifugation. We also present procedures for improving core size homogeneity utilizing sucrose-gradient preparative ultracentrifugation.
Materials and Methods
Size exclusion chromatography
Horse spleen apoferritin (cat. no. A3641–500mg, batch 048K7004) and ferritin (cat. no. F4503–1g, batch 096K70121) were purchased as 50 mg/mL solutions from Sigma-Aldrich. Horse spleen ferritin (cat. no. 17044101C, lot 303232) was also obtained as a lyophilized preparation containing sucrose from Amersham Biosciences (now GE Healthcare). Size exclusion chromatography was performed on all samples to isolate the monomeric species. A HiLoad 16/60 Superdex 200 preparative grade column (GE Healthcare) was used in phosphate buffered saline (PBS, Life Technologies) to remove traces of dimer and tetramer apoferritin species, and aggregated ferritin. All subsequent experiments were carried out on the isolated monomeric species of ferritin and apoferritin, containing the fully assembled 24-mer protein shell.
Dynamic light scattering
The translational diffusion coefficients D and hydrodynamic diameters Dh were determined from an autocorrelation analysis of the scattered light at 514.5 nm on a Brookhaven Instruments BI200SM laser light scattering setup. A set of autocorrelation functions for monomeric apoferritin (A280 ~ 1.3) and ferritin (A280 ~ 1.0) were accumulated for 2 minutes at 19°C and an angle of 90° using a Brookhaven Instruments BI9000AT autocorrelator with sampling times of 0.6 μs to 10 ms. The second cumulant Γ2 (expressed as a hydrodynamic diameter) and moment μ2 (expressed in terms of the polydispersity μ2/Γ2) were obtained using the Brookhaven Instruments dynamic light scattering analysis software 9KDLSW (Version 2.12) [21]. Data were also analyzed in terms of a regularized CONTIN distribution of hydrodynamic radii.
Preparative ultracentrifugation for iron-loaded ferritin
5–30% (w/v) sucrose gradients in PBS were prepared in Beckman Coulter thin wall polypropylene tubes (14 mL) using a BioComp Gradient Master automatic gradient maker. Ferritin monomer samples were layered on top of the gradient and resolved on a Beckman Coulter Optima XL-100K in an SW40-Ti rotor at 38,000 rpm for 2.5 hours at 4°C. Twenty four 0.5 mL fractions were manually collected from the top of the gradient in a top-down manner such that the early fractions represent the top of the gradient. Fractionated samples were buffer exchanged by size exclusion chromatography to remove the sucrose. Note that fractionated samples of Sigma-Aldrich ferritin were buffer exchanged on a HiPrep 26/60 Sephacryl S200 high resolution column (GE Healthcare). Fraction 17 was the furthest fraction, for both the Sigma-Aldrich and Amersham preparations, that provided sufficient material for subsequent analyses.
Analytical ultracentrifugation
Sedimentation velocity
experiments were performed at 20°C on a Beckman Coulter ProteomeLab XLI following standard protocols [22]. Samples of apoferritin and unfractionated ferritin were loaded (A280 ~ 1.0) into 2-channel 12 mm path length sector shaped cells and thermally equilibrated at zero speed. Absorbance and interference velocity scans were subsequently acquired at 18,000 rpm and approximately 7 minute intervals – absorbance data were collected in a continuous mode as single measurements at 280 nm using a radial spacing of 0.003 cm. Samples of fractionated Sigma-Aldrich ferritin were analyzed in a similar manner at 12,000 rpm – fractions were diluted to a loading A280 of ~ 1.0, except for fractions 5 and 17 which were studied without dilution at loading A280 of 0.70 and 0.25, respectively. Samples of fractionated Amersham ferritin were studied at a loading A280 of ~ 0.75, except for fraction 17 which was studied at a loading A280 of 0.39. Absorbance data were analyzed in SEDFIT 14.7g [23] in terms of a continuous c(s) distribution of sedimenting species using a maximum entropy regularization confidence interval of 0.68. In all cases excellent fits were observed with root mean square deviations ranging from 0.0030 to 0.0061 absorbance units. Interference data for ferritin samples were not analyzed due to the low signal contribution of the sedimenting species. The partial specific volume of apoferritin was calculated based on the amino acid composition of the light chain peptide in SEDNTERP [24] (http://sednterp.unh.edu); the density ρ and viscosity η for PBS were also calculated in SEDNTERP. In the case of the fractionated ferritin samples, a c(s) model was used in which the frictional ratio f/fo is fixed and the partial specific volume refined. This accounts for the unknown partial specific volume; as these species have the same shape as apoferritin, the best-fit f/fo obtained for apoferritin was utilized.
The c(s) analysis, through the fixed f/fo and refined partial specific volume, provides an estimate of the molar mass for the sedimenting species, and thus the molar mass for the iron core. To determine an average value for the partial specific volume of the iron core we utilized the definition of the sedimentation coefficient s:
where M represents the molar mass of the sedimenting particle, the partial specific volume, f the frictional coefficient, ρ the solution density, and N Avogadro’s number. The buoyant molar mass of the sedimenting particle is assumed to have additive contributions from the apoferritin and iron core. Furthermore, all monomer ferritin species are assumed to have the same frictional coefficient as that of apoferritin, from which:
where the subscripts apo and fe-core describe the molar masses and partial specific volumes of the apoferritin protein and iron core components, respectively. A plot of sNf versus the mass of the iron core for ferritins with different iron content should yield a straight line with a slope , from which an average can be determined. We note that the value of the partial specific volume determined using sedimentation velocity is an effective partial specific volume that includes contributions from hydration as described below.
Sedimentation equilibrium
experiments were carried out at 20°C on a Beckman Optima XLA following standard protocols [22]. Samples of purified apoferritin in PBS were dialyzed exhaustively against PBS solutions containing 0%, 4%, 8%, 12%, 16% and 20% (w/v) sucrose solutions in PBS. Three concentrations of each sample, corresponding to loading A280 of 0.3, 0.6 and 1.2, were loaded into 6-channel 12 mm path length cells and absorbance equilibrium data were collected at 3,000, 5,000 and 7,000 rpm. 72 hours were required to reach equilibrium at the lowest rotor speed and subsequent speeds. Absorbance data were collected in step mode as an average of six measurements at 280 nm using a radial spacing of 0.001 cm. Sorted data for each sucrose concentration were analyzed globally in SEDPHAT 12.1e in terms of a single ideal species to determine the buoyant molar mass [25]. Excellent fits were obtained with root mean square deviations ranging from 0.0034 to 0.0065 absorbance units. Buffer densities were measured at 20.000°C on an Anton Paar DMA5000 density meter.
Individual peak fractions 14, 15, 16 and 17 of Amersham ferritin in PBS were similarly characterized by sedimentation equilibrium with absorbance data collected at 20°C and rotor speeds of 3,000 and 5,000 rpm. Each fraction was studied at two loading concentrations of 0.35 and 0.7 A280, except for fraction 17 that was studied at loading A280 concentrations of 0.17 and 0.34. Pooled SEC fractions from sucrose gradient fraction 16 were also studied using sucrose density contrast sedimentation equilibrium as above. Prior to sedimentation experiments, ferritin samples in PBS were dialyzed exhaustively against PBS solutions containing 0%, 4%, 8%, 12%, 16% and 20% (w/v) sucrose solutions in PBS. Sedimentation equilibrium data were collected at a single loading concentration corresponding to 0.65 A280.
Sedimentation equilibrium density contrast experiments, using sucrose as a cosolvent, were carried out to determine the partial specific volume and hydration parameter for apoferritin and ferritin. Using the formalism developed by Casassa and Eisenberg [26], the experimentally determined buoyant molar mass can be described by:
where B1 represents the protein-water interaction parameter in grams of water/gram of protein and relates to hydration, and the subscripts 1 and 2 refer to water and the protein of interest, respectively. In this analysis the particle is assumed to be invariant, namely that the hydration and other parameters do not change with sucrose concentration and that the interaction parameter with other co-solutes (B3) is zero [26, 27]. A plot of the experimental buoyant molar mass versus density, and knowledge of the molar mass, leads to values for the partial specific volume and hydration parameter B1.
Protein determination
Ferritin protein concentrations were determined using a modified Lowry protein assay kit (Thermo Scientific, product 23240) following the manufacturer’s instructions and protocol. Bovine serum albumin provided in the kit was used as a standard. Absorbance measurements were carried out on an Agilent 8453 UV-visible spectrophotometer at 750 nm. All measurements were performed at least twice (using separate BSA standard curves) in duplicate. A 100-fold dilution of the nominally 49 mg/mL stock solution of apoferritin was found to have a concentration of 0.57 ± 0.01 mg/mL using this method. Based on the UV absorption spectrum and calculated extinction coefficient at 280 nm, this 100-fold diluted solution was found to have a concentration of 0.614 ± 0.015 mg/mL, validating the modified Lowry assay within the error of the method.
Iron determination
The iron content for a selected ferritin fraction was determined by atomic absorption spectroscopy on a Perkin Elmer PinAAcle 9007 atomic absorption spectrometer. The assay was carried out in triplicate for a 250-fold dilution of the sample and corrected for the iron content of the PBS solution.
Results and Discussion
Commercial solution preparations (Sigma-Aldrich) of horse spleen apoferritin and ferritin were found to contain aggregates and low molar mass contaminants and both samples were purified to yield the monomeric species by size-exclusion chromatography prior to analysis. Whereas, the apoferritin sample contained traces of smaller species and approximately 22% of dimer and larger aggregates based on the integrated absorbance signal, the ferritin sample itself contained a significantly higher proportion of aggregate (Figure 3A). Using a modified Lowry protein assay we found that each mL of the crude ferritin solution contains approximately 18 mg of monomeric material and 23 mg of aggregate, in terms of protein content. The purified monomer preparations were characterized by dynamic light scattering to determine their particle size and verify their monomeric nature. The apoferritin preparation had an average diameter of 12.9 nm with a sample polydispersity of 0.03; similarly the ferritin preparation returned an average diameter of 12.1 nm with a sample polydispersity of 0.15 (Figure 1A). The iron-bound species, ferritin, was found to have a slightly smaller diameter than apoferritin, reflecting in part the approximately 20-fold lower protein concentration [28], though such a slight contraction of the protein shell has also been observed by transmission electron microscopy [29] and hydrodynamic studies [30]. Due to the increased scattering properties of ferritin, much lower concentrations of material had to be used for both light scattering and sedimentation experiments. An additional benefit of sizing by dynamic light scattering is to confirm the monomeric purity of both species after size exclusion.
Figure 3:
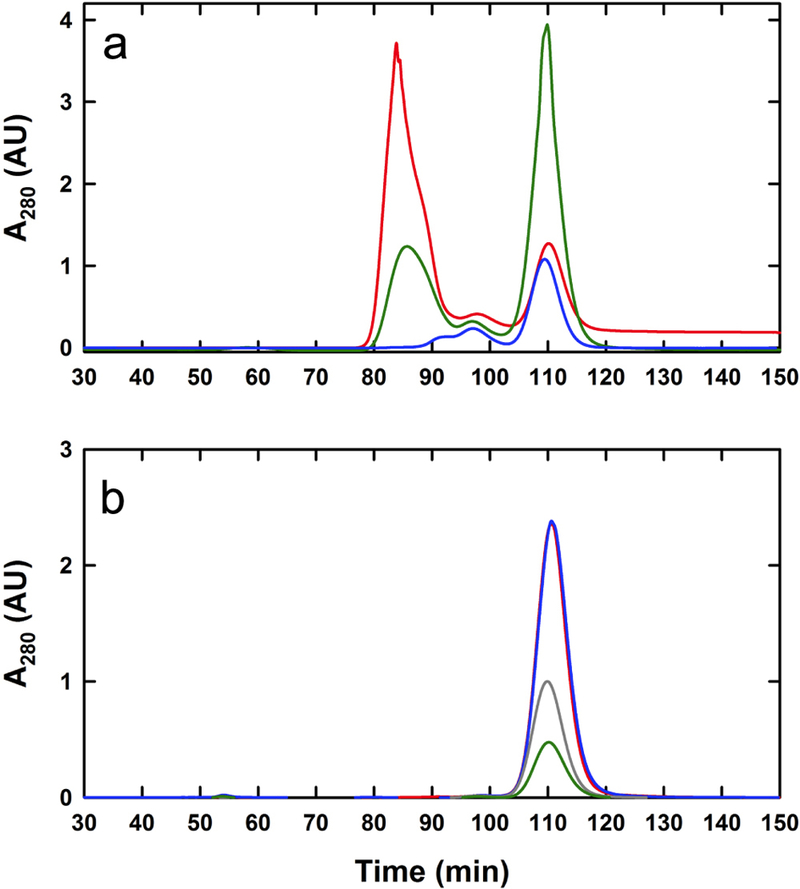
Characterization of ferritin and apoferritin. (A) Approximately 5 mg of unpurified apoferritin (blue), 2.7 mg of unpurified Sigma-Aldrich ferritin (red) and 5 mg of Amersham ferritin (green) were resolved by size exclusion chromatography. The species eluting at 110 min. represent the monomeric fractions. (B) Size exclusion profiles for monomeric Amersham ferritin fractions 14 (red), 15 (blue), 16 (grey), and 17 (green) resolved on a preparative 5–30% sucrose gradient. Pooled fractions (total volume of 9 mL) contain ~15 – 30 μg/mL of protein. Peak fractions (0.5 mL) contain 20 μg/mL (fraction 17), 30 μg/mL (fraction 16), 63 μg/mL (fraction 15) and 67 μg/mL (fraction 14) of protein based on the modified Lowry assay.
Figure 1:
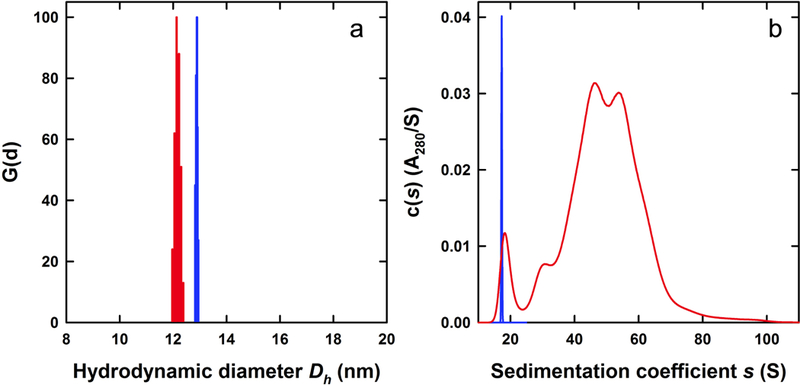
Characterization of monomeric ferritin and apoferritin. (A) Ferritin and apoferritin appear homogenous by dynamic light scattering. Regularized CONTIN size-distributions based on dynamic light scattering intensity data collected for monomeric apoferritin (blue) and ferritin (red) purified by size exclusion chromatography. (B) Sedimentation velocity c(s) profiles for monomeric apoferritin (blue) and ferritin (red) following purification by size exclusion chromatography.
A sedimentation velocity analysis of the purified monomeric species confirmed the purity of the apoferritin and demonstrated the iron-loading polydispersity of ferritin (Figure 1B). The c(s) profile for apoferritin showed the presence of essentially a single species with an average sedimentation coefficient of 16.55 S (s20,w = 17.16 S) and an estimated molar mass of 500 ± 20 kDa (Table 1). The best-fit frictional ratio f/fo obtained using the absorbance data was 1.27, a value similar to that previously reported [31] and typical for a hydrated, globular protein. In contrast, the c(s) profile for monomeric ferritin was consistent with the presence of a polydisperse sample spanning 16 – 80 S, suggestive of a polydisperse iron-load as previously reported [8].
Table 1.
Sedimentation properties of apoferritin and ferritin
| Sample | AUC method | s20,w (S) | Molar mass M (kDa) | (mL/g) | B1 (g/g) |
|---|---|---|---|---|---|
| Apoferritin | SV | 17.16 | 500 ± 20 | 0.7338a | -- |
| SE | -- | 480 ± 9b | 0.732 ± 0.016c | 0.23 ± 0.1c | |
| Ferritin | |||||
| Sigma-5 | SV | 26.9 | -- | ||
| Sigma-8 | SV | 39.2 | 700 | 0.564d | -- |
| Sigma-11 | SV | 51.6 | 760 | 0.484d | -- |
| Sigma-14 | SV | 59.0 | 840 | 0.457d | -- |
| Sigma-17 | SV | 60.0 | 890 | 0.463d | -- |
| Amersham-14 | SV | 70.4 | 970 | 0.426d | -- |
| SE | -- | 900 ± 40e | -- | -- | |
| Amersham-15 | SV | 71.7 | 980 | 0.422d | -- |
| SE | -- | 920 ± 45e | -- | -- | |
| Amersham-16 | SV | 72.1 | 980 | 0.419d | -- |
| SE | -- | 960 ± 60e | 0.41 ± 0.23c | 0.50 ± 0.24c | |
| Amersham-17 | SV | 69.8 | 950 | 0.420d | -- |
| SE | -- | 890 ± 40e | -- | -- |
Partial specific volume calculated based on the amino acid sequence. The correction to s20,w is based on the partial specific volume indicated within the same row.
Molar mass determined by sedimentation equilibrium is based on the amino acid sequence partial specific volume. The error is based on three determinations at different loading concentrations.
Parameters determined by sucrose density contrast sedimentation equilibrium. Errors are based on errors in the slope and intercept of the best-fit straight line to a plot of buoyant molar mass versus density. For the purposes of the calculation, the ferritin sample was assumed to have a full complement of iron.
Molar mass and partial specific volume based on sedimentation velocity data fit to a c(s) distribution of sedimenting species in which the frictional coefficient is fixed at 1.27. The correction to s20,w is based on the best-fit partial specific volume indicated within the same row. Note that in the case of Sigma-5, the presence of apoferritin complicated the determination of the molar mass and partial specific volume for the 26.9 S species, representing a partially filled ferritin.
Molar mass based on a partial specific volume of 0.422 mL/g, representing the average best-fit value for Amersham fractions 14 – 17 determined by sedimentation velocity. The error is based on data from two loading concentrations.
We utilized rate-zonal ultracentrifugation to fractionate the monomeric ferritin and enrich for a sample containing a maximal iron-load. Both ferritin and apoferritin were layered on top of 5–30% w/v sucrose gradients, fractionated, and monitored for protein content by measuring the absorbance at 280 nm (Figure 2A). The observed distributions mirrored the sedimentation c(s) profiles (Figure 1B) - apoferritin produced a major absorbance peak at fraction 4, whereas the distribution of ferritin peaked at fractions 10 and 11 but contained protein between fractions 5 and 17. Since the size of both ferritin and apoferritin are nearly identical and rate-zonal centrifugation separates on the basis of both mass and size, the broad distribution for ferritin is a consequence of polydispersity in mass or core mineralization.
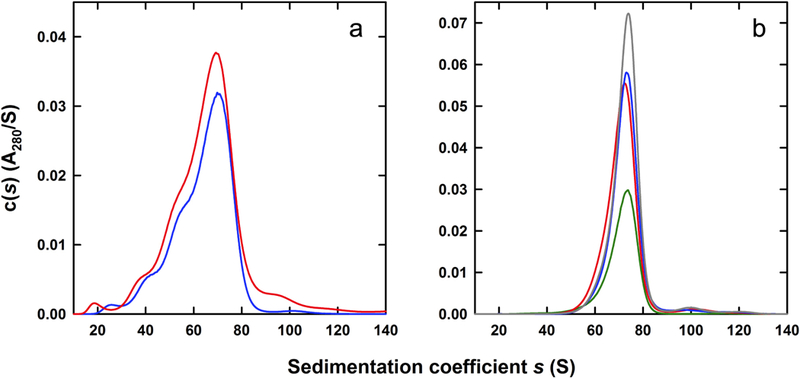
Figure 2:
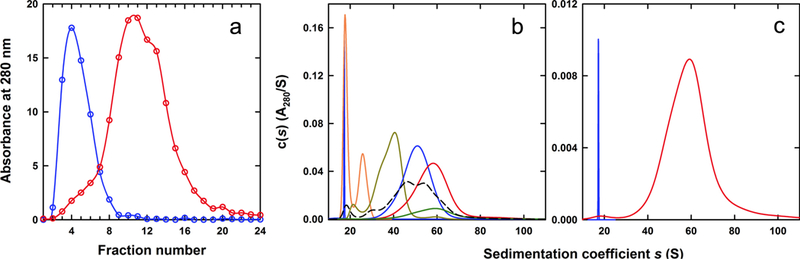
Fractionation and characterization of ferritin. (A) Monomeric Sigma-Aldrich ferritin was fractionated on a 5–30% (w/v) sucrose gradient. Absorbance profiles for apoferritin (blue) and ferritin (red) following centrifugation at 38,000 rpm for 2.5 hours on a SW40Ti rotor, and fractionation. Fraction 1 is the top of the gradient, whereas fraction 24 is the bottom. (B) Selected sedimentation velocity c(s) profiles for monomeric ferritin fractions resolved on a 5–30% sucrose gradient and purified by size exclusion chromatography. Profiles for fractions 5 (orange), 8 (dark yellow), 11(blue), 14 (red) and 17 (green) are shown, along with data for apoferritin (blue, scaled plot) and unfractionated monomeric ferritin (dashed black line). (C) Sedimentation velocity c(s) profiles for monomeric apoferritin (blue, scaled plot) and fractionated ferritin, fraction 17 corresponding to fully loaded ferritin (red). Fully loaded ferritin has a sedimentation coefficient of 60S.
To determine the contribution of iron and protein content, analytical ultracentrifugation was used to determine sedimentation coefficients of differentially-loaded ferritin molecules taken from the sucrose gradient. When the ferritin sample was fractionated from the sucrose gradient and purified again by size exclusion, the c(s) distributions of individual fractions were tighter than that for the unfractionated ferritin (Figure 2B). As the fraction number increased, such that the sedimentation in the sucrose gradient increased, the average s-value from the AUC analysis also increased (Figure 2B). This agrees with our hypothesis that fractions with larger sedimentation coefficients, as obtained from the sucrose gradient, are heavier and contain more iron molecules than apoferritin and less-mineralized ferritin species.
Ferritin fraction 17, the fraction with the highest average s-value, was found to have a sedimentation coefficient of 60.0 S. To obtain an estimate of the molar mass, we assumed that this species had the same size and shape as apoferritin and fixed f/fo to 1.27; the value for the partial specific volume was refined in the data analysis returning a molar mass of 890 kDa. Simple calculations were then employed to determine the iron load and the mass of the iron core was calculated at 410 ± 20 kDa by subtracting the mass of apoferritin from the mass of maximally-loaded ferritin. The molar mass aligns well with previously performed small-angle X-ray scattering analysis on maximally-loaded ferritin purified by a cesium chloride gradient with a determination of 418 kDa [30]. Iron in ferritin is stored as a ferrihydrite analog with chemical formula [FeO(OH)]8[FeO(H2PO4)] [5, 31]. Based on the analog’s formula mass, 410 ± 20 kDa of ferrihydrite contains 230 ± 11 kDa of iron, corresponding to 4,090 ± 200 iron atoms in agreement with published values of ~4,000 [5, 9, 33, 34]. The best-fit partial specific volume of 0.465 mL/g for ferritin results in a calculated partial specific volume of approximately 0.12 mL/g for the ferrihydrite core, indicating that this material has an unusually high density within ferritin. Of note, the molecular volume of 82 nm3 calculated for such as dense core corresponding to 410 kDa of the ferrihydrite analog is smaller than the volume of the interior cavity determined as 212 nm3, using a diameter of 7.4 nm [32].
Similar calculations were carried out for ferritin fractions having a smaller sedimentation coefficient. As expected, the decrease in the sedimentation coefficient was accompanied by a decrease in the molar mass and an increase in the partial specific volume, indicative of a smaller iron load (Table 1, Figure 5).
Figure 5:
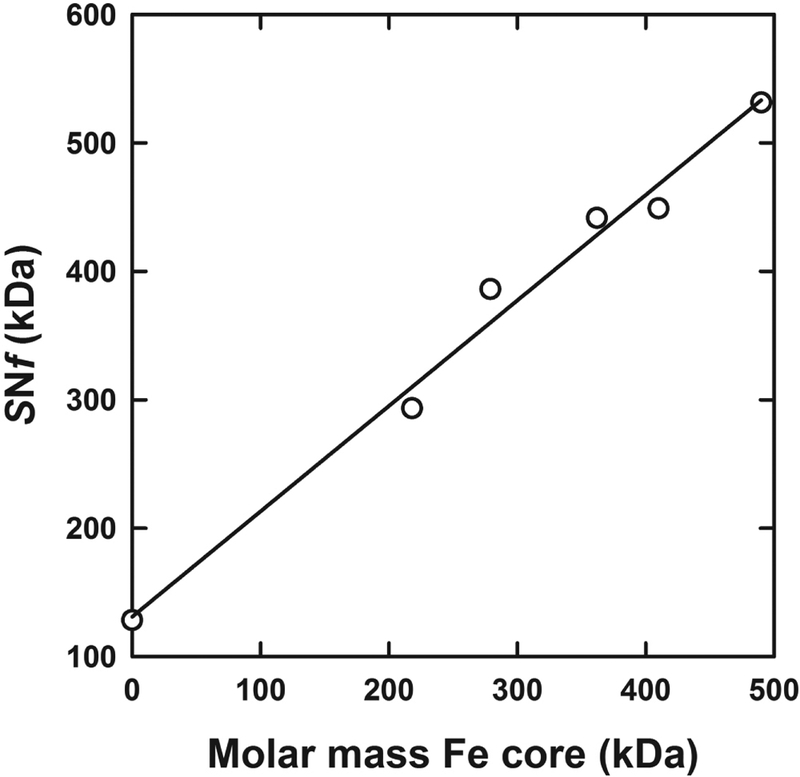
Determination of the partial specific volume for the iron ferritin core. The product of the experimental sedimentation coefficient and calculated frictional coefficient, in the form of SNf is plotted against the estimated iron core molar mass. Data are shown for apoferritin, sucrose gradient fractions 8, 11, 14 and 17 of Sigma-Aldrich ferritin and fraction 17 of Amersham ferritin.
To further validate observations for ferritin having a complete iron complement, similar experiments were carried out using an alternate source of horse spleen ferritin. A lyophilized preparation utilized as a high molar mass standard in size exclusion chromatography was used (Amersham Biosciences). Unlike the preparation from Sigma-Aldrich, this material contained a significantly higher proportion of monomeric ferritin. Monomeric ferritin now represents the major species in the size exclusion absorbance profile (Figure 3A), and based on the modified Lowry assay we found relative protein ratios of 3.3 mg monomer and 0.37 mg of aggregate. Surprisingly, the sedimentation velocity c(s) profiles for both the unpurified ferritin and unfractionated monomeric ferritin indicated the predominant presence of approximately 70 S species (Figure 4A). The relative proportions of slower sedimenting species was decreased when compared to the profile observed in Figure 1B. Such an observation was confirmed by sucrose density fractionation whereby all of fractions 14, 15, 16 and 17 (Figure 4B) were found to consist of approximately 70 S ferritin. (Table 1, Figure 5B). As detailed in Table 1, sedimentation velocity data for these fractions shows the presence of a 71 ± 0.9 S species with an estimated average molar mass of 970 ± 12 kDa, corresponding to an iron load of 4,890 ± 120 iron atoms in the form of the ferrihydrite analog.
Figure 4:
Characterization of ferritin. (A) Sedimentation velocity c(s) profiles for Amersham ferritin (red) and monomeric Amersham ferritin purified by size exclusion chromatography (blue). (B) Sedimentation velocity c(s) profiles for monomeric Amersham ferritin fractions resolved on a 5–30% sucrose gradient and purified by size exclusion chromatography. Profiles for fractions 14 (red), 15 (blue), 16 (grey), and 17 (green) are shown.
Based on the sedimentation coefficient and estimated molar masses, this purified preparation of appears to have a higher iron load than the 60 S ferritin described above. This is also evidenced by a smaller best-fit partial specific volume of 0.422 mL/g (Table 1). We combined these data, with that for the Sigma-Aldrich ferritin fractions containing less iron to obtain an estimate of the partial specific volume for the iron. As described in the Materials and Methods section we used the definition of the sedimentation coefficient to calculate a frictional coefficient for apoferritin, and applied this value to all of the purified ferritin fractions. A plot of the experimental SNf as a function of the estimated molar mass, expressed in terms of the mass of the iron core, returns a best-fit linear slope of 0.82 ± 0.05 (Figure 5). This corresponds to a partial specific volume of 0.18 ± 0.04 mL/g. Even with a maximal ferrihydrite load of 490 kDa for the 70 S ferritin, the estimated volume of 115 nm3 is still smaller than the total cavity volume of 212 nm3. The best-fit intercept, representing the buoyant molar mass of apoferritin, corresponds to a molar mass of 480 ± 50 kDa, a value identical to that expected for monomeric apoferritin and the value assumed when determining the molar mass of the iron core.
To obtain an independent estimate of the iron content we utilized atomic absorption spectrometry for a purified Amersham ferritin fraction. A peak fraction from the size-exclusion purification of sucrose gradient fraction 15 was found to contain 63 ± 12 μg/mL of protein using the modified Lowry assay and 30.65 ± 0.09 mg/L of iron. These values correspond to apoferritin and iron concentrations of 0.13 ± 0.025 μM and 549 ± 2 μM, respectively, resulting in a load of 4,200 ± 800 iron per apoferritin. Based on these assays, the purified 70 S ferritin appears to have a complete iron load. Due to the lack of sufficient material, we were unable to carry out such a determination for the purified 60 S Sigma-Aldrich ferritin. Furthermore, we note that the pooled monomer ferritin fractions following sucrose gradient fractionation and subsequent size-exclusion contained ~15 – 56 μg/mL of protein, with size-exclusion peak fractions having from 20 – 70 μg/mL of protein (Figure 3B). The combined sucrose gradient fractions 14, 15, 16 and 17 for Amersham ferritin contained approximately 1 mg of total protein. The pooled purified monomer fractions eluting at 110 minutes (Figure 3A) contained approximately 35 mg of protein, resulting in a total yield of 2.9%. It should be noted however, that only 80% of the central four fractions corresponding to the monomer peak fraction were used for subsequent sucrose gradient fractionation.
Sedimentation equilibrium experiments were also carried out to further determine the molar masses of the 17 S apoferritin and 70 S Amersham ferritin fractions. As in the sedimentation velocity experiments, sedimentation equilibrium data collected at multiple concentrations were consistent with the presence of a single species (Figure 6A and7A). Using the calculated partial specific volume based on the amino acid sequence, these experiments return a molar mass of 480 ± 9 kDa for apoferritin consistent with the expected 24-mer stoichiometry for the fully assembled monomer (Table 1). Similar experiments on the purified ferritin fractions 14, 15, 16 and 17 return an averaged molar mass of 920 ± 30 kDa consistent with a ferritin having a full complement of iron (Table 1). In this case the best-fit partial specific volume of 0.422 mL/g obtained from sedimentation velocity was used.
Figure 6:
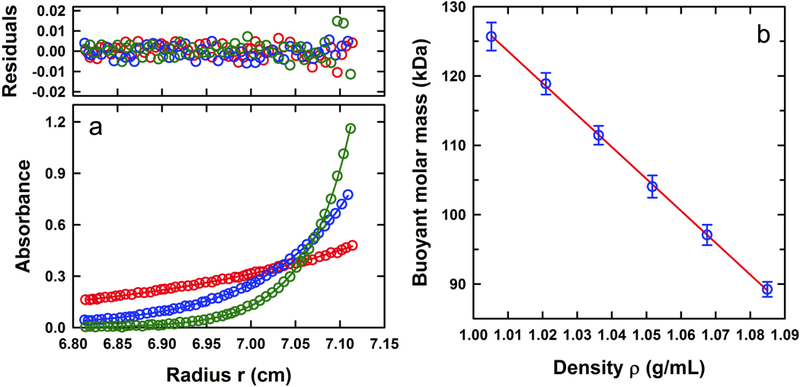
Buoyant molar mass of apoferritin. (A) Sedimentation equilibrium profiles at 280 nm of 0.3 A280 load apoferritin in PBS at 20°C and 3,000 (red), 5,000 (blue) and 8,000 (green) rpm. Data are modeled globally in terms of a single ideal species with the best-fit shown as solid lines. The corresponding residuals are displayed. For clarity only every third radial data point is shown. (B) Buoyant molar mass of apoferritin as a function of solvent density in sucrose and PBS. Errors in the buoyant molar mass are obtained from an analysis of the individual concentrations studied for each sample. The best-fit line provides values of the intercept and slope for the determination of the partial specific volume and hydration parameter B1.
Figure 7:
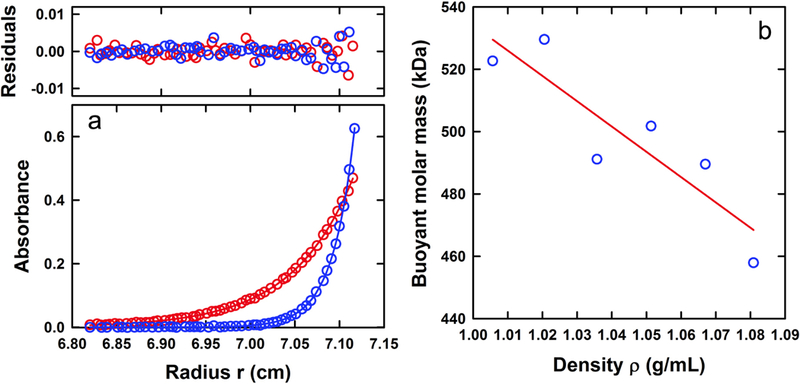
Buoyant molar mass of ferritin. (A) Sedimentation equilibrium profiles at 280 nm of 0.35 A280 load Amersham ferritin (fraction 17) in PBS at 20°C and 3,000 (red) and 5,000 (blue) rpm. Data are modeled globally in terms of a single ideal species with the best-fit shown as solid lines. The corresponding residuals are displayed. For clarity only every third radial data point is shown. (B) Buoyant molar mass of Amersham ferritin (fraction 16) as a function of solvent density in sucrose and PBS. The best-fit line provides values of the intercept and slope for the determination of the partial specific volume and hydration parameter B1.
We have observed that the best-fit f/fo for apoferritin is identical to that usually observed for hydrated, globular proteins such as bovine serum albumin, a standard utilized in sedimentation velocity studies [35, 36]. As noted by de Haën [37], this observation is rather surprising given the large central cavity. Even though the sedimentation velocity analysis returns a correct molar mass estimate, the interpretation and determination of f/fo depend on knowledge of the partial specific volume and possible hydration contributions B1. We therefore carried out a series of density contrast sedimentation equilibrium experiments on purified apoferritin in PBS solutions containing different concentrations of sucrose to determine these parameters, as described in [27]. The observed buoyant molar mass decreased linearly with increasing solution density (Figure 6B) suggesting the presence of an invariant particle. Based on a calculated sequence molar mass of 478,714 Da for a 24-mer apoferritin composed of light chain protein, the analysis of the best-fit linear relation returns a partial specific volume of 0.732 ± 0.016 mL/g and a hydration contribution of 0.23 ± 0.01 g/g. The value of the partial specific volume is, within the error of the method, identical to that determined based on the amino acid sequence. Protein hydration is typically of the order of 0.3 g/g, though smaller values have been reported [38] – in this particular case, the value is almost identical to that determined for aldolase when using sucrose as a cosolvent for density contrast [27]. Surprisingly, the method does not appear to capture the interior volume of the apoferritin, expected to contribute 0.267 grams of water per gram of protein for an interior shell with a diameter of 7.4 nm [30], indicating that the sucrose populates the interior of the apoferritin.
Similar experiments were carried out on pooled fractions of purified Amersham ferritin to determine whether the method of density contrast is able to account for the volume occupied by the ferrihydrite interior. As in the case of apoferritin, the observed buoyant molar mass decreased linearly with increasing solution density (Figure 7B). However, due to the higher ferritin density the overall decrease in mass was not as pronounced. This, together with the error in the method and the extrapolation to zero density, leads to large errors in the estimate of the hydration and partial specific volume parameters (Table 1). Assuming a mass of 900 kDa for the ferritin, this analysis returns a partial specific volume of 0.41 ± 0.23 mL/g and a B1 of 0.50 ± 0.24 g/g. Despite the error, the value of B1 is significantly larger than that for apoferritin; in molecular terms the hydration parameter for apoferritin corresponds to a volume of 180 ± 10 nm3, whereas that for ferritin with a complete iron core corresponds to a volume of 750 ± 360 nm3 accounting for the occupied interior and exclusion of sucrose.
Conclusions
Ferritin is an important, highly conserved, and ubiquitous protein essential to the storage of a mineral necessary for many biological processes including oxygen transport and several imperative redox reactions. The importance of iron is highlighted by the human diseases associated with too much iron (hemochromatosis; porphyria) [39] or too little iron in the blood (iron deficiency anemia) [40]. Hemochromatosis is triggered by a mutation in the HFE gene that causes increased iron absorption and toxicity linked to cirrhosis, diabetes, and several other difficulties [41]. Porphyria can be caused by the buildup of iron leading to increased porphyrin, a problem in oxygen transport [42]. Iron deficiency anemia, as the name suggests, is a lack of iron, typically caused by diet, and leads to decreased hemoglobin among others, causing heart and growth problems [43].
Ferritin has also been widely used for labeling biomolecules and even nanoparticle construction as the apoferritin shell can load many different types of inorganic compounds other than iron [13–19]. Nanoparticles are routinely loaded with chemical moieties for targeting, detection, and function, and determination of the maximum load of these particles is important for design and delivery. We have standardized an approach to purify and characterize homogenous populations of ferritin for nanomaterial construction. We showed how a combination of chromatography, dynamic light scattering, and preparative and analytical ultracentrifugation can overcome limitations of other biochemical assays such as ELISA which are unable to distinguish between ferritin and apoferritin. Importantly, we have shown how analytical ultracentrifugation can be used to estimate the iron load of the paucidisperse ferritin preparations, taking advantage of the fact that the monomeric ferritin has essentially the same diffusion properties as that of the well-characterized apoferritin, irrespective of iron load. Using this standardized approach, researchers can more accurately elucidate the number of conjugated entities to a specific particle of interest prior to clinical testing. In the same light, organic-inorganic hybrid colloids and biopolymers have gained interest lately as the possibility of combining the properties of organic and inorganic material provide researchers additional tools for medicine and technology [44]. Again, this approach can potentially be utilized to characterize a single component of the overall larger complex.
Acknowledgments
This research was supported by the Intramural Research Program of the National Institutes of Health, National Institute of Diabetes and Digestive and Kidney Diseases (R.G.). The authors thank Dr. Marie-Paule Strub and Dr. Duck-Yeon Lee (Biochemistry Core Facility, NHLBI) of the National Heart, Lung and Blood Institute for assistance with the atomic absorption spectrometry.
References
- 1).Chasteen ND, and Harrison PM (1999) Mineralization in ferritin: An efficient means of iron storage. J. Struct. Biol 126, 182–194. [DOI] [PubMed] [Google Scholar]
- 2).Halliday JW, and Powell LW (1984) Ferritin metabolism and the liver. Seminars Liver Disease 4, 207–216. [DOI] [PubMed] [Google Scholar]
- 3).Ford GC, Harrison PM, Rice DW, Smith JMA, Treffrey A, White JL, and Yariv J (1984) Ferritin: Design and Formation of an iron-storage molecule. Phil. Trans. R. Soc. Lond 304, 551–565. [DOI] [PubMed] [Google Scholar]
- 4).Harrison PM, and Arosio P (1996) The ferritins: molecular properties, iron storage function and cellular regulation. Biochim. Biophys. Acta 1275, 161–203. [DOI] [PubMed] [Google Scholar]
- 5).Crichton RR, and Charloteaux-Wauters M (1987) Iron transport and storage. Eur. J. Biochem 164, 485–506. [DOI] [PubMed] [Google Scholar]
- 6).Watt RK (2011) The many faces of the octahedral ferritin protein. Biometals 24, 489–500. [DOI] [PubMed] [Google Scholar]
- 7).Bjork I, and Fish WW (1971) Native and subunit molecular weights of apoferritin. Biochemistry 10, 2844–2848. [DOI] [PubMed] [Google Scholar]
- 8).Crichton RR, Eason R, Barclay A, and Bryce CFA (1973) The subunit structure of horse spleen apoferritin: the molecular weight of the oligomer and its stability to dissociation by dilution. Biochem. J, 131, 855–857. [DOI] [PMC free article] [PubMed] [Google Scholar]
- 9).Rothen A (1944) Ferritin and apoferritin in the ultracentrifuge. Studies on the relationship of ferritin and apoferritin; precision measurements of the rates of sedimentation of apoferritin. J. Biol. Chem 152, 679–695. [Google Scholar]
- 10).Stefanini S, Chiancone E, Arosio P, Finazzi-Agro A, and Antonini E (1982) Structural heterogeneity and subunit composition of horse ferritins. Biochemistry, 21, 2293–2299. [DOI] [PubMed] [Google Scholar]
- 11).Cölfen H, and Völkel A (2003) Hybrid colloid analysis combining analytical ultracentrifugation and flow-field flow fractionation. Eur. Biophys. J 32, 432–436. [DOI] [PubMed] [Google Scholar]
- 12).Swift J, Butts CA, Cheung-Lau J, Yerubandi V, and Dmochowski IJ (2009) Efficient self-assembly of Archaeoglobus fulgidus ferritin around metallic cores. Langmuir 25, 5219–5225. [DOI] [PubMed] [Google Scholar]
- 13).Turvanska L, Bradshaw TD, Sharpe J, Li M, Mann S, Thomas NR, Patane A (2009) The biocompatibility of apoferritin-encapsulated PbS quantum dots. Small 5, 1738–1741. [DOI] [PubMed] [Google Scholar]
- 14).Iwahori K, and Yamashita I, (2007) Biotemplate synthesis of nanoparticle by cage-shaped protein supramolecule, apoferritin. J. Clust. Sci 18, 358–370. [Google Scholar]
- 15).Liu G, Wu H, Wang J, and Lin Y (2006) Apoferritin-templated synthesis of metal phosphate nanoparticle labels for electrochemical immunoassay, Small 2, 1139–1143. [DOI] [PubMed] [Google Scholar]
- 16).Sanchez P, Valero E, Gálvez N, Dominguez-Vera JM, Marinone M, Poletti G, Corti M, and Lasciafari A (2009) MRI relaxation properties of water-soluble apoferritin-encapsulated gadolinium oxide-hydroxide nanoparticles, Dalton Trans. 800–804. [DOI] [PubMed] [Google Scholar]
- 17).Rakshit T, and Mukhopadhyay R (2011) Tuning band gap of holoferritin by metal core reconstitution with Cu, Co, and Mn. Langmuir 27, 9681–9686. [DOI] [PubMed] [Google Scholar]
- 18).Iwahori K, and Yamashita I (2008) Size-controlled one-pot synthesis of fluorescent cadmium sulfide semiconductor nanoparticles in an apoferritin cavity. Nanotechnology 19; 495601. [DOI] [PubMed] [Google Scholar]
- 19).Ichikawa K, Jujii M, Uraoka Y, Punchaipetch P, Yano H, Hatayama T, Fuyuki T, and Yamashita I (2009) Nonvolatile thin film transistor memory with ferritin, J. Korean Phys. Soc 54, 554–557. [Google Scholar]
- 20).Reynolds F, O’loughlin T, Weissleder R, and Josephson L (2005) Methods of determining nanoparticle core weight. Anal. Chem 77, 814–817. [DOI] [PubMed] [Google Scholar]
- 21).Inagaki S, Ghirlando R, and Grisshammer R (2013) Biophysical characterization of membrane proteins in nanodiscs. Methods 59, 287–300. [DOI] [PMC free article] [PubMed] [Google Scholar]
- 22).Zhao H, Brautigam CA, Ghirlando R, and Schuck P (2013) Overview of current methods in sedimentation velocity and sedimentation equilibrium analytical ultracentrifugation. Curr. Protoc. Protein Sci 2012. [DOI] [PMC free article] [PubMed] [Google Scholar]
- 23).Schuck P (2000) Size distribution analysis of macromolecules by sedimentation velocity ultracentrifugation and Lamm equation modeling. Biophys. J 78, 1606–1619. [DOI] [PMC free article] [PubMed] [Google Scholar]
- 24).Cole JL, Lary JW, Moody TP, and Laue TM (2008) Analytical ultracentrifugation: Sedimentation velocity and sedimentation equilibrium. Methods Cell Biol. 84, 143–179. [DOI] [PMC free article] [PubMed] [Google Scholar]
- 25).Ghirlando R (2011) The analysis of macromolecular interactions by sedimentation equilibrium. Methods 54, 145–156. [DOI] [PMC free article] [PubMed] [Google Scholar]
- 26).Casassa EF, and Eisenberg H (1964) Thermodynamic analysis of multicomponent solutions. Adv. Protein Chem 19, 287–395. [DOI] [PubMed] [Google Scholar]
- 27).Ebel C, Eisenberg H, and Ghirlando R (2000) Probing protein-sugar interactions. Biophys. J 78, 385–393. [DOI] [PMC free article] [PubMed] [Google Scholar]
- 28).May ME and Fish WW (1978) The UV and visible spectral properties of ferritin. Archives Biochem. Biophys 190, 720–725. [DOI] [PubMed] [Google Scholar]
- 29).Massover WH (1993) Ultrastructure of ferritin and apoferritin: a review. Micron 24, 389–437. [Google Scholar]
- 30).May CA, Grady JK, Laue TM, Poli M, Arosio P and Chasteen ND (2010) The sedimentation properties of ferritins. New insights and analysis of methods of nanoparticle detection. Biochimica Biophysica Acta 1800, 858–870. [DOI] [PMC free article] [PubMed] [Google Scholar]
- 31).Björk I (1973) Association-dissociation behaviour and hydrodynamic properties of apoferritin monomer and dimer. Eur. J. Biochem 36, 178–184. [DOI] [PubMed] [Google Scholar]
- 32).Fischbach FA and Anderegg JW (1965) An X-ray scattering study of ferritin and apoferritin. J. Mol. Biol 14, 458–473. [DOI] [PubMed] [Google Scholar]
- 33).Harrison PM, Fischbach FA, Hoy TG, and Haggis GH (1967) Ferric oxyhydroxide core of ferritin. Nature 216, 1188–1190. [DOI] [PubMed] [Google Scholar]
- 34).Stefanini S, Chiancone E, Ecchini P and Antonini E (1976) Studies of iron uptake and micelle formation in ferritin and apoferritin. Mol. Cell. Biochem 13, 55–61. [DOI] [PubMed] [Google Scholar]
- 35).Ghirlando R, Balbo A, Piszczek G, Brown PH, Lewis MS, Brautigam CA, Schuck P and Zhao H (2013) Improving the thermal, radial, and temporal accuracy of the analytical ultracentrifuge through external references. Anal. Biochem 440, 81–95. [DOI] [PMC free article] [PubMed] [Google Scholar]
- 36).Zhao H et al. , (2015) A multilaboratory comparison of calibration accuracy and the performance of external references in analytical ultracentrifugation. Submitted. [DOI] [PMC free article] [PubMed] [Google Scholar]
- 37).de Haën C (1987) Molecular weight standards for calibration of gel filtration and sodium dodecyl sulfate-polyacrylamide gel electrophoresis: ferritin and apoferritin. [DOI] [PubMed]
- 38).Perkins S (1986) Protein volumes and hydration effects. The calculations of partial specific volumes, neutron scattering matchpoints and 280-nm absorption coefficients for proteins and glycoproteins from amino acid sequences. Eur. J. Biochem 157, 169–180. [DOI] [PubMed] [Google Scholar]
- 39).Batts KP (2007) Iron overload syndromes and the liver. Modern Pathol. 20, S31–S39. [DOI] [PubMed] [Google Scholar]
- 40).Winter WE, Bazydlo LA and Harris NS (2014) The molecular biology of human iron metabolism. Lab Med. 45, 92–102. [DOI] [PubMed] [Google Scholar]
- 41).Yun S and Vincelette ND (2015) Update on iron metabolism and molecular perspective of common genetic and acquired disorder, hemochromatosis. Crit. Rev. Oncol. Hematol (In press) doi: 10.1016/j.critrevonc.2015.02.006 [DOI] [PubMed] [Google Scholar]
- 42).Besur S, hou W, Schmeltzer P and Bonkovsky HL (2014) Clinically important features of porphyrin and heme metabolism and the porphyrias. Metabolites 4, 977–1006. [DOI] [PMC free article] [PubMed] [Google Scholar]
- 43).Powers JM and Buchanan GR (2014) Diagnosis and management of iron deficiency anemia. Hematol. Oncol. Clin. North Am 28, 729–745. [DOI] [PubMed] [Google Scholar]
- 44).Sanchez C, Belleville P, Popall M and Nicole L (2011) Applications of advanced hybrid organic-inorganic nanomaterials: from laboratory to market. Chem. Soc. Rev 40, 696–753. [DOI] [PubMed] [Google Scholar]