. 2018 Nov 27;7:e38407. doi: 10.7554/eLife.38407

Figure 3. Development of 8000 cells from a compact aggregate starting at time 0.

(A) Cells are assigned random apical-basal polarity directions and attract each other through polar interactions (see Equation 6). (A–D) Cross-section of the system at different time points with red and blue marking two opposite sides of the polar cells. Cells closest to the viewer are marked red/blue, whereas cells furthest away are yellow/white. (E) Full system at the time point shown in (D). (F) Development of the number of neighbors per cell (red) and the energy per cell (blue), as defined by the potential between neighbor cells in Figure 2. Dark colors show the mean over all cells while light-shaded regions show the cell–cell variations. The yellow dot marks the energy for a hollow sphere with the same number of cells. See Figure 3—video 1 for full time series. In Figure 2—figure supplement 1E–G and Figure 3—figure supplement 1, we study how the final morphology depends on noise. In Figure 3—figure supplement 2, we show how the outer surface self-seals, and that the shape is maintained when cells divide.

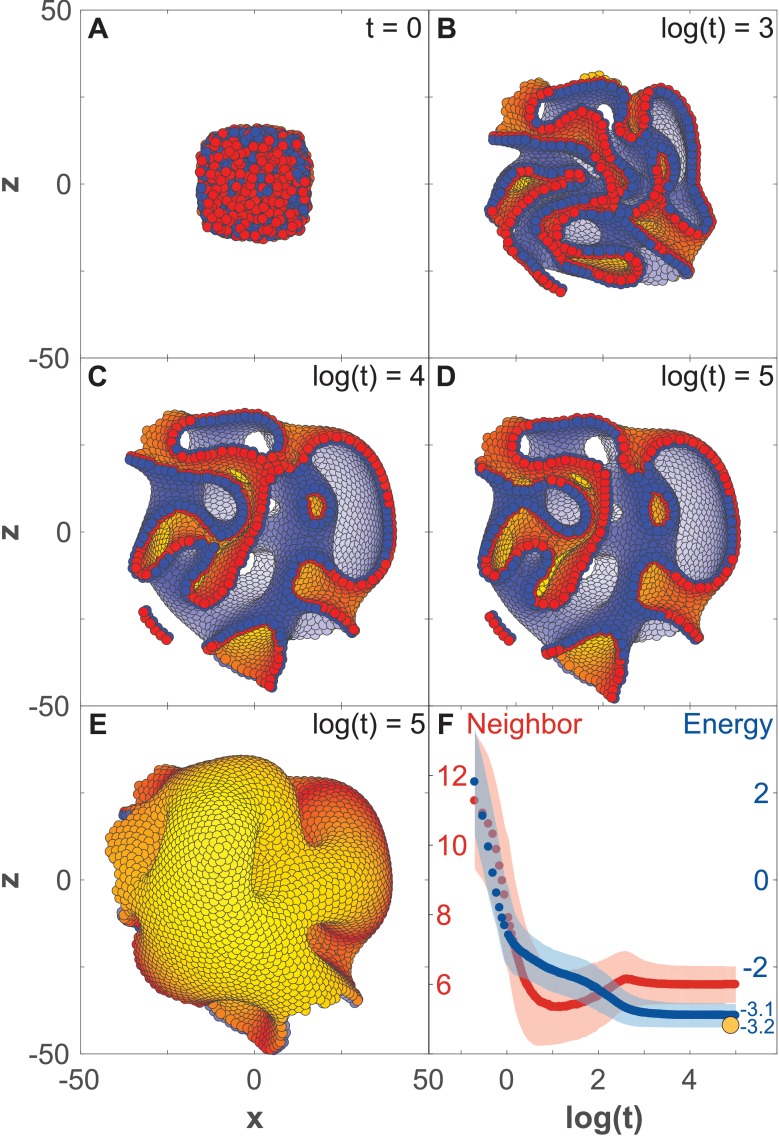
Figure 3.

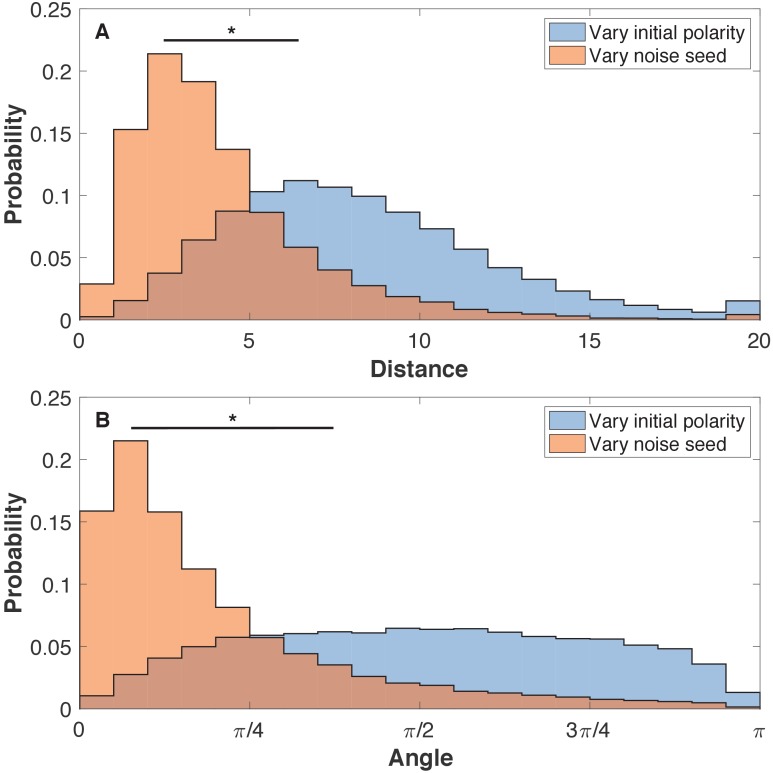
Figure 3—figure supplement 1. The final shapes are more sensitive to initial polarities than to noise.

Figure 3—figure supplement 1.

(A) The pairwise distance between cells for three systems with identical initial polarities but different noise and three systems with identical noise but different initial polarities. (B) For the same set of aggregates, the angle between the pairwise polarities is calculated. The initial positions are the same for all systems. Each system has 8000 cells. Cells are pairs if they were initiated with identical position. Here, the noise level is η = 10−4. Two-sample Kolmogorov-Smirnov tests showed p < 0.001 statistical significance (marked by *). Comparing noise levels give similar results as comparing noise seed. The initial polarities are random like in Figure 3.
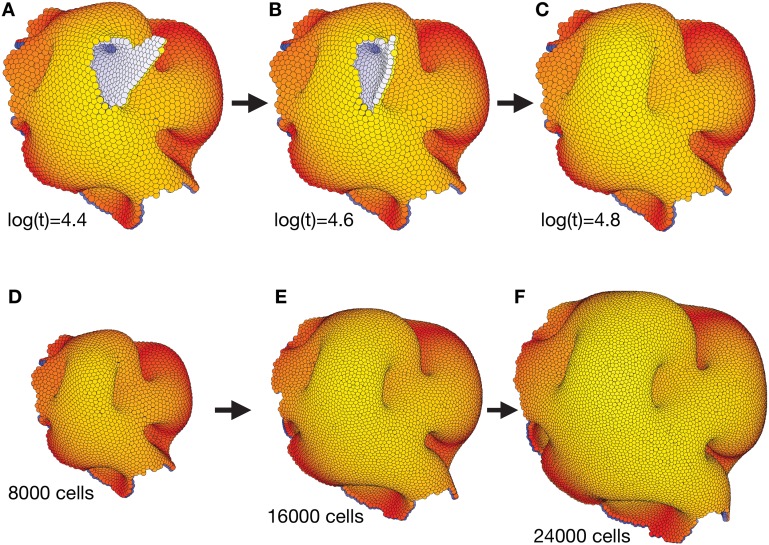
Figure 3—figure supplement 2. The complex morphology in Figure 3 self-seals and is robust to overall system growth.

Figure 3—figure supplement 2.

(A–C) Self-sealing properties of polarized cell surfaces when close to a final stable state in Figure 3. While the internal morphology remains the same from time log(t) = 3.6 (Figure 3C–D and Figure 3—video 1), some of the outer surfaces subsequently reorganize to form a less disrupted torus-like structure with multiple handles. (D–F) The final structure in (C) (and Figure 3D–E together with the end of Figure 3—video 1) is robust to cell divisions. For every 10th time step, we select a cell by random, and let it divide in an arbitrary direction. We see that the overall shape of the structure is maintained, and that it expands equally in all directions.
Figure 3—video 1. An aggregate of 8000 cells with initial random polarities unfolds into a stable complex morphology.
Download video file (3.5MB, mp4)
DOI: 10.7554/eLife.38407.013
During the simulation, the polarities and positions are updated dynamically with equal speed and noise (dt = 0.1 and η = 10−3). There is no planar cell polarity (λ1 = 1 and λ2 = λ3 = 0). (A) The entire system unfolds, and we notice that the outer surface reaches equilibrium state later than the internal morphology (see also Figure 3—figure supplement 2). (B) Cross-section of the system at y = 0. (C) Same as (B) but viewed from an angle slightly above and from a side. The color scheme is as described in Figure 3.