

Abstract
Purpose
Objective responses are reported in 34% to 37% of patients with programmed death-1 (PD-1)–naïve advanced melanoma treated with PD-1 inhibitors. Pre-existing CD8+ T-cell infiltrate and interferon (IFN) gene signature correlate with response to PD-1 blockade. Here, we report a phase Ib/II study of pembrolizumab/pegylated (PEG)-IFN combination in PD-1–naïve advanced melanoma.
Patients and Methods
PEG-IFN (1, 2, and 3 μg/kg per week) was dose escalated using a modified toxicity probability interval design in three cohorts of four patients each, whereas pembrolizumab was dosed at 2 mg/kg every 3 weeks in the phase Ib portion. Thirty-one patients were enrolled in the phase II portion. Primary objectives were safety and incidence of dose-limiting toxicities. Secondary objectives included objective response rate, progression-free survival (PFS), and overall survival.
Results
Forty-three patients with stage IV melanoma were enrolled in the phase Ib and II portions of the study and included in the analysis. At the data cutoff date (December 31, 2017), median follow-up duration was 25 months (range, 1 to 38 months). All 43 patients experienced at least one adverse event; grade 3/4 treatment-related adverse events occurred in 21 of 43 patients (48.8%). Objective responses were seen at all three dose levels among 43 evaluable patients. The objective response rate was 60.5%, with 46.5% of patients exhibiting ongoing response. Median PFS was 11.0 months in all patients and unreached in responders, whereas median overall survival remained unreached in all patients. The 2-year PFS rate was 46%.
Conclusion
Pembrolizumab/PEG-IFN demonstrated an acceptable toxicity profile with promising evidence of clinical efficacy in PD-1–naïve metastatic melanoma. These results support the rationale to further investigate this pembrolizumab/PEG-IFN combination in this disease.
INTRODUCTION
Immunotherapy with programmed death-1 (PD-1) inhibitors is safe, produces durable responses in 30% to 40% of patients with advanced melanoma, and exhibits a favorable safety profile.1,2 The combination of the PD-1 inhibitor nivolumab and the cytotoxic T-cell lymphocyte-4 inhibitor ipilimumab yields higher overall response rates (58%) and durable survival compared with ipilimumab, although the incidence of grade 3/4 adverse events (AEs) is high, at 55%.3,4 Combinatorial therapies aiming at augmenting the effects of PD-1 blockade by counteracting the multiple mechanisms of melanoma-induced T-cell dysfunction are under way.5 Several biomarkers, including CD8+ T-cell infiltrate,6 PD-ligand 1 (PD-L1) expression,7 tumor mutation burden,8 and interferon (IFN) gamma gene expression profile (GEP),9,10 seem to correlate with response to PD-1 blockade. These data suggest that patients with melanoma with pre-existing T-cell immune responses are more likely to respond to PD-1 blockade.
Several lines of evidence support that type I IFN, including IFN-alpha (IFN-α), directly and indirectly modulate immune responses to melanoma and may add to PD-1 blockade in enhancing immune and clinical responses to melanoma. First, IFN-α exhibits direct antitumor effects.11-13 Second, IFN-α enhances class I expression to facilitate cytotoxic T-lymphocyte–mediated killing14 and is selectively required by dendritic cells for immune rejection of tumors in experimental models.15-17 Third, type I IFNs directly activate innate and adaptive immune cells, including CD4+ T, CD8+ T, and natural killer cells.18,19 Conversely, suppression of type I IFN signaling through downregulation of type I IFN α/beta receptor mediates melanoma progression.20 Finally, in vitro exposure to IFN-α increases PD-L1 expression in human cancers, including melanoma,21,22 whereas PD-1 blockade adds to IFN-α to boost antitumor effects in B16 melanoma-bearing mice.21 In this phase Ib/II study (ClinialTrials.gov identifier: NCT02112032; KEYNOTE-020) of pembrolizumab and PEG-IFN, we evaluated the efficacy and safety of the combination in PD-1–naïve patients with advanced melanoma.
PATIENTS AND METHODS
Patients
This single-center, open-label, phase Ib/II trial included patients with stage IV PD-1–naïve melanoma. Eligible patients (≥ 18 years) were characterized by the following: histologically confirmed mucosal or cutaneous melanoma (excluding uveal melanoma), were treatment naïve or pretreated (up to three treatments, excluding PD-1 inhibitors), life expectancy 3 months or more, an Eastern Cooperative Oncology Group performance status of 0 or 1, and measurable disease per Response Evaluation Criteria in Solid Tumors version 1.1 (RECIST v1.1). Patients who had prior immune-related AEs (irAEs) from ipilimumab could enroll if these had resolved (grade 0) or were stably controlled while receiving prednisone 10 mg or less per day (grade 1). Patients were excluded if they had a grade 4 irAE, active CNS metastases, and/or carcinomatous meningitis (treated CNS metastases were allowed if radiographically stable for ≥ 4 weeks); history of severe hypersensitivity reactions to prior monoclonal antibody therapy and/or IFN-α; or active autoimmune disease requiring systemic immune suppression (excluding asthma, atopy, type I diabetes, and vitiligo). Approval to treat patients was obtained from the University of Pittsburgh's Hillman Cancer Center (HCC) Institutional Review Board (No. PRO14030075). The authors attest that signed informed consent was obtained from all patients involved in the study.
Study Design and Treatment
The clinical trial enrolled 43 evaluable patients. The phase Ib portion studied escalating doses of PEG-IFN (1 μg/kg, 2 μg/kg, and 3 μg/kg, per week, subcutaneously) combined with pembrolizumab (2 mg/kg, every 3 weeks, intravenously) and included four patients at each of the three dose levels (Appendix Table A1, online only). The phase II portion studied the recommended phase II dose (RP2D) and included 31 patients (Appendix Figs A1 and A2, online only). A modified toxicity probability interval design was used to guide dose escalation.23-25 Only PEG-IFN dose reductions were permitted. Dose-limiting toxicities (DLT) were defined as grade 3 or greater AEs within 28 days of the first treatment cycle. Grade 3 fatigue was excluded from the DLT definition. RP2D was defined as the highest dose at which no more than one of four patients experienced a DLT. Patients were treated until disease progression. Responding patients received a maximum of 34 cycles over a 2-year period.
End Points
The primary end points of the study were safety and RP2D (phase I portion) and investigator-assessed objective response rate (ORR; phase II portion) by RECIST v1.1. Secondary end points included progression-free survival (PFS) at 6 months, overall survival (OS), and correlative analyses.
Assessments
Radiographic imaging was performed at baseline, then every 12 weeks until disease progression by computed tomography (CT) or positron emission tomography/CT. Response assessments were per RECIST v1.1. AEs were evaluated using the National Cancer Institute Common Terminology Criteria for Adverse Events version 4.0.
Statistical Analyses
Efficacy and safety were assessed in all patients who received one or more doses of pembrolizumab and PEG-IFN. The association between variables and response was examined by comparisons between responders and nonresponders with the two-sided two-sample t test, Wilcoxon signed rank or Fisher’s exact test, when appropriate. Survival data were analyzed with the Kaplan-Meier method and compared with log-rank tests. Association of variables with survival end points was examined with the Cox proportional hazards model. The sample size of up to 32 patients for the phase II part using modified toxicity probability interval design was determined by simulation. The sample size of 35 patients at RP2D was determined so that if the observed ORR was greater than or equal to 45%, the 90% exact CI (31% to 61%) was greater than 0.3, which represented the observed ORR with pembrolizumab monotherapy. Analyses were performed using a data cutoff date of December 31, 2017.
Tumor Biopsies
Tumor biopsies were obtained pretreatment and while receiving treatment (cycles three to five). Immunohistochemistry analyses were performed to detect lymphoid infiltrates (CD3, CD8, Foxp3) and PD-L1 expression (22C3 pharmDx assay, Dako North America, Carpinteria, CA). Tumor-infiltrating lymphocytes (TILs) were scored within the tumor and in the invasive margin from 0 to 4 as follows: 0 (0%), 1 (< 10%), 2 (< 20%), 3 (< 50%), and 4 (> 50%).6 PD-L1 expression (PD-L1 MEL score) on the extent of membranous staining of tumor cells and/or adjacent immune cells was scored from 1 to 5 as follows: 0 (0%), 1 (> 0% and ≤ 1%), 2 (> 1% to ≤ 10%), 3 (> 10% to ≤ 33%), 4 (> 33% to ≤ 66%), and 5 (> 66%).7 Tumors were considered PD-L1 positive if staining intensity was greater than or equal to 1%.
RNA Isolation and Gene Expression Analysis
Total RNA was isolated from formalin-fixed paraffin-embedded sections obtained from archival or fresh tumor samples (Ambion RecoverAll kit, Thermo Fisher Scientific, Waltham, MA).10 Gene expression analysis used the previously validated 18-GEP on the basis of the NanoString nCounter gene expression platform (NanoString Technologies, Seattle, WA).10
Radiographic Tumor Burden
Radiographic tumor burden (RTB) was calculated pretreatment in a blinded fashion using positron emission tomography/CT or CT scan. For each lesion, 3D tumor volume was calculated as the sum of products of the bidimensional measurement and the longest vertical diameters on the view perpendicular to the 1D and 2D planes. The 3D tumor volume was totaled and analyzed by site (liver, nonliver visceral, lung, skin/subcutaneous) in each patient. Association of response with RTB was studied by comparing log-transformed RTB data between responders and nonresponders using the two-sided two-sample t test. The association of PFS/OS with RTB was analyzed with univariable Cox proportional hazards model, whereas the association of PFS/OS controlling for lactate dehydrogenase (LDH) and M substage was tested in multivariable Cox models.
RESULTS
Patient Population
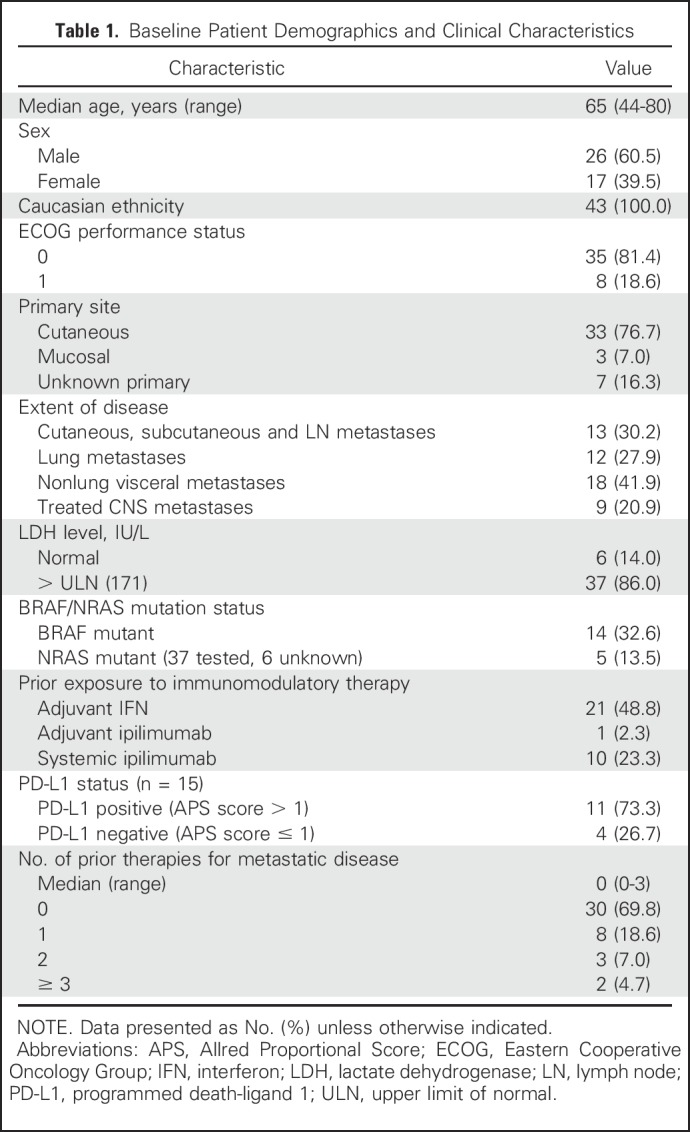
We enrolled 43 patients (median age, 65 years; range, 44 to 80 years) with advanced melanoma from August 2014 to April 2017. All patients were PD-1 inhibitor naïve. Baseline characteristics are listed in Table 1. Notably, 13 patients (30.2%) had received one or more lines of therapy for metastatic disease, whereas 22 (51.2%) had received either IFN or ipilimumab in the adjuvant setting. In addition, 13 (30.2%), 12 (27.9%), and 18 (41.9%) patients had distant skin, subcutaneous, or nodal metastases (M1a), pulmonary metastases (M1b), or visceral metastases (M1c), respectively. Treated and stable brain metastases were present in nine patients (20.9%). Pretreatment LDH was normal in six patients (14.0%) and elevated in 37 patients (86.0%).
Table 1.
Baseline Patient Demographics and Clinical Characteristics
Treatment-Related Toxicities
During the dose-escalation portion of the study, no DLT was observed in any of the three PEG-IFN dose cohorts. Because the DLT rate was less than 25%, 3 μg/kg PEG-IFN together with pembrolizumab (2 mg/kg) was determined to be the RP2D. Select treatment-related AEs (TRAEs) are listed in Table 2, and detailed TRAEs occurring in two or more patients are detailed in Appendix Table A2 (online only). TRAEs of any grade observed in greater than or equal to 10% of patients included grade 1 hyponatremia (11.1%), grade 2 lymphopenia (10.8%), grade 3 hyponatremia (10.3%), grade 3 lymphopenia (12.0%), and grade 3 fatigue (16.2%). Two patients treated at the 3 μg/kg PEG-IFN dose experienced grade 4 TRAEs. Both were irAEs, including pneumonitis and Vogt-Koyonagi-Harada uveitis. TRAE severity resulted in discontinuation of treatment in both patients. Remarkably, both patients exhibited ongoing responses in the absence of active treatment. We observed that 15 patients (34.9%) developed irAEs of any grade, including vitiligo (16.3%), hypothyroidism (16.3%), and one patient each with adrenal insufficiency (grade 3), pneumonitis (grade 4), and uveitis (grade 4). Patients who developed irAEs were more likely to be responders than nonresponders: vitiligo (six of seven patients with response) and hypothyroidism (five of seven patients with response). Overall, grade 3 to 4 TRAEs occurred in 21 patients (48.8%). No treatment-related deaths occurred. After the initial DLT period, 21 patients (48.8%) required one dose reduction of PEG-IFN, seven (33.3%) of whom also required a second dose reduction.
Table 2.
Select Treatment-Related Adverse Events Observed in Two or More Patients (N = 43)

Antitumor Activity
Forty-three patients were evaluable for efficacy. At the date of primary data cutoff (December 31, 2017), an event of disease progression or death had occurred in 22 patients. Median duration of follow-up was 25 months (range, ≥ 1 to 38 months). Investigator-assessed ORR was 60.5% (26 of 43) by RECIST v1.1, with 46.5% of patients (20 of 43) exhibiting an ongoing response (Table 3). Median time to response was 12 weeks, and median duration of response was not reached (Fig 1A). Ongoing responses were observed in patients who had either stable disease or partial response at their initial evaluation (Figs 1B and 1C). We did not observe atypical responses (pseudoprogression) that were previously described in up to 7% of patients with melanoma treated with pembrolizumab.26 Median PFS (mPFS) was 11 months (95% CI, 6 to not reached; Fig 2A) in all patients and unreached (95% CI, 25 to not reached) in responders. PFS rates at 6, 12, and 24 months were 64%, 46%, and 46%, respectively, in all patients. In nonresponders, mPFS was 6 months (95% CI, 2 to 8). Median OS in all patients was not reached (95% CI, 21 to infinity; Fig 2B), and the 1- and 2- year OS rates were 73% and 57%, respectively. PFS was not significantly different among patients previously treated with IFN-α or ipilimumab (Appendix Figs A2 and A3, online only).
Table 3.
Best and Current Overall Response (investigator assessed, per RECIST v1.1; N = 43)
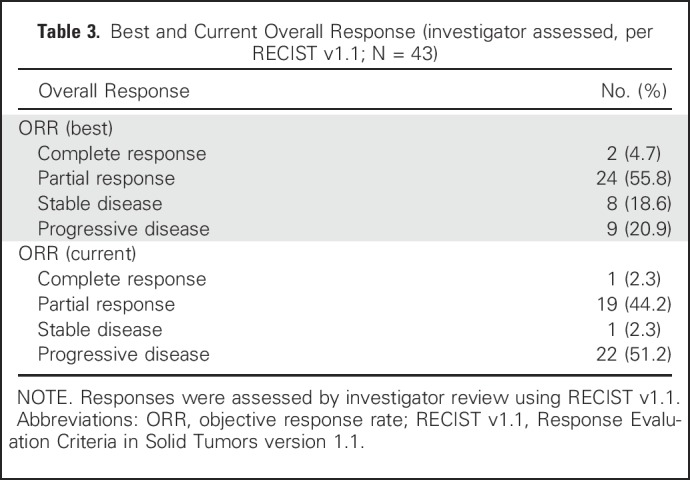
Fig 1.

(A) Treatment exposure and response duration by Response Evaluation Criteria in Solid Tumors version 1.1 (RECIST v1.1; investigator assessed; n = 43). The length of each bar corresponds to the duration of time patients received treatment (in months). Response symbols represent status at first report and at most recent review. (B) Radiographic change of tumor burden from baseline (investigator assessed per RECIST v1.1; n = 43). Two patients had ongoing responses after treatment discontinuation for grade 4 treatment-related adverse events (dashed gray lines). (C) Maximal change in tumor size from baseline (investigator assessed per RECIST v1.1; n = 43). Bar length reflects maximal decrease/increase in size of target lesion(s). Bar color reflects best overall response. irAE, immune-related adverse events.
Fig 2.

Survival of patients with programmed death-1–naïve melanoma in KEYNOTE-020: (A) progression-free survival; (B) overall survival. Percentages are the proportion of patients with survival at that time point. Numbers of patients at risk at each time point are shown below the x-axis.
GEP Using NanoString
Fifty-six samples from 18 patients were obtained, including nine archived formalin-fixed paraffin-embedded samples and 47 biopsies during clinical trial. At baseline, the distribution of GEP scores was similar in responders and nonresponders (Fig 3A). Pretreatment GEP scores in all patients were higher than previously reported (ie, > −0.318).10 While receiving treatment, GEP scores were significantly increased in both responders and nonresponders compared with baseline (one-sided P = .049), although this increase was not particularly greater in responders compared with nonresponders (one-sided P = .201; Fig 3B).
Fig 3.

(A) Gene expression profile (GEP) scores for patients at pre-treatment timepoint by response status. GEP scores based on data from 16 patients classified by current response (left) and best response RECIST v1.1 (right). (B) Subject-level GEP scores on treatment by best overall response status. On-treatment GEP scores based on data from 14 patients. In all patients, GEP scores were significantly greater on-treatment compared to baseline (1-sided P value 0.049). Response is classified as best overall response and calculated using RECIST v1.1. CR, complete response; PR, partial response; pt, patient; EOT, end of treatment; RECIST v1.1, Response Evaluation Criteria in Solid Tumors version 1.1; Scr, screening.
Tumor-Infiltrating T Cells and PD-L1 Expression
Of the 22 patients sampled for T-cell analyses by immunohistochemistry, 21 patients had samples deemed adequate. Responding patients exhibited greater pretreatment CD8+ T-cell infiltrates at the invasive margin than nonresponding patients (P = .0342) (Appendix Fig A4A, online only). Pretreatment and on-treatment peritumoral CD8+ T-cell infiltrates did not differ significantly between responders and nonresponders. There was no significant relationship between pretreatment CD4+ T-cell or Foxp3+ infiltrates and response to therapy (Appendix Fig A4A).
Pretreatment tumor samples from 15 patients were evaluated for PD-L1 staining. We observed that four (26.7%) samples were PD-L1 negative (PD-L1 MEL score ≤ 1), whereas 11 samples (73.3%) were PD-L1 positive (PD-L1 MEL score > 1; Appendix Fig A4B). Responders had higher pretreatment PD-L1 values than nonresponders, although this difference was not statistically significant (P = 1.00).
Total Body Tumor Burden
Baseline RTB was higher in nonresponders than responders, but this difference did not reach statistical significance (two-sided P = .08; Appendix Fig A5A, online only). When evaluated by site, the correlation of higher pretreatment liver RTB with nonresponse nearly reached statistical significance (two-sided P = .0518), whereas pretreatment RTB at other sites (nonliver visceral, lung, and skin/subcutaneous/lymph node) was not associated with response (Appendix Fig A5A). Patients with liver-dominant disease (defined as a ratio of liver RTB; total RTB > 1) were more likely to be nonresponders (two-sided P = .0731; Appendix Fig A5A). Notably, higher RTB was significantly associated with shorter PFS (P = .0030) and OS (P = .0035), even after controlling for elevated LDH and disease stage (Appendix Fig A5B).
DISCUSSION
The results from the phase Ib/II KEYNOTE-020 trial presented herein suggest that the combination of pembrolizumab and PEG-IFN exhibits significant clinical activity in PD-1–naïve melanoma. ORR was 60.5%, with 46.5% of patients exhibiting an ongoing response, including one complete response and 19 partial responses. The current disease control rate was 48.8%. Although these findings have to be interpreted cautiously in the absence of a control group, the 24-month PFS rate of 46% measures favorably compared with the 24-month PFS rates of 28% (10 mg/kg every 3 weeks) and 31% (10 mg/kg every 2 weeks) reported in the KEYNOTE-006 study (ClinicalTrials.gov identifier: NCT01866319).27 The safety profile of the combination was notable for higher rates of grade 3 fatigue (16.2%) and grade 3 lymphopenia (12.0%) compared with the KEYNOTE-006 study, likely because of PEG-IFN. The incidence of severe hyponatremia (grade 3, 10.3%) was similar to that observed in other studies of pembrolizumab and nivolumab.4,27 Two patients (4.7%) discontinued both pembrolizumab and PEG-IFN because of grade 4 TRAEs. Interestingly, both patients continue to respond favorably without any subsequent treatment. No treatment-related deaths occurred. The efficacy of the combination did not seem to be affected by the receipt of prior IFN-α and/or ipilimumab. Therefore, our data support that the combination of pembrolizumab 2 mg/kg and PEG-IFN 3 μg/kg per week is active and safe in patients with advanced melanoma.
Our findings contrast with those of the phase Ib KEYNOTE-029 (ClinicalTrials.gov identifier: NCT02089685) study that also tested pembrolizumab in combination with PEG-IFN in melanoma and renal cell carcinoma (RCC).28 This study included a separate arm that evaluated pembrolizumab with low-dose ipilimumab (1 mg/kg every 3 weeks for four doses) that was independently reported.29 In the PEG-IFN arm, which accrued 17 patients, dose escalation did not proceed beyond dose level 2 (PEG-IFN 2 μg/kg per week) because DLTs occurred in 67% of patients at this dose level. The ORRs of 20% (melanoma, one of five patients) and 17% (RCC, two of 12 patients) were lower than those observed in other studies of PD-1 inhibitors in melanoma (33% to 44%; KEYNOTE-006 and CheckMate 037; ClinicalTrials.gov identifiers: NCT01866319 and NCT01721746 respectively)30,31 and RCC (25%; CheckMate 025; ClinicalTrials. gov identifier: NCT01668784).32 Only five patients with melanoma across two dose levels were included in KEYNOTE-029, which limits the interpretation of the findings in melanoma. Of note, the incidence of grade 3 to 4 TRAEs in KEYNOTE-029 patients treated with pembrolizumab and PEG-IFN (58.8%) was higher than what was observed in our study (48.8%).
The presence of CD8+ T-cell infiltrates was significantly associated with response in agreement with the established prognostic value of CD8+ T-cell infiltrates in predicting favorable clinical outcome while receiving PD-1 therapy in melanoma.6,33,34 Within the tumor microenvironment (TME), CD8+ TILs and PD-L1 are often closely linked because CD8+ TILs induce PD-L1 expression on tumor through the production of IFN-gamma.35,36 When we analyzed the prognostic relevance of PD-L1 expression in combination with CD8+ TIL density, patients with PD-L1 greater than 1/CD8 T cell greater than 1 had greater mPFS than the entire cohort (18 v 11 months). However, the small number of patients in other categories (PD-L1/CD8 ≤ 1; PD-L1 > 1/CD8 ≤ 1; and PD-L1 > 1/CD8 ≤ 1) precluded formal statistical comparisons among these groups. Whether the association of high CD8+ TIL density together with high PD-L1 expression may better predict response to PD-1 therapy than either CD8+ TIL density or PD-L1 expression alone warrants additional investigation.
The 18-gene immune-related GEP incorporates multiple genes related to antigen presentation, chemokine expression, and adaptive immunity.10,37 The GEP seems to predict response to anti–PD-1 immunotherapy in melanoma. In this study, the pretreatment GEP scores did not significantly differ between responders and nonresponders.10 This may be a result of the small sample size and precludes us from additional inference that may be better assessed in a larger study. The GEP scores were significantly higher in all patients (> −0.318), suggesting that the tumors in both responders and nonresponders were more inflamed before therapy. Finally, the GEP scores increased significantly after treatment in both responders and nonresponders, although this difference was not greater in responders compared with nonresponders.
Higher baseline tumor size, including a maximum of 10 lesions or five per organ, was adversely associated with survival in patients receiving anti–PD-1 immunotherapy independent of LDH or metastatic disease substage.38 To better evaluate the role of total RTB in determining response to therapy, we measured the RTB and observed that it was adversely associated with PFS and OS. These findings are concordant with the evidence that antigen burden acts as the primary driver of T-cell exhaustion39,40 and that high tumor burden together with T-cell reinvigoration may predict response to PD-1 blockade.41 Collectively, the findings in this study suggest that RTB should be further assessed in prospective studies of anti–PD-1 immunotherapy combinations.
In conclusion, the combination of pembrolizumab and PEG-IFN seems to be safe and active in PD-1–naïve melanoma. Pretreatment lower RTB and greater CD8+ T-cell infiltrates were significantly associated with improved response. The promising clinical efficacy of the proposed combinatorial therapy will need to be further evaluated in a larger randomized clinical trial.
ACKNOWLEDGMENT
We thank the patients, their families, and their caregivers for participating in this trial and all investigators and site personnel.
Appendix
Fig A1.

(*) Phase IB/II Study of Pembrolizumab With PEG-IFN in PD-1 Naïve Melanoma: Study Schema.
Fig A2.

Progression-free survival of patients treated in KEYNOTE-020 by prior receipt of IFN (N = 43).
Fig A3.

Progression-free survival of patients treated in KEYNOTE-020 by prior receipt of ipilimumab (N = 43).
Fig A4.

Evaluation of CD8+ T cell infiltrates and PD-L1 expression in tumor samples. (A) T-cell analyses by IHC on pre- and on- treatment tumor samples (N = 21); (B) Pre-treatment PD-L1 staining by IHC on pre- and on- treatment tumor samples (N = 15). Response is classified as best overall response. CR, complete response; IHC, immunohistochemistry; NR, non-responder; PD, progressive disease; PR, partial response; R, responder; SD, stable disease.
Fig A5.

(A) Baseline radiographic tumor burden (RTB) in all patients (N = 43). Total RTB was greater in responders compared to non-responders (left, P = 0.08). Patients with higher liver disease burden were more likely to be non-responders, whether liver tumor burden was considered alone (middle, P = 0.0518) or as a fraction of the total tumor burden (right, P = 0.0731). (B). Higher RTB was associated with shorter PFS and OS, even after controlling for LDH and disease sub-stage. LDH, lactate dehydrogenase; LN, lymph node; NR, non-responder; OS, overall survival; PFS, progression-free survival; R, responder; RTB, radiographic tumor burden; SD, stable disease; ULN, upper limit of normal.
Table A1.
Phase IB/II study of Pembrolizumab with PEG-IFN in PD-1 Naïve Melanoma: Dose Levels
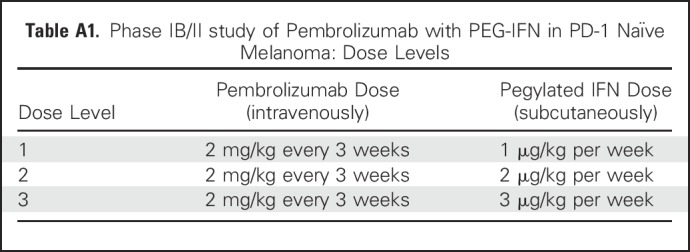
Table A2.
Treatment-Related Adverse Events Observed in Two or More Patients (N = 43)

Footnotes
Supported by an Academy-Industry Award from the Melanoma Research Alliance and Merck (H.M.Z.), National Cancer Institute Grant No. P50 CA121973 (J.M.K.), Cancer Center Foundation Genentech BioOncolog Young Investigator Award, and a grant from the Harry J Lloyd Trust (D.D.).
Presented at the American Society of Clinical Oncology Annual Meeting, Chicago, IL, June 3-7, 2016.
Clinical trial information: NCT02112032.
AUTHOR CONTRIBUTIONS
Conception and design: Hong Wang, Scott Ebbinghaus, John M. Kirkwood, Hassane M. Zarour
Administrative support: Ornella Pagliano, John M. Kirkwood
Provision of study materials or patients: Ahmad A. Tarhini, Hussein A. Tawbi, Blanca H. Moreno, John M. Kirkwood
Collection and assembly of data: Diwakar Davar, Ornella Pagliano, Amy Rose, Cindy Sander, Amir A. Borhani, Arivarasan Karunamurthy, Ahmad A. Tarhini, Hussein A. Tawbi, Blanca H. Moreno, John M. Kirkwood
Data analysis and interpretation: Diwakar Davar, Hong Wang, Joe-Marc Chauvin, Julien J. Fourcade, Mignane Ka, Carmine Menna, Arivarasan Karunamurthy, Ahmad A. Tarhini, Hussein A. Tawbi, Qing Zhao, Blanca H. Moreno, Scott Ebbinghaus, Nageatte Ibrahim, John M. Kirkwood, Hassane M. Zarour
Manuscript writing: All authors
Final approval of manuscript: All authors
Accountable for all aspects of the work: All authors
AUTHORS' DISCLOSURES OF POTENTIAL CONFLICTS OF INTEREST
Phase Ib/II Study of Pembrolizumab and Pegylated-Interferon Alfa-2b in Advanced Melanoma
The following represents disclosure information provided by authors of this manuscript. All relationships are considered compensated. Relationships are self-held unless noted. I = Immediate Family Member, Inst = My Institution. Relationships may not relate to the subject matter of this manuscript. For more information about ASCO's conflict of interest policy, please refer to www.asco.org/rwc or ascopubs.org/jco/site/ifc.
Diwakar Davar
Consulting or Advisory Role: Merck, Incyte
Research Funding: Bristol-Myers Squibb, Merck, Checkmate Pharmaceuticals, Incyte
Hong Wang
No relationship to disclose
Joe-Marc Chauvin
No relationship to disclose
Ornella Pagliano
No relationship to disclose
Julien J. Fourcade
No relationship to disclose
Mignane Ka
No relationship to disclose
Carmine Menna
No relationship to disclose
Amy Rose
No relationship to disclose
Cindy Sander
No relationship to disclose
Amir A. Borhani
Honoraria: Guerbet
Patents, Royalties, Other Intellectual Property: Receiving royalties from Elsevier and Amirsys publishing companies for authoring books in field of radiology
Travel, Accommodations, Expenses: Guerbet
Arivarasan Karunamurthy
No relationship to disclose
Ahmad A. Tarhini
Consulting or Advisory Role: Bristol-Myers Squibb, Merck, Genentech, Incyte, Newlink Genetics, Array BioPharma, Novartis, OncoSec
Research Funding: Incyte (Inst), Prometheus Laboratories (Inst), Bristol-Myers Squibb (Inst), Amgen (Inst), Incyte (Inst), Novartis (Inst), Prometheus Laboratories (Inst), GreenPeptide (Inst), Merck (Inst)
Hussein A. Tawbi
Consulting or Advisory Role: Novartis, Bristol-Myers Squibb, Genentech, Merck
Research Funding: Bristol-Myers Squibb (Inst), Novartis (Inst), Merck (Inst), GlaxoSmithKline (Inst), Genentech (Inst)
Qing Zhao
Employment: Merck Sharp & Dohme
Blanca H. Moreno
Employment: Merck Sharp & Dohme
Scott Ebbinghaus
Employment: Merck
Stock and Other Ownership Interests: Merck
Nageatte Ibrahim
Employment: Merck
Stock and Other Ownership Interests: Merck, GlaxoSmithKline
John M. Kirkwood
Consulting or Advisory Role: Bristol-Myers Squibb, Novartis, Array BioPharma, Merck, Roche, Amgen, Immunocore
Research Funding: Merck (Inst), Prometheus Laboratories (Inst)
Hassane M. Zarour
Research Funding: Bristol-Myers Squibb (Inst), Merck Sharp & Dohme (Inst), Tesaro (Inst)
REFERENCES
- 1.Larkin J, Lao CD, Urba WJ, et al. : Efficacy and safety of nivolumab in patients with BRAF V600 mutant and BRAF wild-type advanced melanoma: A pooled analysis of 4 clinical trials. JAMA Oncol 1:433-440, 2015 [DOI] [PubMed] [Google Scholar]
- 2.Ribas A, Hamid O, Daud A, et al. : Association of pembrolizumab with tumor response and survival among patients with advanced melanoma. JAMA 315:1600-1609, 2016 [DOI] [PubMed] [Google Scholar]
- 3.Larkin J, Chiarion-Sileni V, Gonzalez R, et al. : Combined nivolumab and ipilimumab or monotherapy in untreated melanoma. N Engl J Med 373:23-34, 2015 [DOI] [PMC free article] [PubMed] [Google Scholar]
- 4.Wolchok JD, Chiarion-Sileni V, Gonzalez R, et al. : Overall survival with combined nivolumab and ipilimumab in advanced melanoma. N Engl J Med 377:1345-1356, 2017 [DOI] [PMC free article] [PubMed] [Google Scholar]
- 5.Zarour HM: Reversing T-cell dysfunction and exhaustion in cancer. Clin Cancer Res 22:1856-1864, 2016 [DOI] [PMC free article] [PubMed] [Google Scholar]
- 6.Tumeh PC, Harview CL, Yearley JH, et al. : PD-1 blockade induces responses by inhibiting adaptive immune resistance. Nature 515:568-571, 2014 [DOI] [PMC free article] [PubMed] [Google Scholar]
- 7.Daud AI, Wolchok JD, Robert C, et al. : Programmed death-ligand 1 expression and response to the anti-programmed death 1 antibody pembrolizumab in melanoma. J Clin Oncol 34:4102-4109, 2016 [DOI] [PMC free article] [PubMed] [Google Scholar]
- 8.Eroglu Z, Zaretsky JM, Hu-Lieskovan S, et al. : High response rate to PD-1 blockade in desmoplastic melanomas. Nature 553:347-350, 2018 [DOI] [PMC free article] [PubMed] [Google Scholar]
- 9. Ayers M, Lunceford J, Nebozhyn M, et al: Relationship between immune gene signatures and clinical response to PD-1 blockade with pembrolizumab (MK-3475) in patients with advanced solid tumors. J Immunother Cancer 3:P80, 2015 (suppl 2) [Google Scholar]
- 10.Ayers M, Lunceford J, Nebozhyn M, et al. : IFN-γ-related mRNA profile predicts clinical response to PD-1 blockade. J Clin Invest 127:2930-2940, 2017 [DOI] [PMC free article] [PubMed] [Google Scholar]
- 11.Perrot I, Deauvieau F, Massacrier C, et al. : TLR3 and Rig-like receptor on myeloid dendritic cells and Rig-like receptor on human NK cells are both mandatory for production of IFN-gamma in response to double-stranded RNA. J Immunol 185:2080-2088, 2010 [DOI] [PMC free article] [PubMed] [Google Scholar]
- 12.Salcedo R, Worschech A, Cardone M, et al. : MyD88-mediated signaling prevents development of adenocarcinomas of the colon: Role of interleukin 18. J Exp Med 207:1625-1636, 2010 [DOI] [PMC free article] [PubMed] [Google Scholar]
- 13.Vacchelli E, Sistigu A, Yamazaki T, et al. : Autocrine signaling of type 1 interferons in successful anticancer chemotherapy. OncoImmunology 4:e988042, 2015 [DOI] [PMC free article] [PubMed] [Google Scholar]
- 14.Ferrantini M, Capone I, Belardelli F: Interferon-alpha and cancer: Mechanisms of action and new perspectives of clinical use. Biochimie 89:884-893, 2007 [DOI] [PubMed] [Google Scholar]
- 15.Fuertes MB, Kacha AK, Kline J, et al. : Host type I IFN signals are required for antitumor CD8+ T cell responses through CD8alpha+ dendritic cells. J Exp Med 208:2005-2016, 2011 [DOI] [PMC free article] [PubMed] [Google Scholar]
- 16.Diamond MS, Kinder M, Matsushita H, et al. : Type I interferon is selectively required by dendritic cells for immune rejection of tumors. J Exp Med 208:1989-2003, 2011 [DOI] [PMC free article] [PubMed] [Google Scholar]
- 17.Spaapen RM, Leung MYK, Fuertes MB, et al. : Therapeutic activity of high-dose intratumoral IFN-β requires direct effect on the tumor vasculature. J Immunol 193:4254-4260, 2014 [DOI] [PubMed] [Google Scholar]
- 18.Curtsinger JM, Valenzuela JO, Agarwal P, et al. : Type I IFNs provide a third signal to CD8 T cells to stimulate clonal expansion and differentiation. J Immunol 174:4465-4469, 2005 [DOI] [PubMed] [Google Scholar]
- 19.Zitvogel L, Galluzzi L, Kepp O, et al. : Type I interferons in anticancer immunity. Nat Rev Immunol 15:405-414, 2015 [DOI] [PubMed] [Google Scholar]
- 20.Katlinskaya YV, Katlinski KV, Yu Q, et al. : Suppression of type I interferon signaling overcomes oncogene-induced senescence and mediates melanoma development and progression. Cell Reports 15:171-180, 2016 [DOI] [PMC free article] [PubMed] [Google Scholar]
- 21.Iwai Y, Ishida M, Tanaka Y, et al. : Involvement of PD-L1 on tumor cells in the escape from host immune system and tumor immunotherapy by PD-L1 blockade. Proc Natl Acad Sci USA 99:12293-12297, 2002 [DOI] [PMC free article] [PubMed] [Google Scholar]
- 22.Blank C, Brown I, Peterson AC, et al. : PD-L1/B7H-1 inhibits the effector phase of tumor rejection by T cell receptor (TCR) transgenic CD8+ T cells. Cancer Res 64:1140-1145, 2004 [DOI] [PubMed] [Google Scholar]
- 23. doi: 10.1177/1740774510382799. Ji Y, Liu P, Bekele BN, et al: A modified toxicity probability interval method for dose-finding trials. Clin Trials 7:653-663, 2010. [DOI] [PMC free article] [PubMed] [Google Scholar]
- 24.Ji Y, Wang S-J: Modified toxicity probability interval design: A safer and more reliable method than the 3 + 3 design for practical phase I trials. J Clin Oncol 31:1785-1791, 2013 [DOI] [PMC free article] [PubMed] [Google Scholar]
- 25.Hu B, Bekele BN, Ji Y: Adaptive dose insertion in early phase clinical trials. Clin Trials 10:216-224, 2013 [DOI] [PubMed] [Google Scholar]
- 26.Hodi FS, Hwu W-J, Kefford R, et al. : Evaluation of immune-related response criteria and RECIST v1.1 in patients with advanced melanoma treated with pembrolizumab. J Clin Oncol 34:1510-1517, 2016 [DOI] [PMC free article] [PubMed] [Google Scholar]
- 27.Schachter J, Ribas A, Long GV, et al. : Pembrolizumab versus ipilimumab for advanced melanoma: Final overall survival results of a multicentre, randomised, open-label phase 3 study (KEYNOTE-006). Lancet 390:1853-1862, 2017 [DOI] [PubMed] [Google Scholar]
- 28.Atkins MB, Hodi FS, Thompson JA, et al. : Pembrolizumab plus pegylated interferon alfa-2b or ipilimumab for advanced melanoma or renal cell carcinoma: Dose-finding results from the phase Ib KEYNOTE-029 study. Clin Cancer Res 24:1805-1815, 2018 [DOI] [PubMed] [Google Scholar]
- 29.Long GV, Atkinson V, Cebon JS, et al. : Standard-dose pembrolizumab in combination with reduced-dose ipilimumab for patients with advanced melanoma (KEYNOTE-029): An open-label, phase 1b trial. Lancet Oncol 18:1202-1210, 2017 [DOI] [PubMed] [Google Scholar]
- 30.Robert C, Schachter J, Long GV, et al. : Pembrolizumab versus ipilimumab in advanced melanoma. N Engl J Med 372:2521-2532, 2015 [DOI] [PubMed] [Google Scholar]
- 31.Larkin J, Minor D, D’Angelo S, et al. : Overall survival in patients with advanced melanoma who received nivolumab versus investigator’s choice chemotherapy in CheckMate 037: A randomized, controlled, open-label phase III trial. J Clin Oncol 36:383-390, 2018 [DOI] [PMC free article] [PubMed] [Google Scholar]
- 32.Motzer RJ, Escudier B, McDermott DF, et al. : Nivolumab versus everolimus in advanced renal-cell carcinoma. N Engl J Med 373:1803-1813, 2015 [DOI] [PMC free article] [PubMed] [Google Scholar]
- 33.Kluger HM, Zito CR, Barr ML, et al. : Characterization of PD-L1 expression and associated T-cell infiltrates in metastatic melanoma samples from variable anatomic sites. Clin Cancer Res 21:3052-3060, 2015 [DOI] [PMC free article] [PubMed] [Google Scholar]
- 34.Spranger S, Bao R, Gajewski TF: Melanoma-intrinsic β-catenin signalling prevents anti-tumour immunity. Nature 523:231-235, 2015 [DOI] [PubMed] [Google Scholar]
- 35.Dong H, Zhu G, Tamada K, et al. : B7-H1, a third member of the B7 family, co-stimulates T-cell proliferation and interleukin-10 secretion. Nat Med 5:1365-1369, 1999 [DOI] [PubMed] [Google Scholar]
- 36.Sanmamed MF, Chen L: Inducible expression of B7-H1 (PD-L1) and its selective role in tumor site immune modulation. Cancer J 20:256-261, 2014 [DOI] [PMC free article] [PubMed] [Google Scholar]
- 37.Prat A, Navarro A, Paré L, et al. : Immune-related gene expression profiling after PD-1 blockade in non-small cell lung carcinoma, head and neck squamous cell carcinoma, and melanoma. Cancer Res 77:3540-3550, 2017 [DOI] [PubMed] [Google Scholar]
- 38. doi: 10.1158/1078-0432.CCR-17-2386. Joseph RW, Elassaiss-Schaap J, Kefford R, et al: Baseline tumor size is an independent prognostic factor for overall survival in patients with melanoma treated with pembrolizumab. Clin Cancer Res 10.1158/1078-0432.CCR-17-2386 [epub ahead of print on April 23, 2018] [DOI] [PMC free article] [PubMed] [Google Scholar]
- 39.Wherry EJ, Blattman JN, Murali-Krishna K, et al. : Viral persistence alters CD8 T-cell immunodominance and tissue distribution and results in distinct stages of functional impairment. J Virol 77:4911-4927, 2003 [DOI] [PMC free article] [PubMed] [Google Scholar]
- 40.Blackburn SD, Shin H, Haining WN, et al. : Coregulation of CD8+ T cell exhaustion by multiple inhibitory receptors during chronic viral infection. Nat Immunol 10:29-37, 2009 [DOI] [PMC free article] [PubMed] [Google Scholar]
- 41.Huang AC, Postow MA, Orlowski RJ, et al. : T-cell invigoration to tumour burden ratio associated with anti-PD-1 response. Nature 545:60-65, 2017 [DOI] [PMC free article] [PubMed] [Google Scholar]